

Nike yields 4.58% today, has raised its dividend for 24 straight years, and passes the Chowder Rule.
Its free cash flow didn’t cover the dividend last fiscal year.
So what good is the rule?
Plenty, if we use it for the role it was built for. The Chowder Rule is one of the handiest screens a dividend investor has; it takes two numbers we can find in five minutes and filters out most of the stocks we shouldn’t spend time on. It can’t tell us whether the dividend is safe, despite what many investors think.
In today’s article, we will cover:
What the Chowder Rule Is
How to Calculate the Chowder Number
The Three Thresholds, and Where REITs Fit
Five Dividend Universe Names Filtered Through the Rule
Where the Chowder Rule Fails
How to Use It in Your Process
Okay, let’s dive in and learn how to run the Chowder Rule the right way.
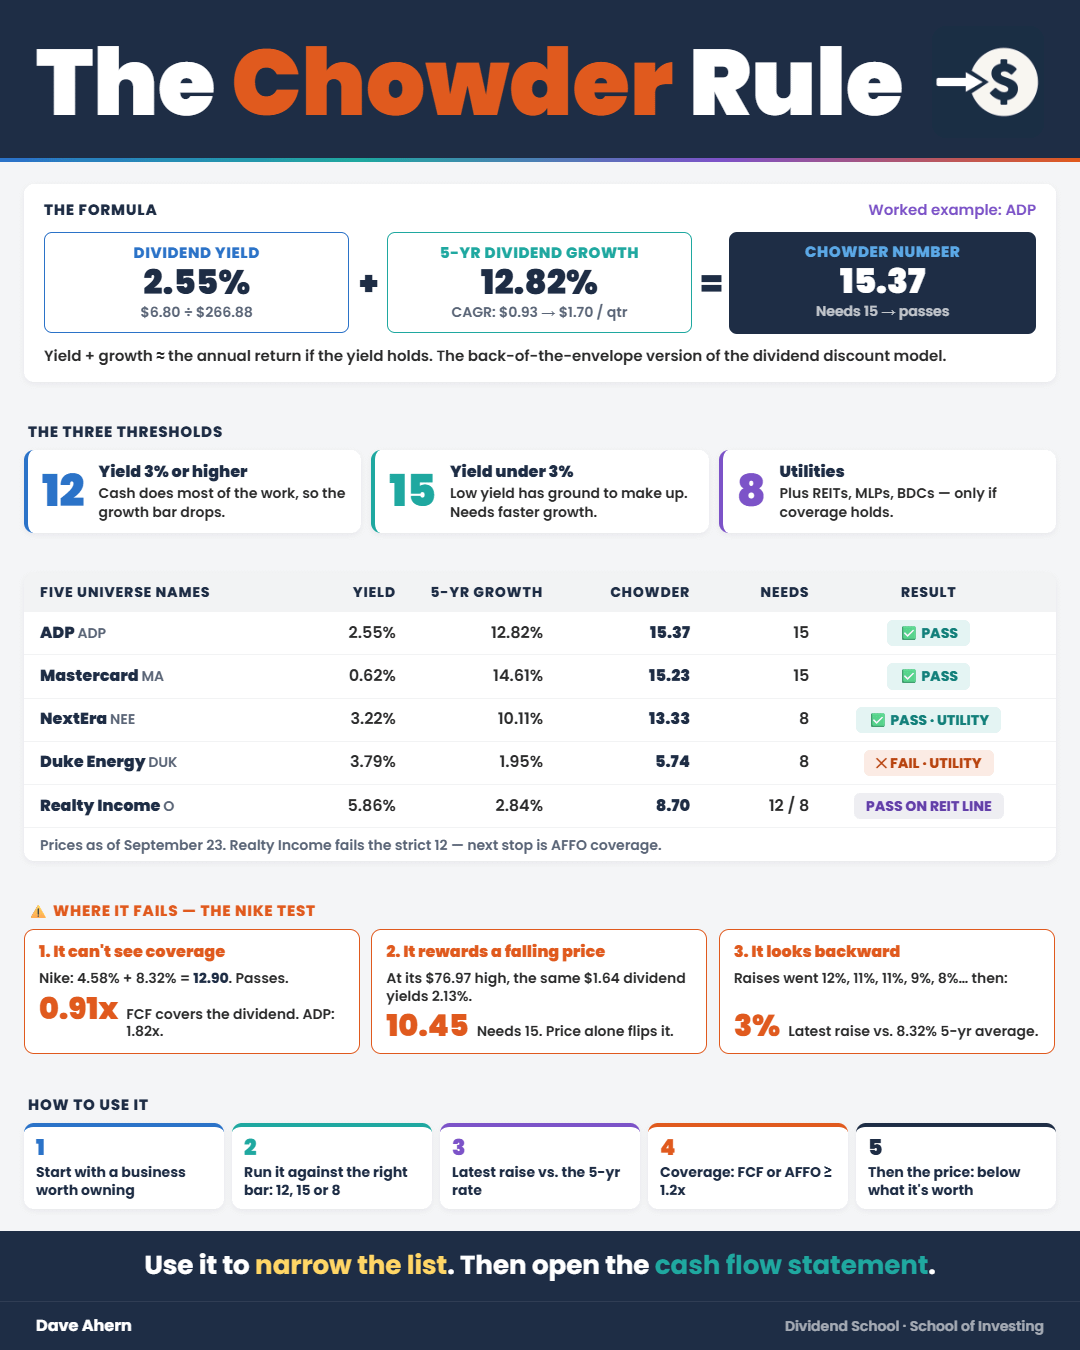
What the Chowder Rule Is
The rule comes from a Seeking Alpha contributor who went by the name “Chowder,” a regular in the dividend growth investing community there. Dividend investors have been quoting it ever since.
The idea is simple. Add the dividend yield to the five-year dividend growth rate:
Chowder number = dividend yield + five-year dividend growth rate
Then compare the result to a minimum. Clear the bar and the stock moves on to a closer look. Miss it, and we move on.
Why add the two together?
Because together they estimate what the stock returns each year if the yield stays where it is.
If you read “How to Value a Dividend Stock” back in August, this is the same idea that sits inside the dividend discount model: return equals yield plus growth. The Chowder number is the back-of-the-envelope version of that math.
A big caveat before we go any further. The growth half of the number looks backward. It tells us what management did over the last five years, not what they will do over the next five, and my crystal ball is as cloudy as anyone’s. Chowder’s own advice was to use the rule only after we’ve found a high-quality business worth owning.
How to Calculate the Chowder Number
Two inputs, and we can find both on the company’s investor relations page.
Let’s use ADP as our guinea pig.
Step 1: the yield. ADP pays $1.70 a quarter, so $6.80 a year. At $266.88 a share:
Yield: 2.55% ($6.80 / $266.88)
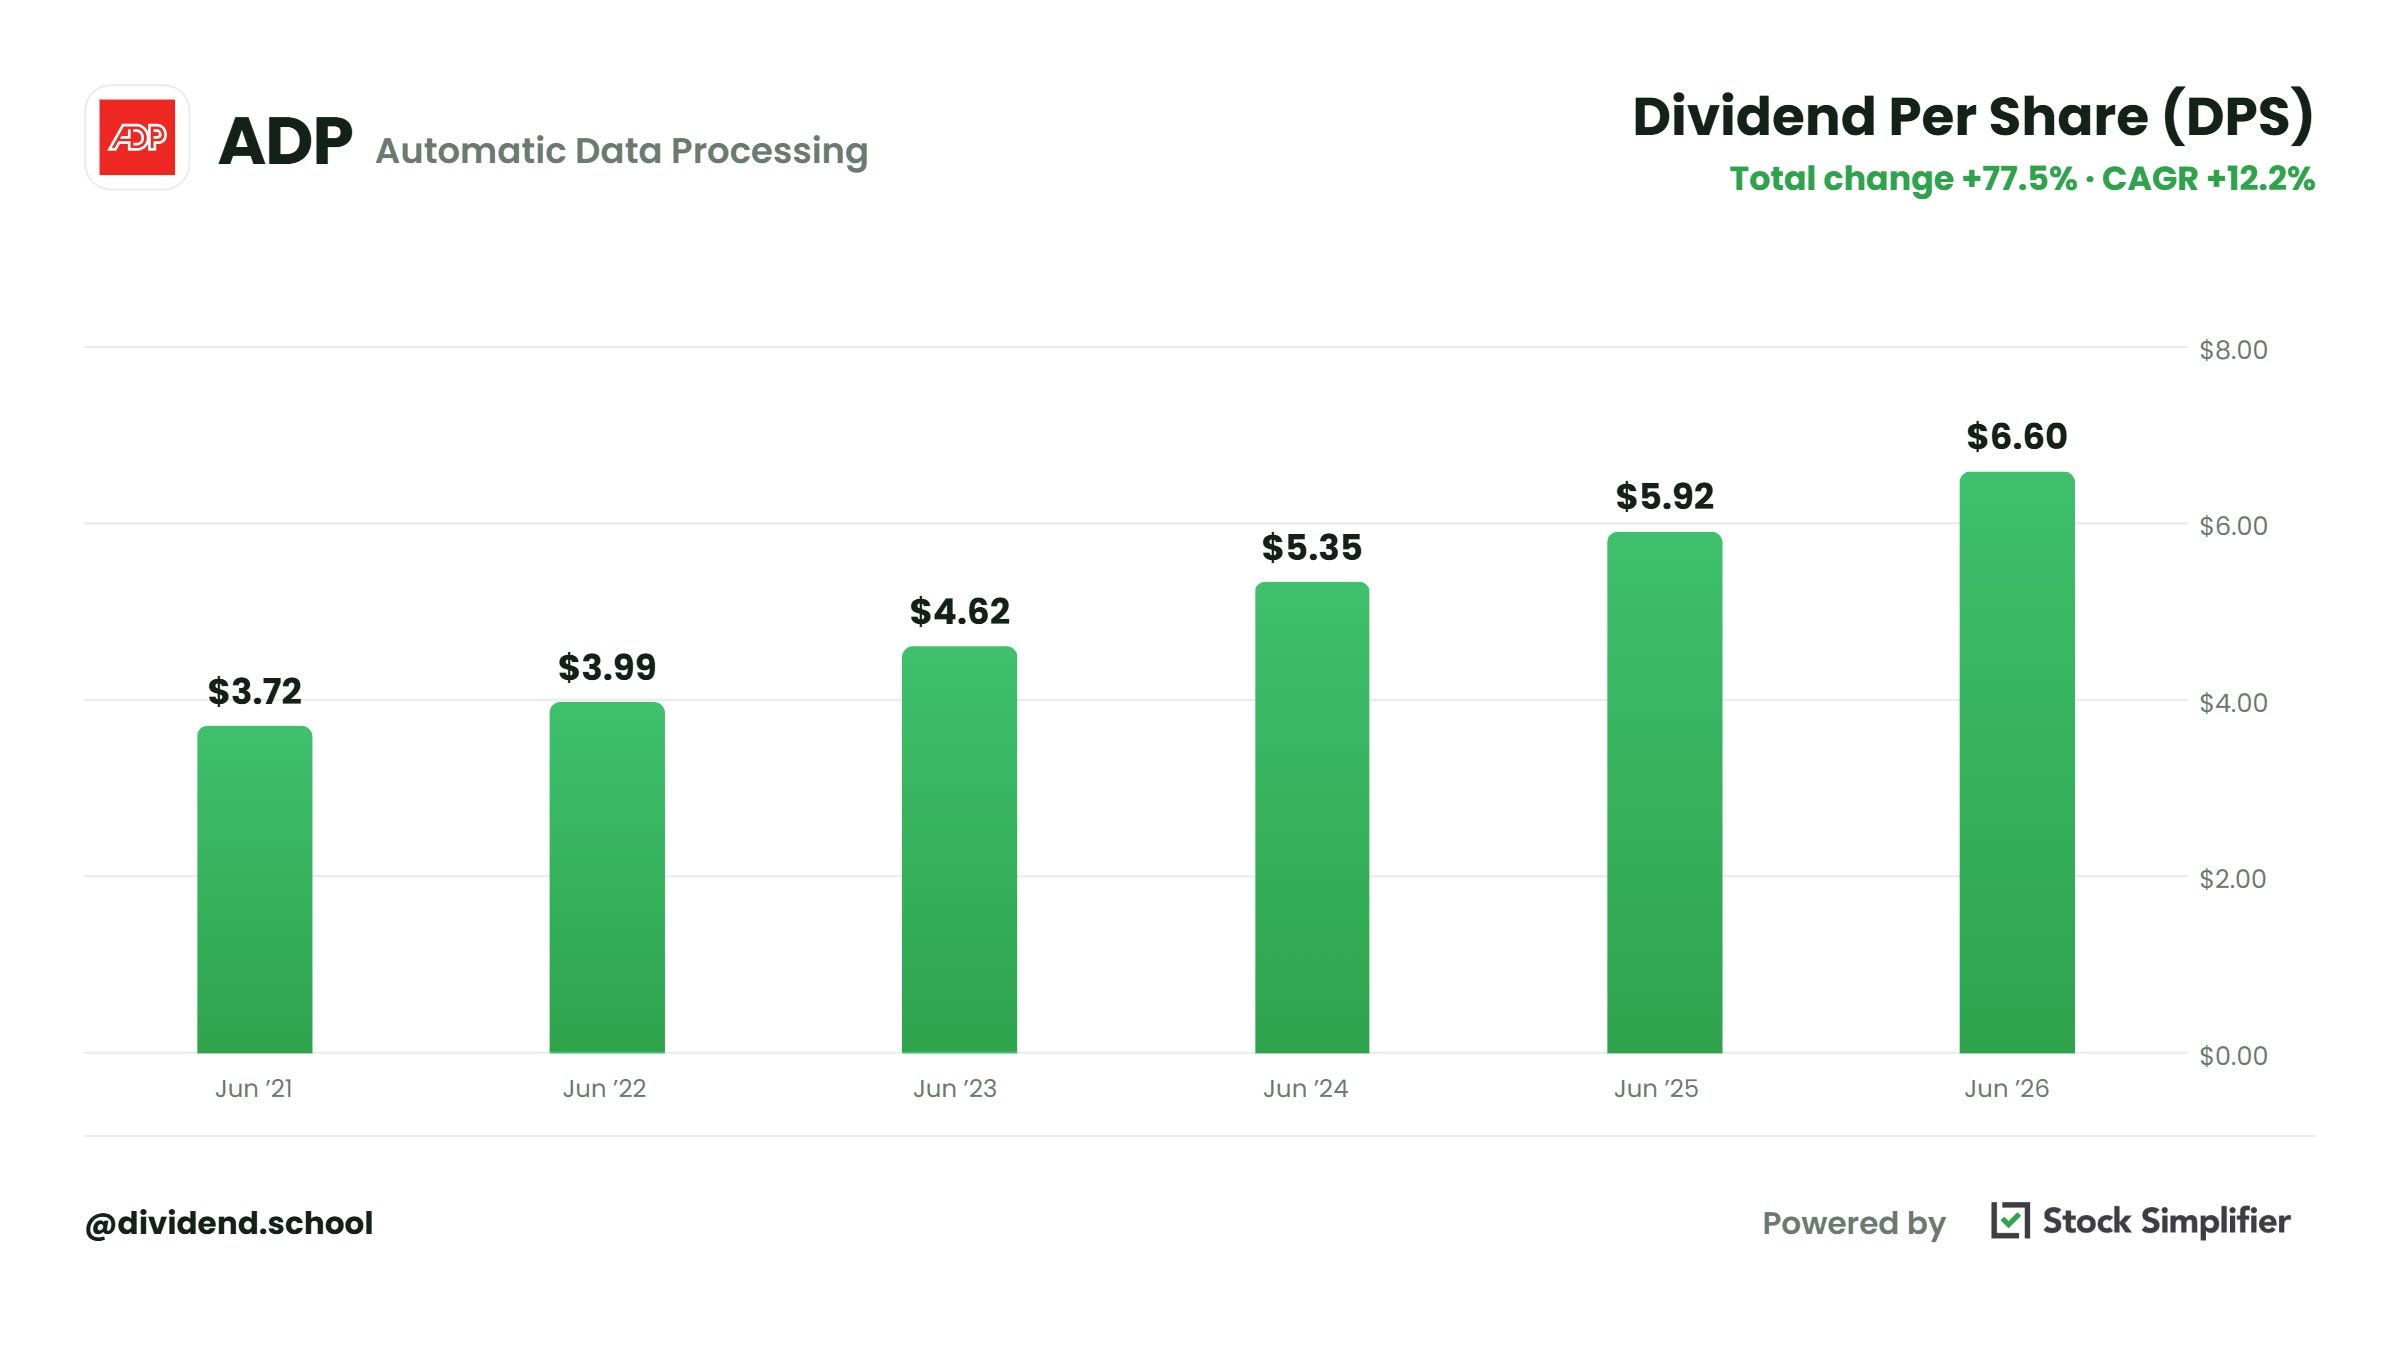
Step 2: the five-year dividend growth rate. Five years ago ADP paid $0.93 a quarter. Now it pays $1.70. We want the compound annual growth rate, the same calculation we’d use on revenue or earnings:
Five-year dividend growth: 12.82% (($1.70 / $0.93) ^ (1/5) − 1)
If exponents make your eyes glaze over, any CAGR calculator online does this in two seconds. Plug in $0.93 as the start, $1.70 as the end, and five years.
Alternatively, you can use your favorite financial website, such as Stock Simplifier.
Step 3: add them.
Chowder number: 15.37 (2.55 + 12.82)
That’s it. Two numbers from the IR page, one piece of math, and we have a first read on whether ADP is growing its payout fast enough to be worth our time.
Is 15.37 good?
Depends on the stock, which brings us to the thresholds.
The Three Thresholds, and Where REITs Fit
The rule doesn’t use one bar for every stock. It uses three:
Yield of 3% or higher: Chowder number of at least 12
Yield under 3%: Chowder number of at least 15
Utilities: Chowder number of at least 8
The logic holds up. A stock paying us 1% today has a lot of ground to make up, so it needs faster growth to earn its spot. A stock paying 5% is already handing us most of the return in cash, so the growth bar comes down.
Utilities get their own line because they’re regulated. Regulators set what they can earn, which caps growth; in exchange, the business is steady as they go. Some versions of the rule only give a utility the 8 line when it yields at least 4%; I use it for any utility and let the rest of the analysis do the work.
So where do REITs fit?
They don’t, officially. The original rule never addressed REITs, MLPs or BDCs. All three pay out most of their cash flow by design, which leaves little left over to grow the dividend fast.
I put REITs, MLPs and BDCs on the utility line of 8, and then I lean much harder on coverage, AFFO for a REIT (the REIT version of free cash flow), distributable cash flow for an MLP, and net investment income for a BDC. The lower bar only works if the cash behind the payment holds up.
Five Dividend Universe Names Filtered Through the Rule
Let’s run five names from the Dividend School Universe. Prices as of September 23, and each line shows the yield plus the five-year growth rate:
ADP ($ADP): 2.55% + 12.82% = 15.37. Needs 15. Passes.
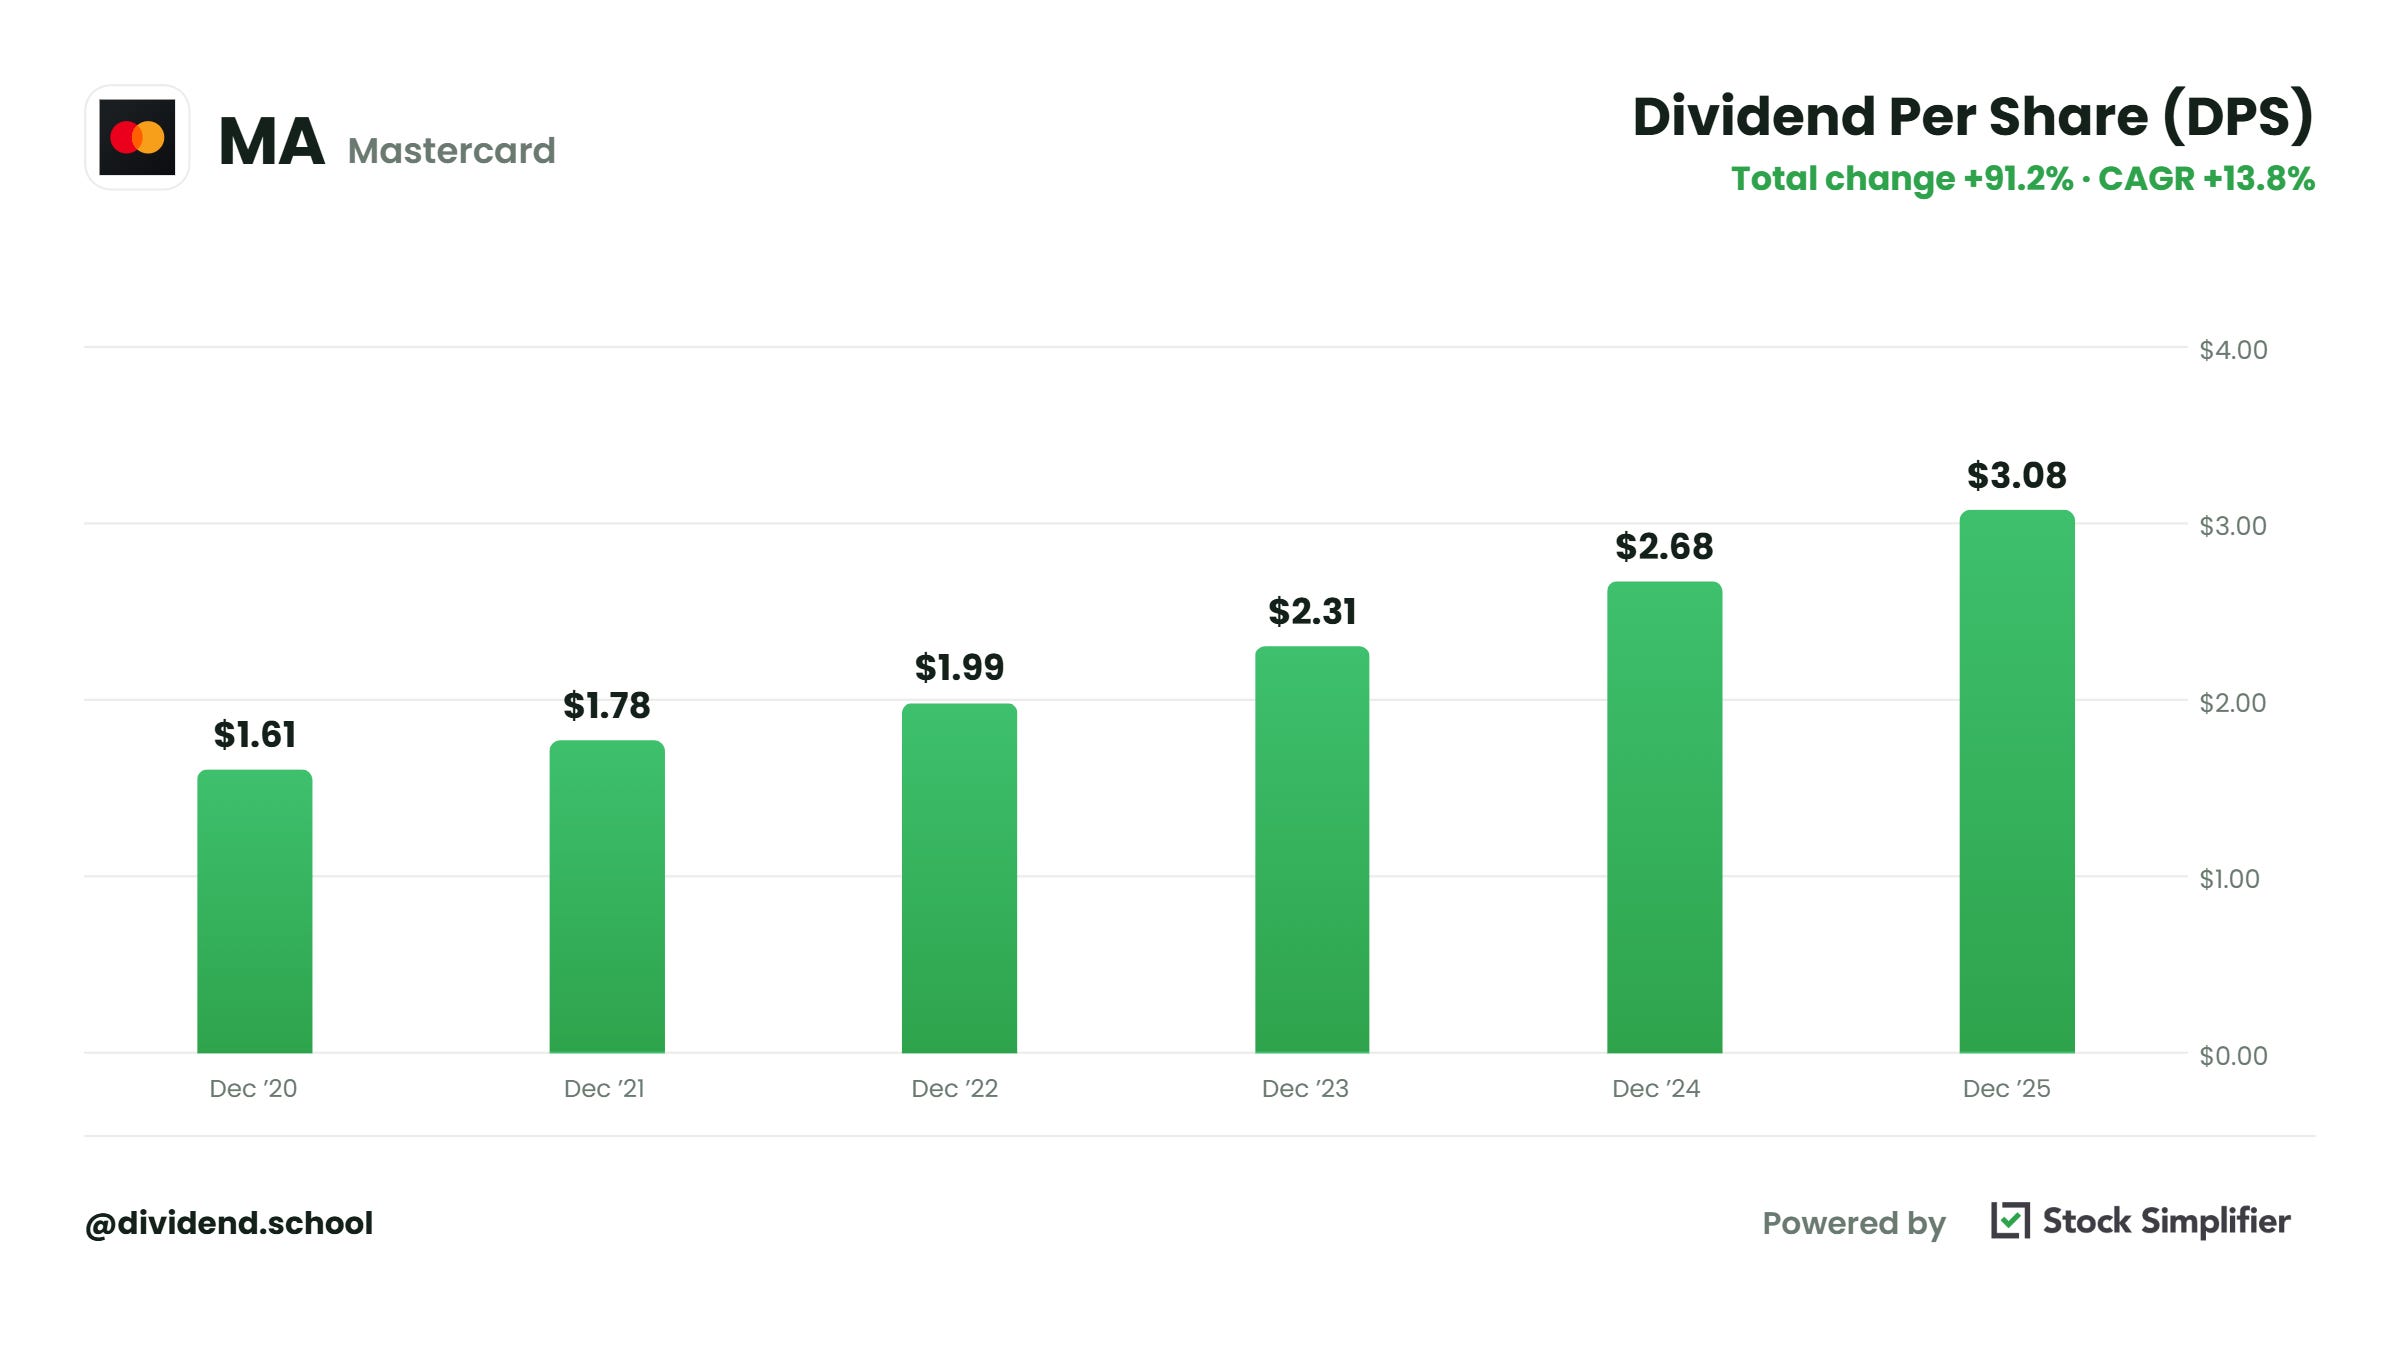
Mastercard ($MA): 0.62% + 14.61% = 15.23. Needs 15. Passes.
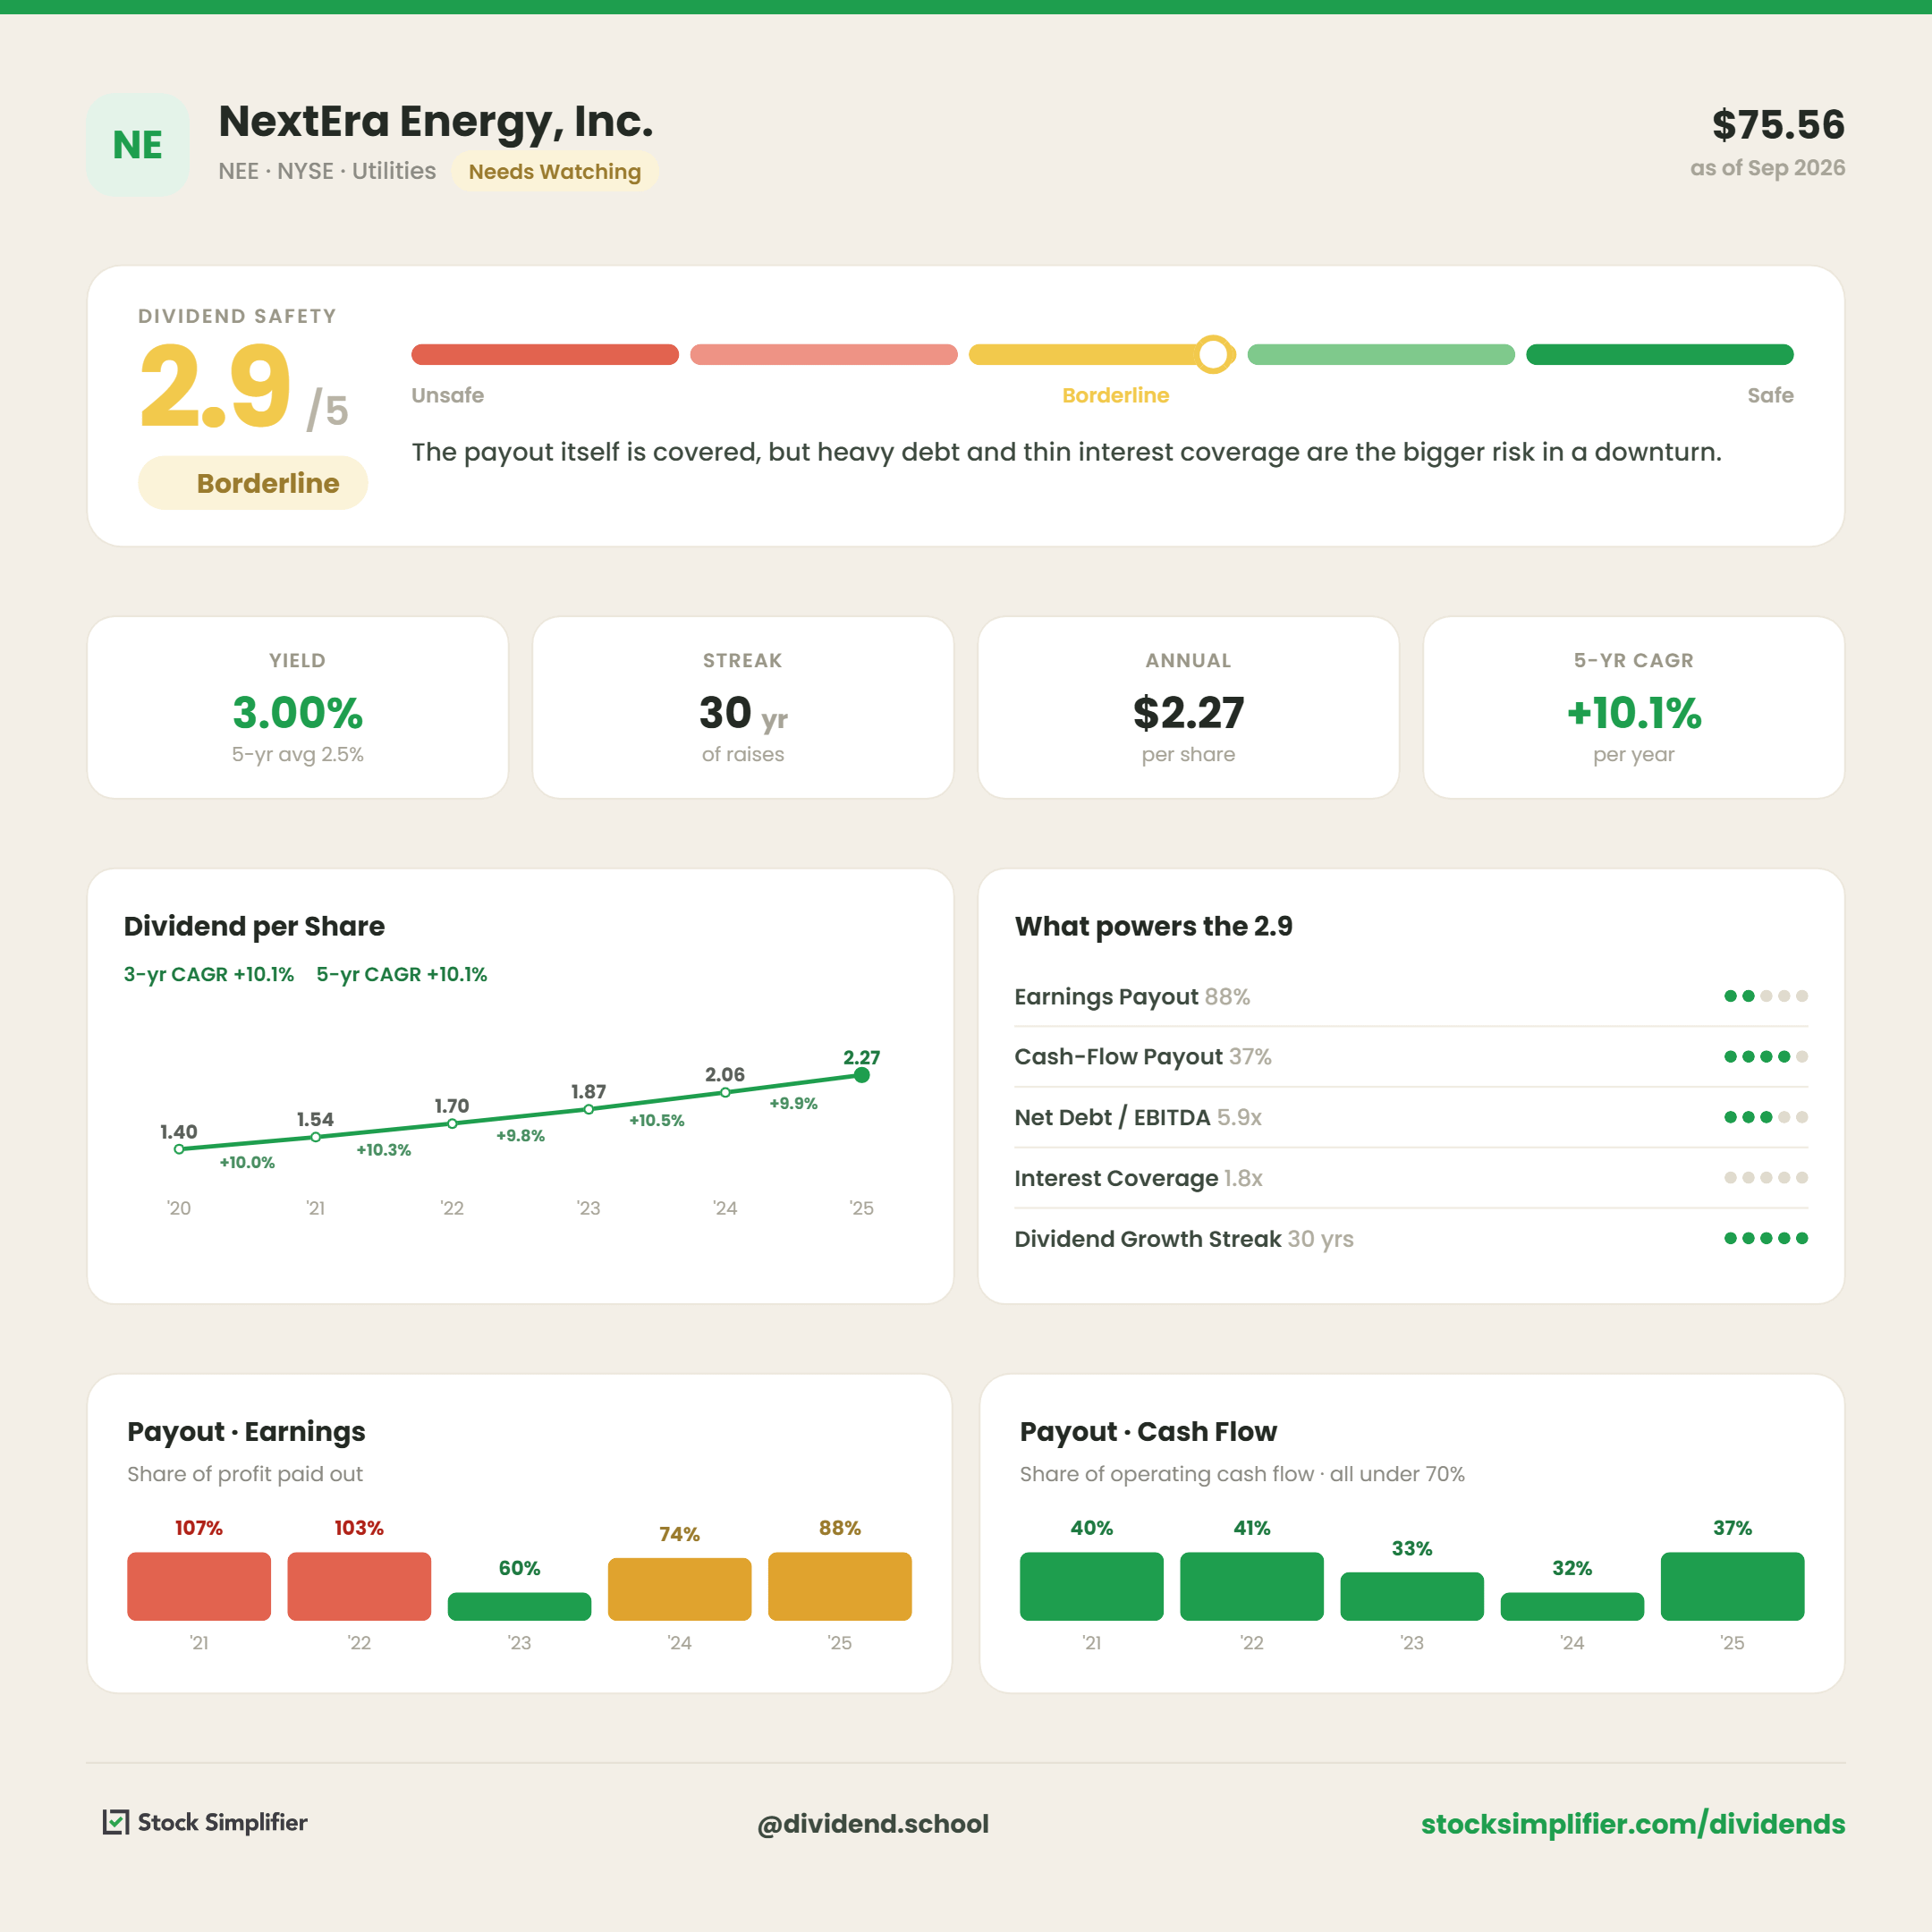
NextEra Energy ($NEE): 3.22% + 10.11% = 13.33. Utility, needs 8. Passes.
Duke Energy ($DUK): 3.79% + 1.95% = 5.74. Utility, needs 8. Fails.
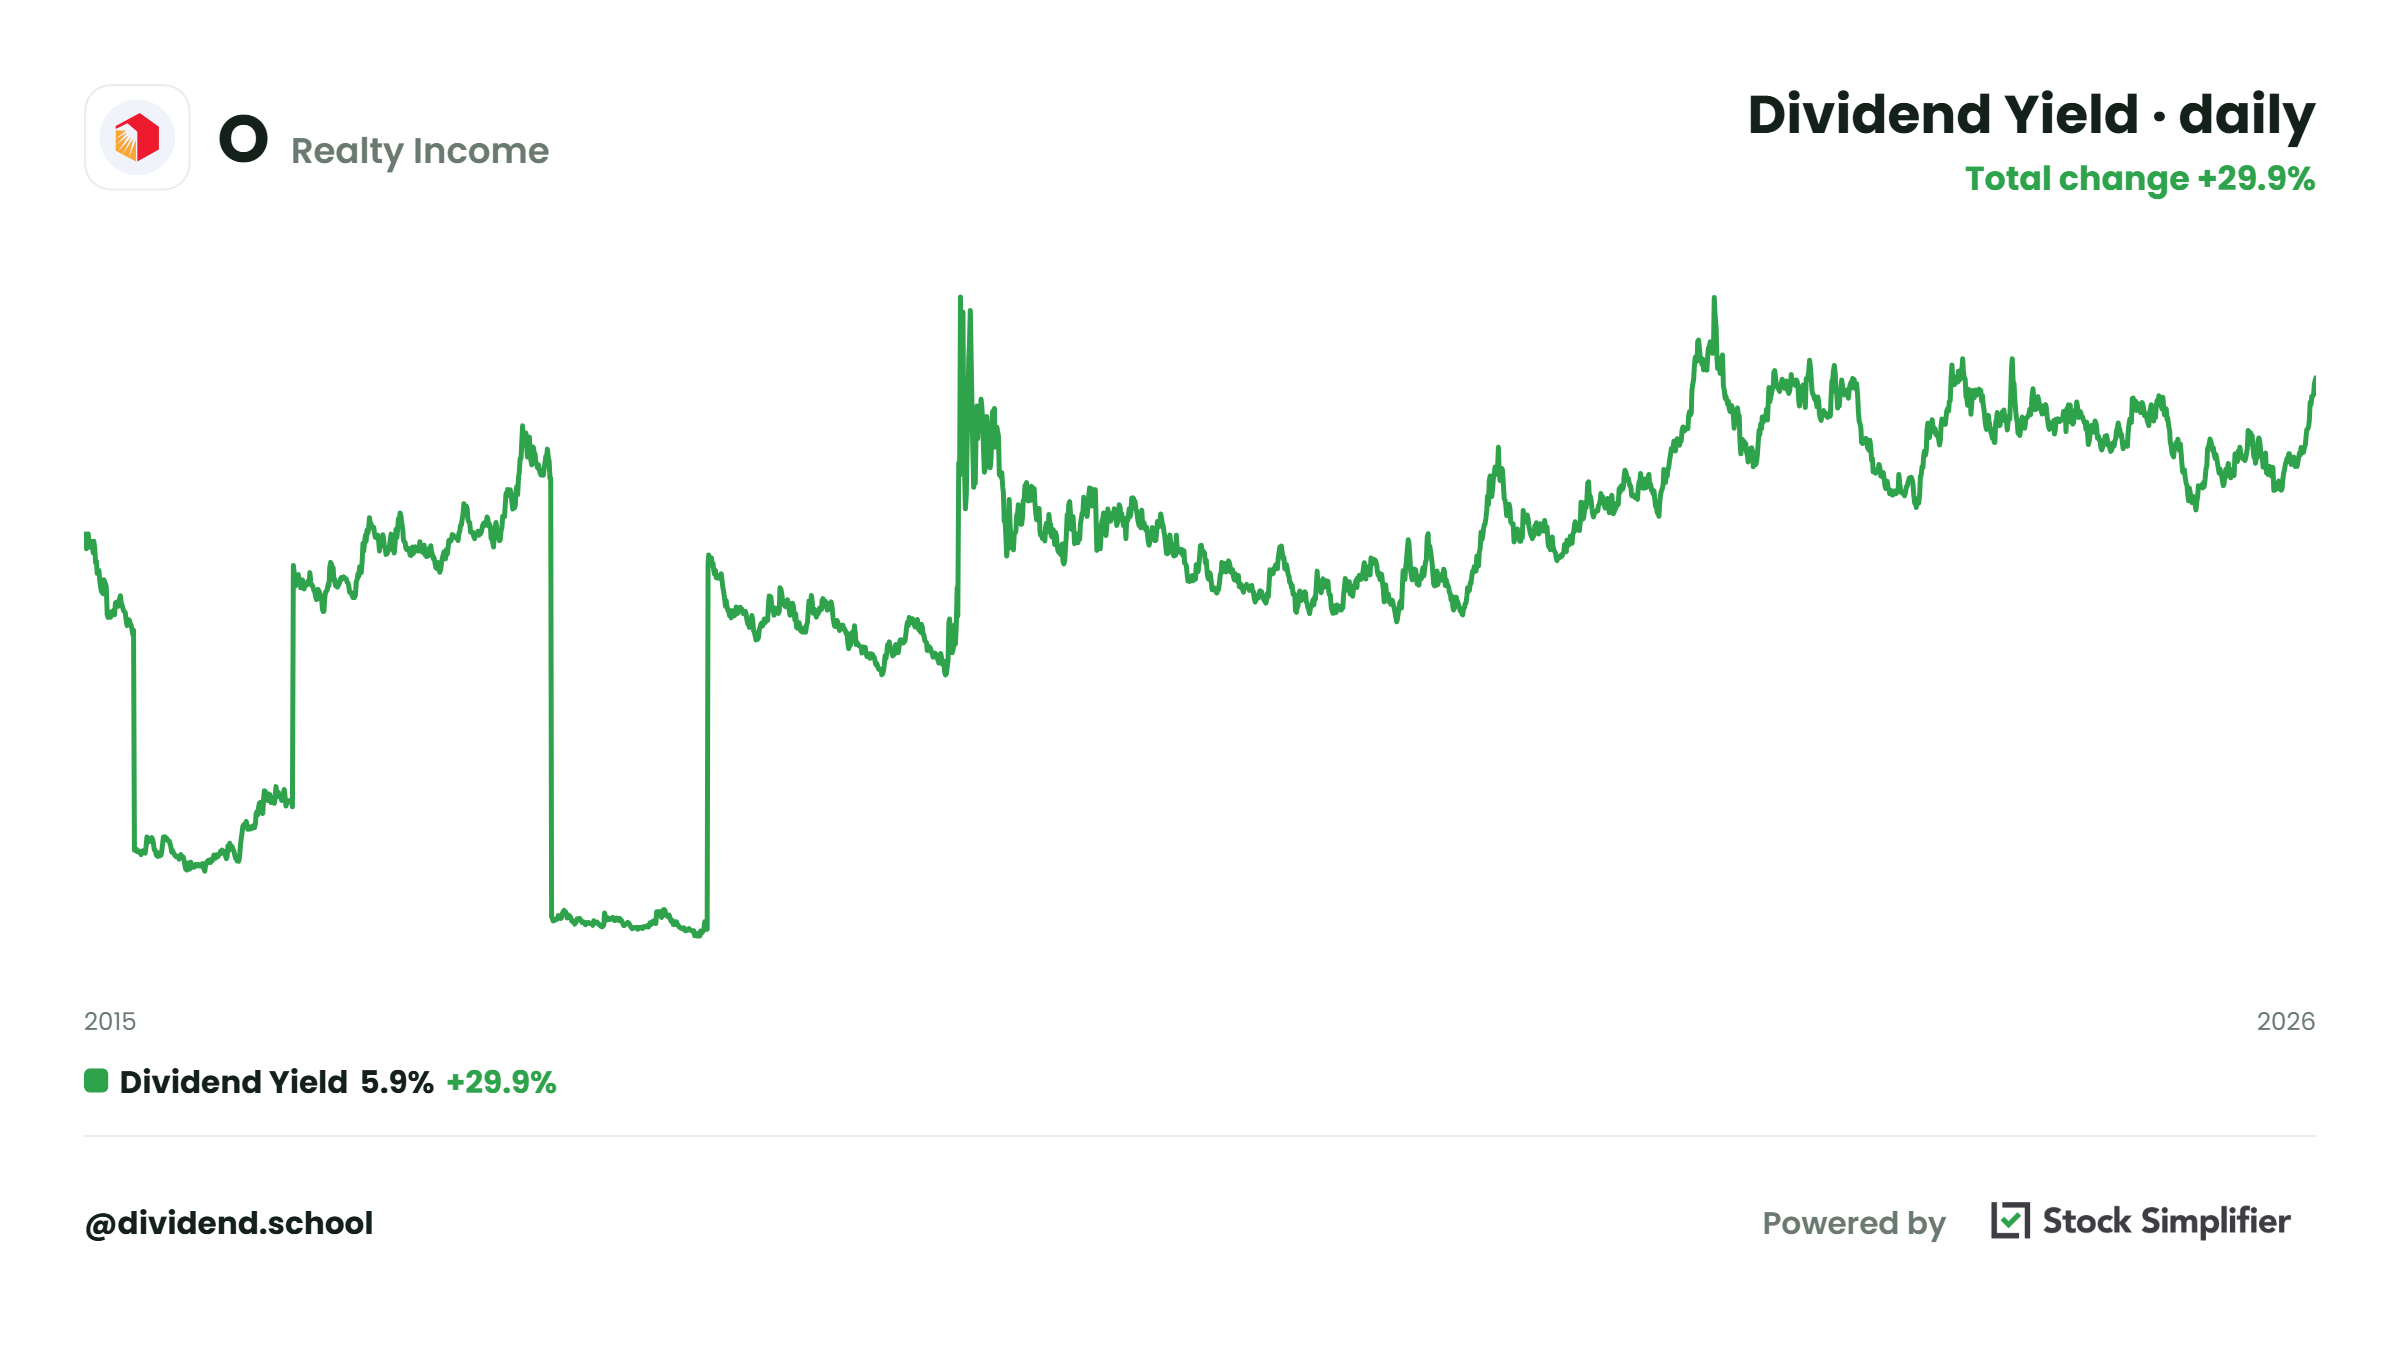
Realty Income ($O): 5.86% + 2.84% = 8.70. Fails at 12, passes on the REIT line of 8.
What does this tell us?
Mastercard clears the 15 bar on growth alone, with a 0.62% yield ($3.48 a year / $560.06). The dividend went from $0.44 a quarter to $0.87 in five years. Love the consistency.
NextEra is a utility that grows like a dividend growth stock. 10.11% a year from a regulated business is well above what the rule asks for.
Duke is the classic utility story, 2 cents a year added to the quarterly payment like clockwork. Reliable, yes, and the rule says it’s too slow. We already carry Duke as “At Risk” on the Universe table, so the Chowder number and the safety score are pointing the same direction.
Realty Income is the real-life REIT problem from the last section. Its five-year growth is 2.84% ($0.2715 monthly today against $0.236 five years ago). On the strict rule, it’s out. On the REIT line, it’s in, and the next stop is AFFO coverage.
Where the Chowder Rule Fails
Three weak spots, and we need to know all of them before trusting the number:
It can’t see coverage
It rewards a falling stock price
It looks backward
It Can’t See Coverage
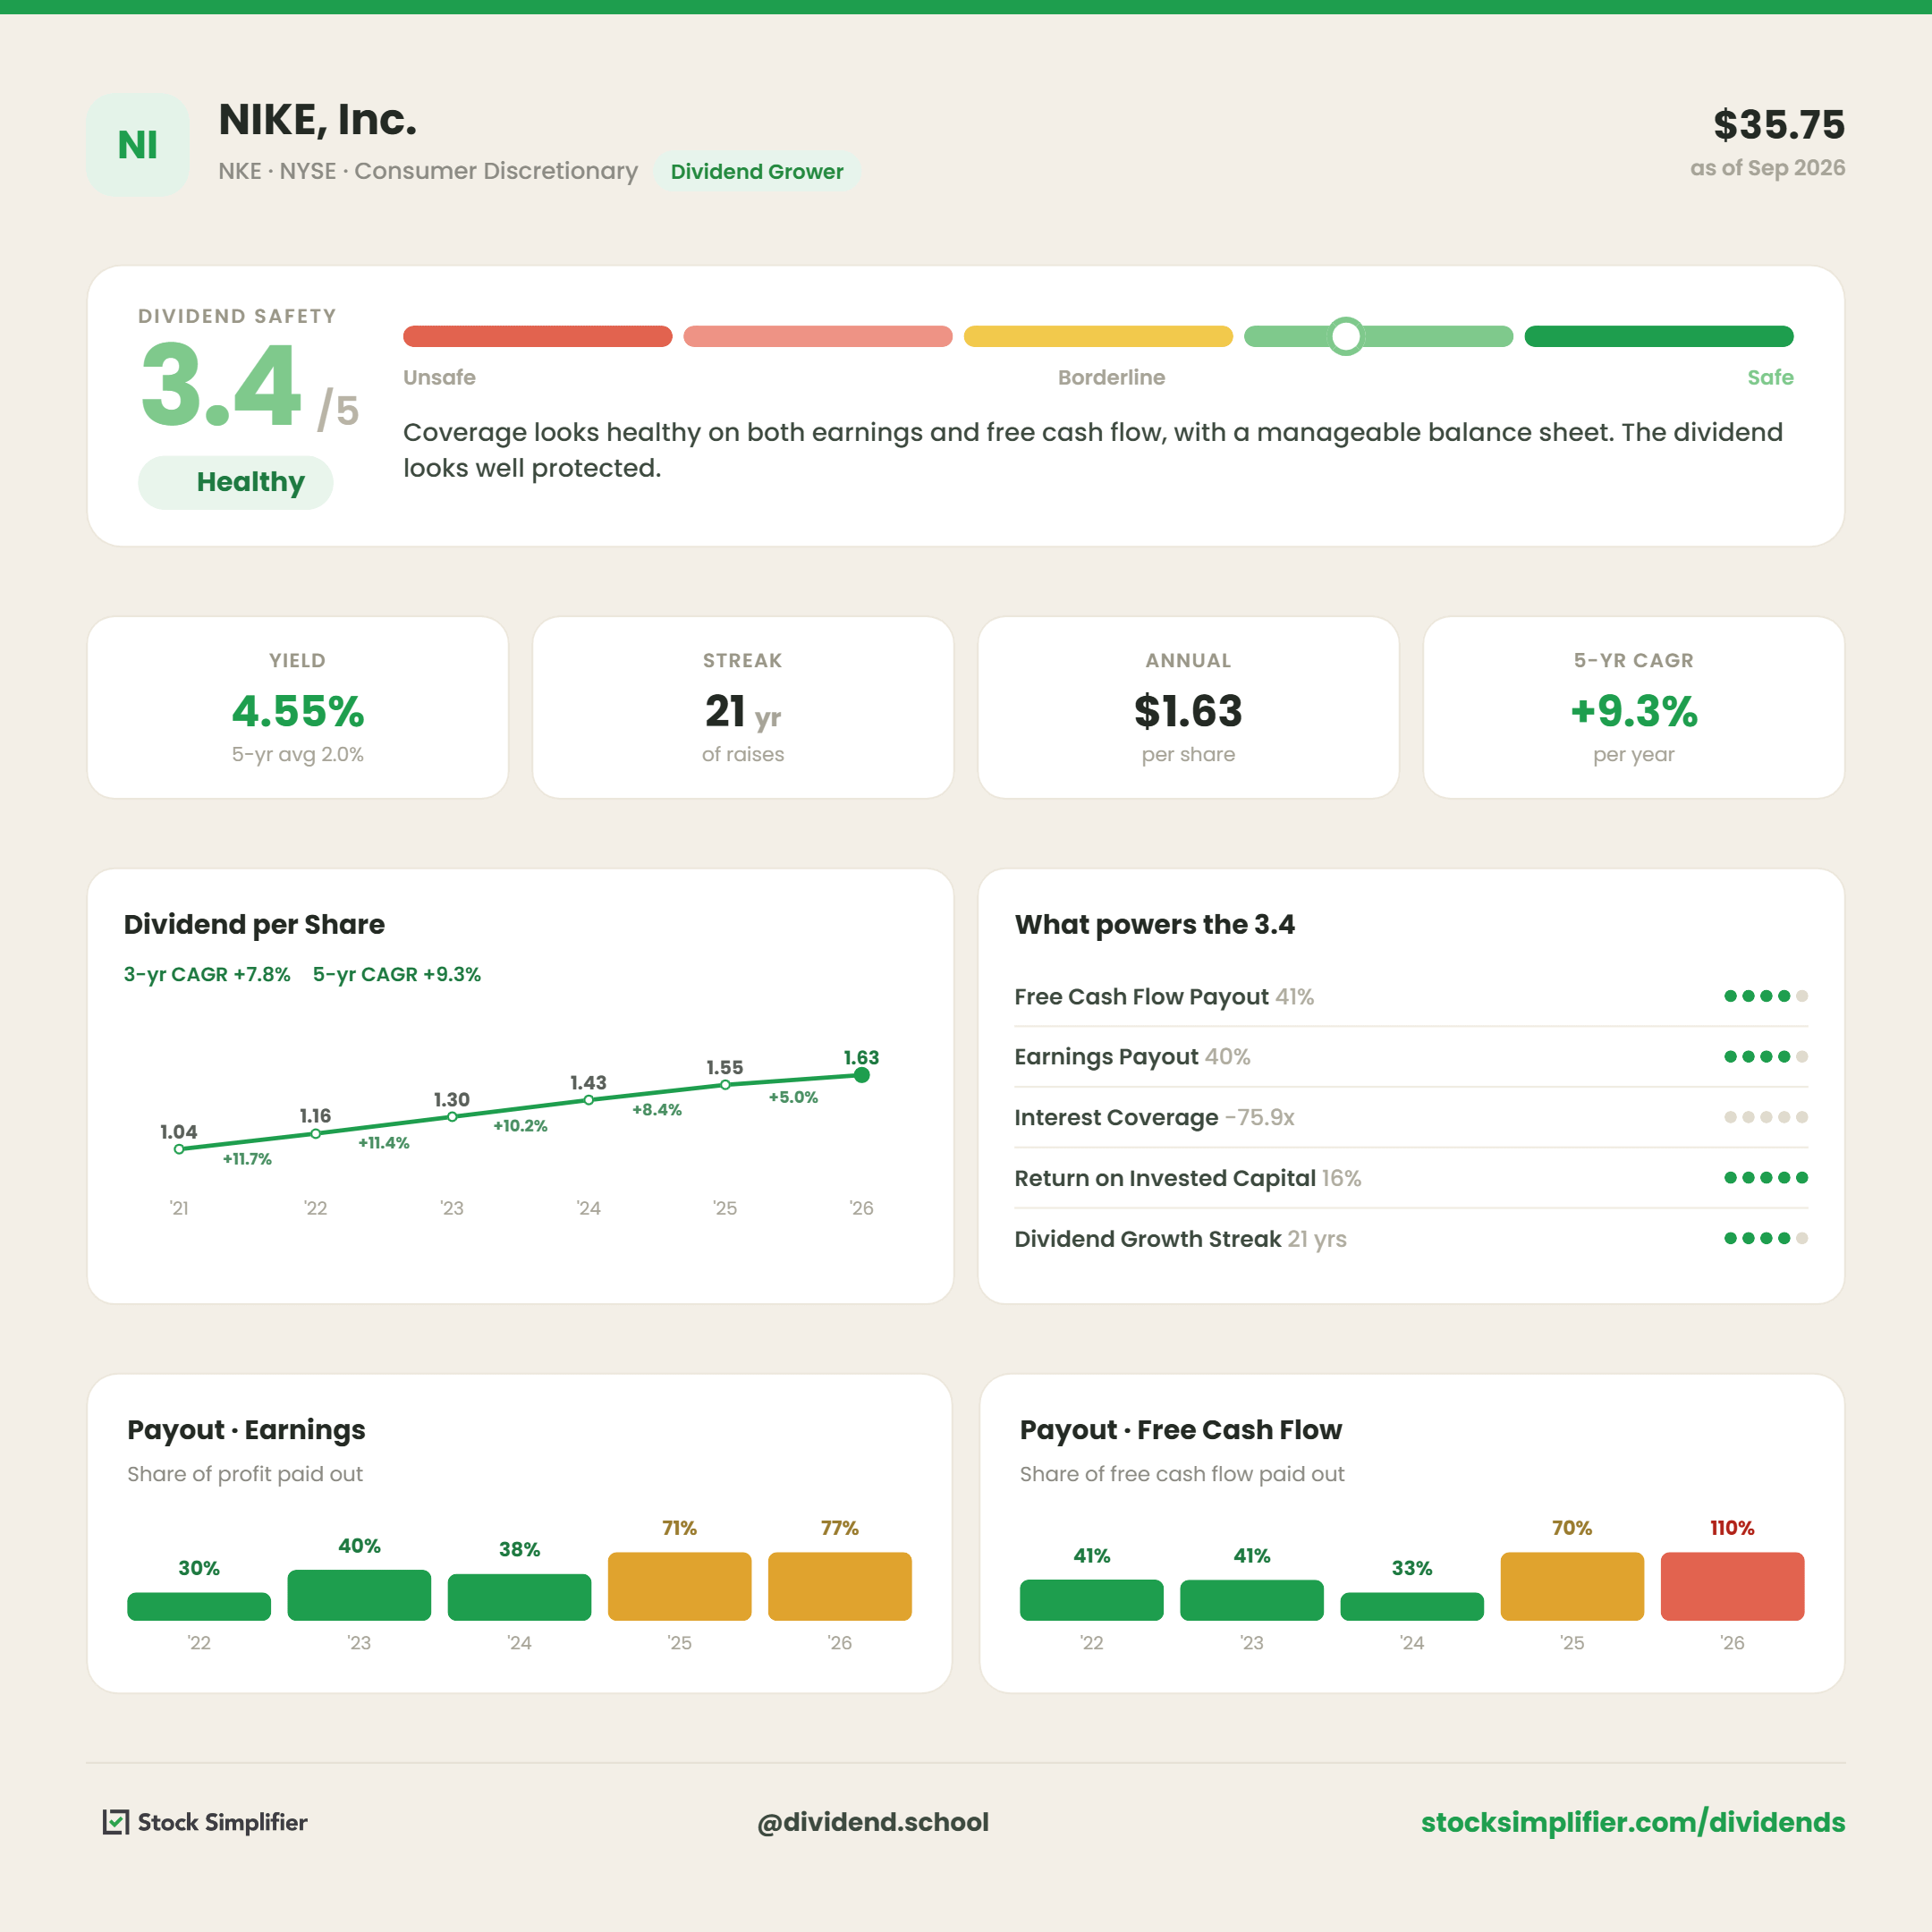
Back to Nike. It’s not in our Universe, but we ran it in the September Dirt Cheap issue, and the numbers are fresh.
Yield: 4.58% ($1.64 / $35.84)
Five-year dividend growth: 8.32% (($0.41 / $0.275) ^ (1/5) − 1)
Chowder number: 12.90. Needs 12. Passes.
Now the cash. In fiscal 2026, Nike generated $2,184M of free cash flow ($2,868M from operations minus $684M of capex) and paid $2,407M in dividends.
Coverage: 0.91x ($2,184M / $2,407M)
Nike paid out more in dividends than it generated in free cash flow, and the Chowder Rule waved it right through.
How long can a company pay out more than it generates?
As long as the balance sheet cash or the borrowing lasts, and that works for a while, until it doesn’t. Compare that to ADP, which covers its dividend 1.82x ($4,776M of free cash flow / $2,626M of dividends).
WARNING: a Chowder number never tells us whether the dividend is covered. NEVER. That takes the cash flow statement.
It Rewards a Falling Stock Price
How did Nike pass in the first place?
Partly through the price. The stock sits near its 52-week low, and as the price falls, the yield goes up, and the Chowder number goes up with it.
At its 52-week high of $76.97, the same $1.64 dividend yields 2.13% ($1.64 / $76.97). Add the same 8.32% growth and the Chowder number is 10.45, well short of the 15 a sub-3% yielder needs.
Same company, same dividend, and the price alone decides whether it passes. A stock getting cheaper for a good reason looks better on the rule, which is the opposite of what we want in a screen for yield traps.
It Looks Backward
Nike’s raises over the last six years went 12%, 11%, 11%, 9%, 8%, and then 3% last November. The five-year average still says 8.32%. The most recent raise says the board is slowing down.
The same thing works in reverse. A company that freezes its dividend for a couple of years to pay down debt after an acquisition drags its five-year growth rate down for years afterward, and it can keep failing the rule long after the business comes out the other side stronger.
Put the most recent raise next to the five-year rate every time. If the latest raise sits well below the average, the Chowder number overstates growth.
Bottom line: you need to understand the business model and look deeply at the financials to understand trends, not just static numbers. A high ROIC or dividend yield in one year tells little about the quality of the business.
How to Use It in Your Process
I treat the Chowder Rule as a first screen, never a verdict. It sorts a long list into “look closer” and “not now,” and it does that job well. Everything after that takes the filings.
Here’s the order I run it in:
Start with businesses we’d want to own anyway. Chowder’s own advice, and layer one of the 4-Layer Filter. The rule says nothing about quality.
Run the Chowder number against the right threshold: 12, 15, or 8 for utilities, REITs, MLPs, and BDCs.
Check the latest raise against the five-year rate. A big gap means the growth is fading.
Check coverage. Free cash flow over dividends paid, or AFFO for a REIT. Under 1.2x and the dividend depends on things going right. That’s step one of “Don’t Chase High Yields”.
Then the price. A stock that passes everything above still needs to trade below what it’s worth.
What about a stock that misses?
It gets a second look before it gets tossed. Realty Income misses the strict 12 by 3.30 points, and I’d still rather know why before I throw out a REIT with 136 increases on the board. Frankly, the misses teach me more than the easy passes.
A pass on a high yield gets the most suspicion. That’s where the traps hide, because a falling price inflates the yield and the Chowder number right along with it.
One more habit. Rerun the number once a year, after the raise. Five minutes per stock, and it catches a slowing dividend long before the headlines do.
Final Thoughts
The Chowder Rule answers one question well: is this company paying and growing its dividend fast enough to be worth a closer look? It can’t answer whether the dividend is safe or whether the stock is cheap, and Nike shows what happens when we ask it to.
Use it to narrow the list. Then open the cash flow statement.
Nike passed the Chowder Rule and failed the cash test. We found that by pulling three years of Nike’s cash flow statements for the September Dirt Cheap issue.
That second step is what Dividend School Pro does, two paid issues a week, Thursday and Saturday. Thirty-five names in the Universe, each with a safety score and a Buy Below, and the filings open every time.
If you’d rather run the coverage check yourself, everything you need is in this article.
If you have any questions or would like me to cover something in particular, please don’t hesitate to reach out.
Until next time, take care and be safe out there,
Dave