

A 6.9% yield sounds too good to be true or a gift, while a 1.5% yield sounds like a waste of time.
Both thoughts can cost you money, because yield tells us about profits. It tells us nothing about the price or whether it makes sense.
In today’s article, we will cover:
Why yield is not a good measure of value
Price to Free Cash Flow as Tool One
The Reverse DCF as Tool Two
The Dividend Discount Model as Tool Three
First, a quick word: this whole lesson is free, and so is the newsletter. Subscribe, and you'll get a walkthrough like this every week, with real numbers pulled straight from the filings.
Okay, let’s dive in and learn how to value dividend stocks.
Why Yield is Not a Good Measure of Value
Valuation answers one simple question. How much cash do we receive for every dollar we spend today, and how much will we get in the future? A bird in the hand is worth more than two in the bush.
Yield only answers the first year of that question, not the future. Two scenarios- a 6.9% yielding company that never grows the dividend and one that yields 1.5% but raises its dividend by 14% are two completely different questions.
We need tools that account for the:
Price
Cash behind the dividend
Growth of dividend
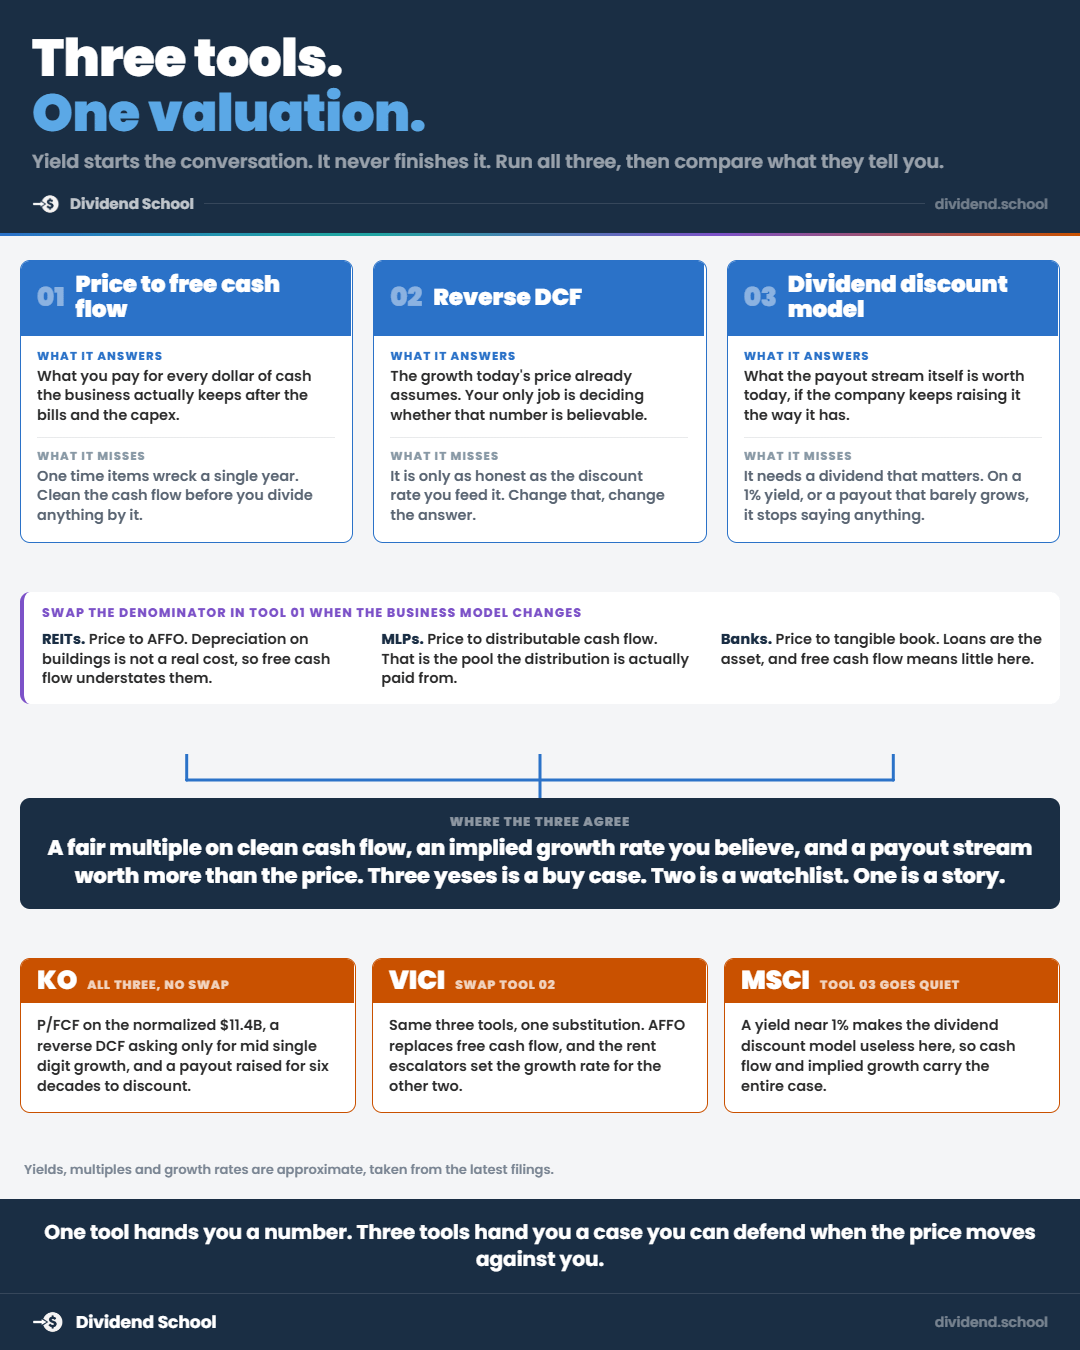
Luckily, we have three tools we can use to cover almost all dividend payers. We can use price-to-free cash flow as a quick screener. The reverse DCF as a growth-story checker and the dividend discount model for stability.
Of course, we will always have exceptions. For example, for REITs, using P/FCF is a waste of time. Instead, I would substitute something like AFFO (adjusted funds from operations) for both the relative metric and the reverse DCF. And for MLPs, you’d want to substitute distributable earnings for free cash flow.
For each business model, you can alter or substitute its representative metric to help you find its fair value. The trick is knowing which metric and how to apply it.
Always treat these tools as methods to find the fair value, not as the end-all, be-all.
Lastly, I like to use all three as a form of sanity check to ensure I am not drinking the so-called Kool-Aid.
Tool #1: Price to Free Cash Flow
Free cash flow is the cash left over after a company pays its bills and reinvests in the business. Take cash from operations and subtract capital expenditures; simple. That leftover money funds the dividend, along with other reinvestments. As dividend investors, it is the number we should check first.
Price to free cash flow compares the company’s price tag to that leftover cash:
P/FCF = market cap ÷ free cash flow
Let’s look at Coca-Cola ($KO) as our guinea pig, because it teaches a good second lesson at the same time. The raw numbers from Coca-Cola’s 2025 10-K look scary at first blush:
Operating cash flow: $7.4 billion
Capital expenditures: $2.1 billion
Free cash flow: $5.3 billion
If we do the math, Coca-Cola a $372 billion market cap is producing $5.3 billion in free cash flow. That translates to a 70x free cash flow ($372 / $5.3 = 71.5x). That seems off, and after digging into the cash flow statement, we can discover why.
This is the second lesson.
In 2025, Coke paid a one-time $6.1 milestone payment related to its fairlife acquisition. We can find this disclosure in the Q4 release.
If we add that back to the cash flow (it’s a one-time adjustment), then the normalized free cash flow equals $11.4 billion.
Lesson: always read the cash flow statement and calculate it yourself to double-check the math and ensure there aren’t any “funny” things in there.
Digging deeper, we can see that company management’s guidance provides even more clarity. In their Q2 2026 release, they announced cash flow guidance of $12.6 billion for the full year.
Now, let’s run the metric again:
2026 guided free cash flow: $12.6 billion
Diluted shares: 4.31 billion
Free cash flow per share: $2.88
Price: $86.48 (as of this writing)
P/FCF: 30x
At 30 times free cash flow, every dollar we buy equals about 3.3 cents of cash generated. Coke’s annual dividend of $2.12 consumes around 74% of free cash flow, a comfortable level for a stable business like Coke.
The multiple alone can’t tell us whether Coke is cheap or expensive, but it can help frame the question. If you adjust the multiple, we can see a range of values:
25x: about $72
28x: about $80.50
30x: $86.48
Another good practice is to look at the range over longer periods, for example, 5-10 years. And to compare it to others in its industry.
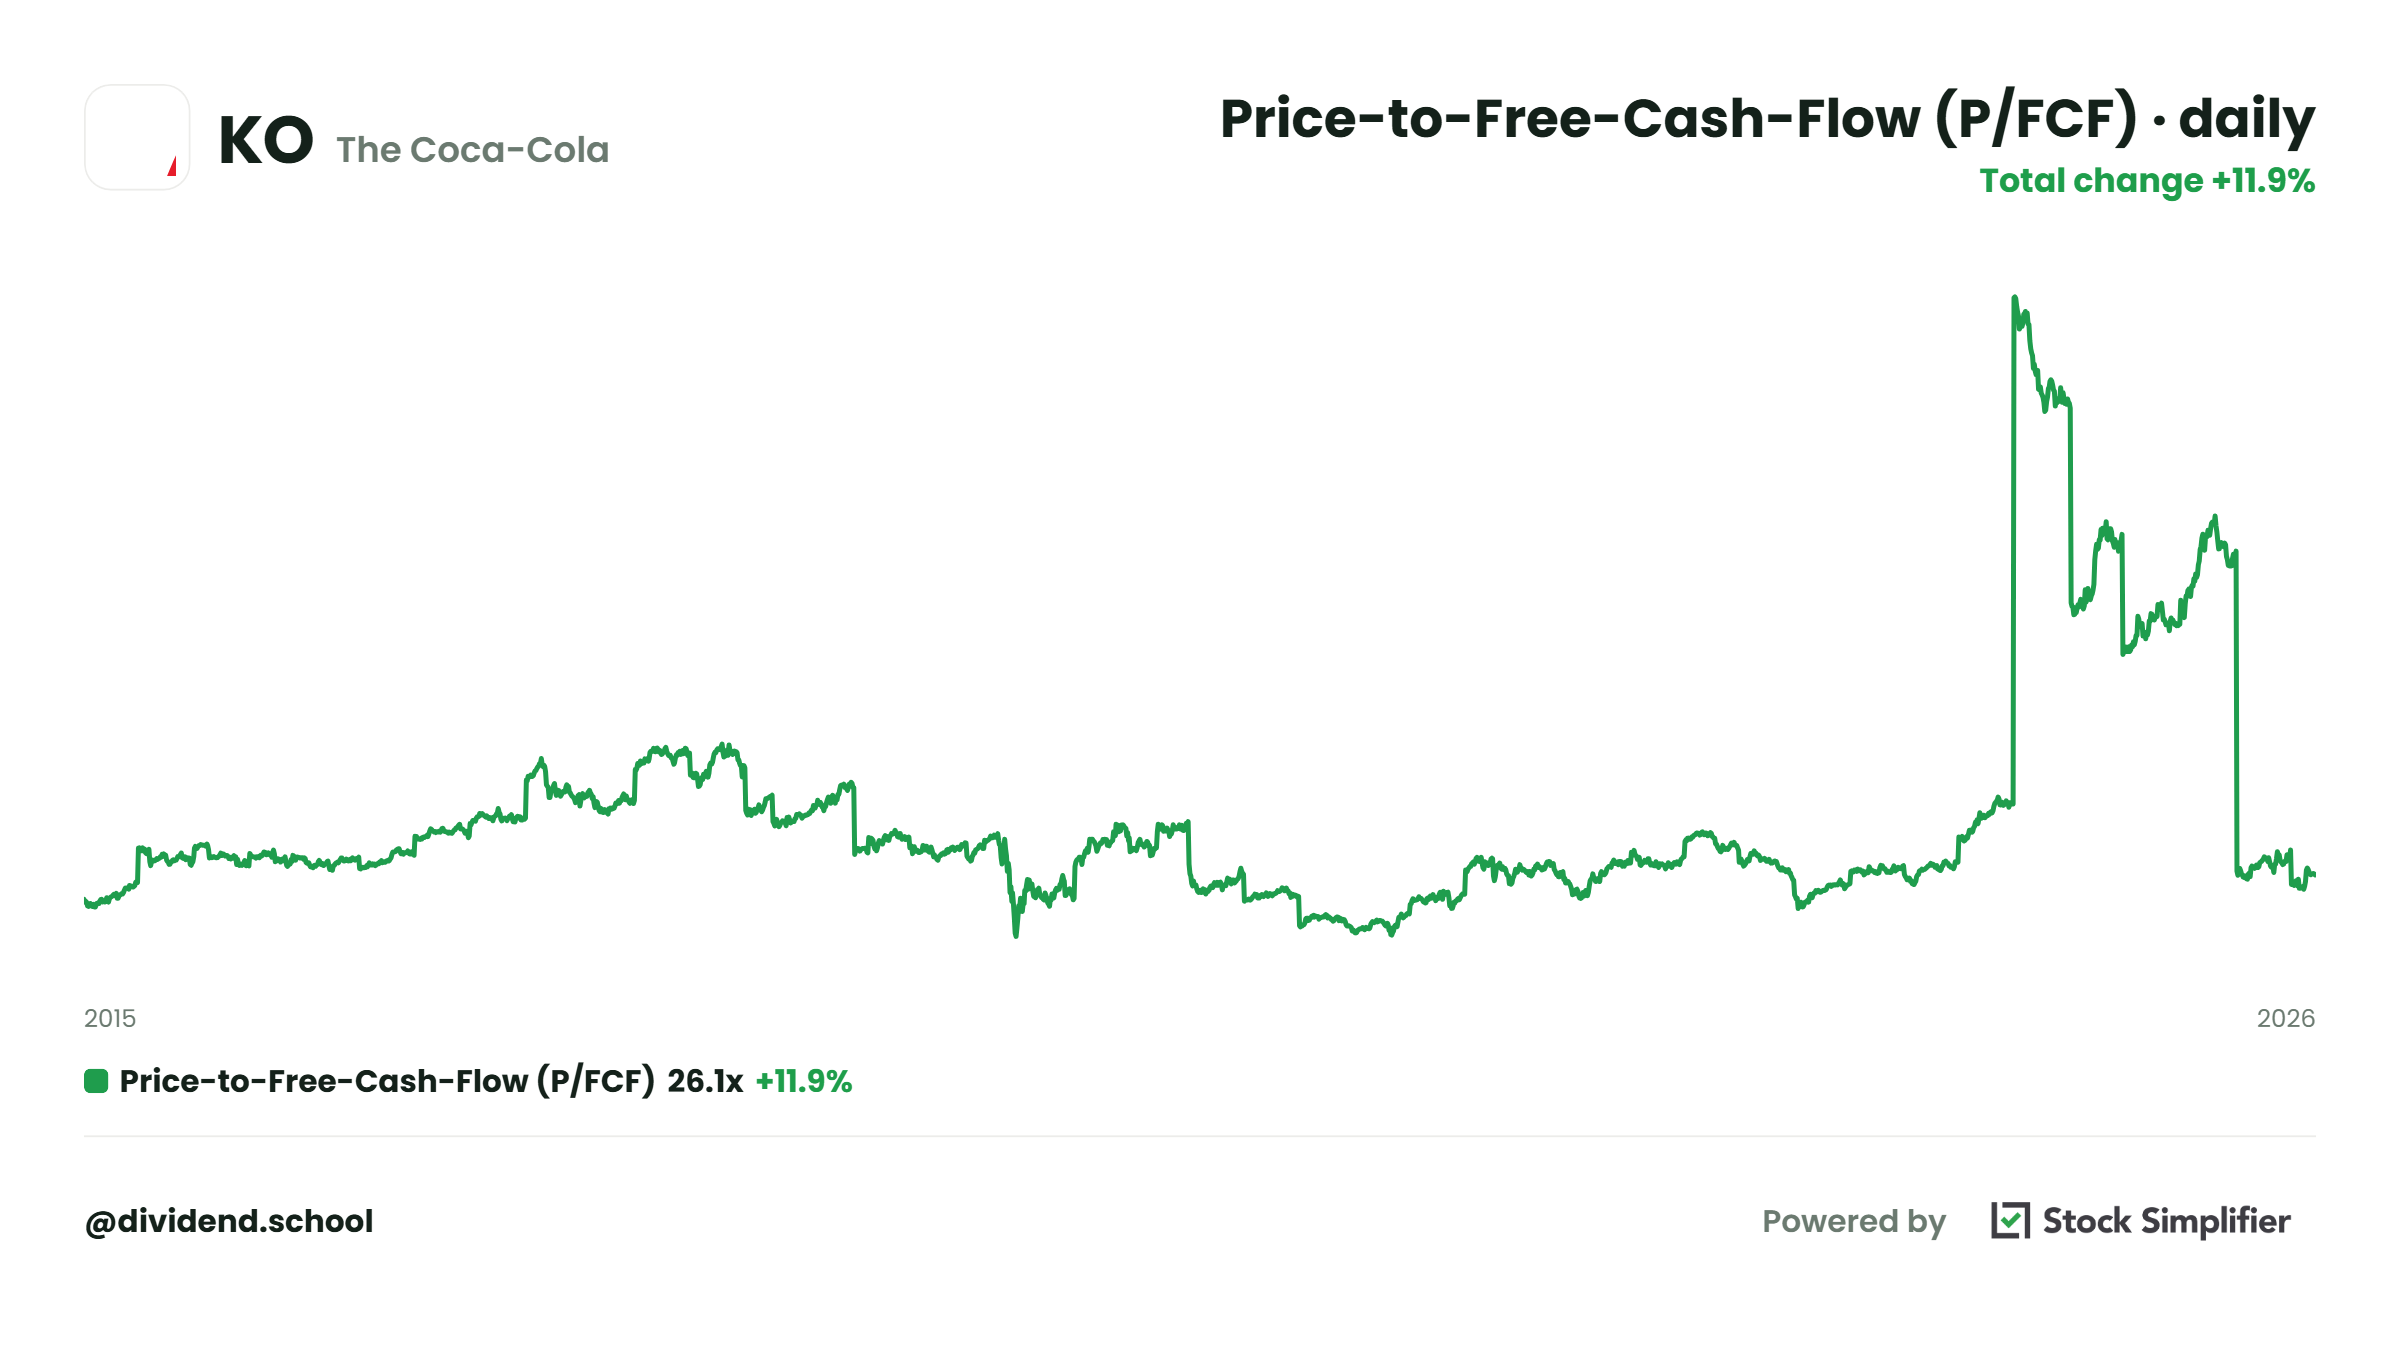
For example, Coke is trading at 30x free cash flow, with a high of 90x, a low of 18x, and a median of 28x. Pepsi is currently trading at 24.5x, and Dr Pepper is 26.4x.
What does this tell us?
That the company is trading roughly in the range of its “normal” value.
Remember, P/FCF, like any multiple, is a screen, and screens have limits. Multiples treat dividend growth the same as if the dollar of free cash flow were equal.
For REITs: Substitute AFFO for free cash flow (P/AFFO)
For MLPs: Use Distributable Cash Flow (DCF) for free cash flow (P/DCF)
For BDCs: Use Net Investment Income for free cash flow (P/NII)
Quick pause before we get there. You just cleaned up Coke's free cash flow number the same way we do it every week in Dividend School. The rest of this lesson, the reverse DCF and the dividend discount model, is free below. Subscribe, and next week's walkthrough lands in your inbox too.
Tool 2: Reverse DCF
Many investors are familiar with a discounted cash flow model, which takes free cash flow, projects it into the future, and then discounts it back to the present. The big problem with the DCF is you have to predict cash flows into the future. And I don’t know about you, but my crystal ball is quite cloudy, so future predictions remain tough.
And with every prediction, you have to ask: is this reasonable for the business?
The reverse DCF flips the script. You start with the one absolute known input, the price. And then we work backward from the price to determine what growth is the market baking into the price and at what discount rate.
Two terms we have to understand:
Discount rate: the annual return you require to compensate for the risk of owning this business. We have several ways to determine an appropriate discount rate. One is to use a set rate regardless of the company, and most people use 10% as a sensible rate. The second is to calculate the cost of capital or WACC, which is a little complicated and involves a lot of assumptions, but is more precise company to company.
Terminal rate: this is the growth rate we will assign the company beyond our projections, typically after 10 years. This is the forever growth rate assuming the company remains viable. Most investors use their economy's growth rate, and here in the US, we can use 2-4% to keep it simple. WARNING: It can never exceed the economy’s growth rate, NEVER.
We are going to use MSCI for our guinea pig for the reverse DCF. The process is the same regardless of the company. MSCI runs indexes which track trillions of dollars, collects subscription-like fees, and converts a ton of revenue into cash. It’s quite profitable to say the least.
Inputs for our reverse DCF based on Q2 2026 earnings:
2026 free cash flow guidance: $1,485 million to $1,545 million
Free cash flow per share (72.9 million diluted shares): $20.78 (midpoint)
Current price: $561.71
P/FCF: 27x
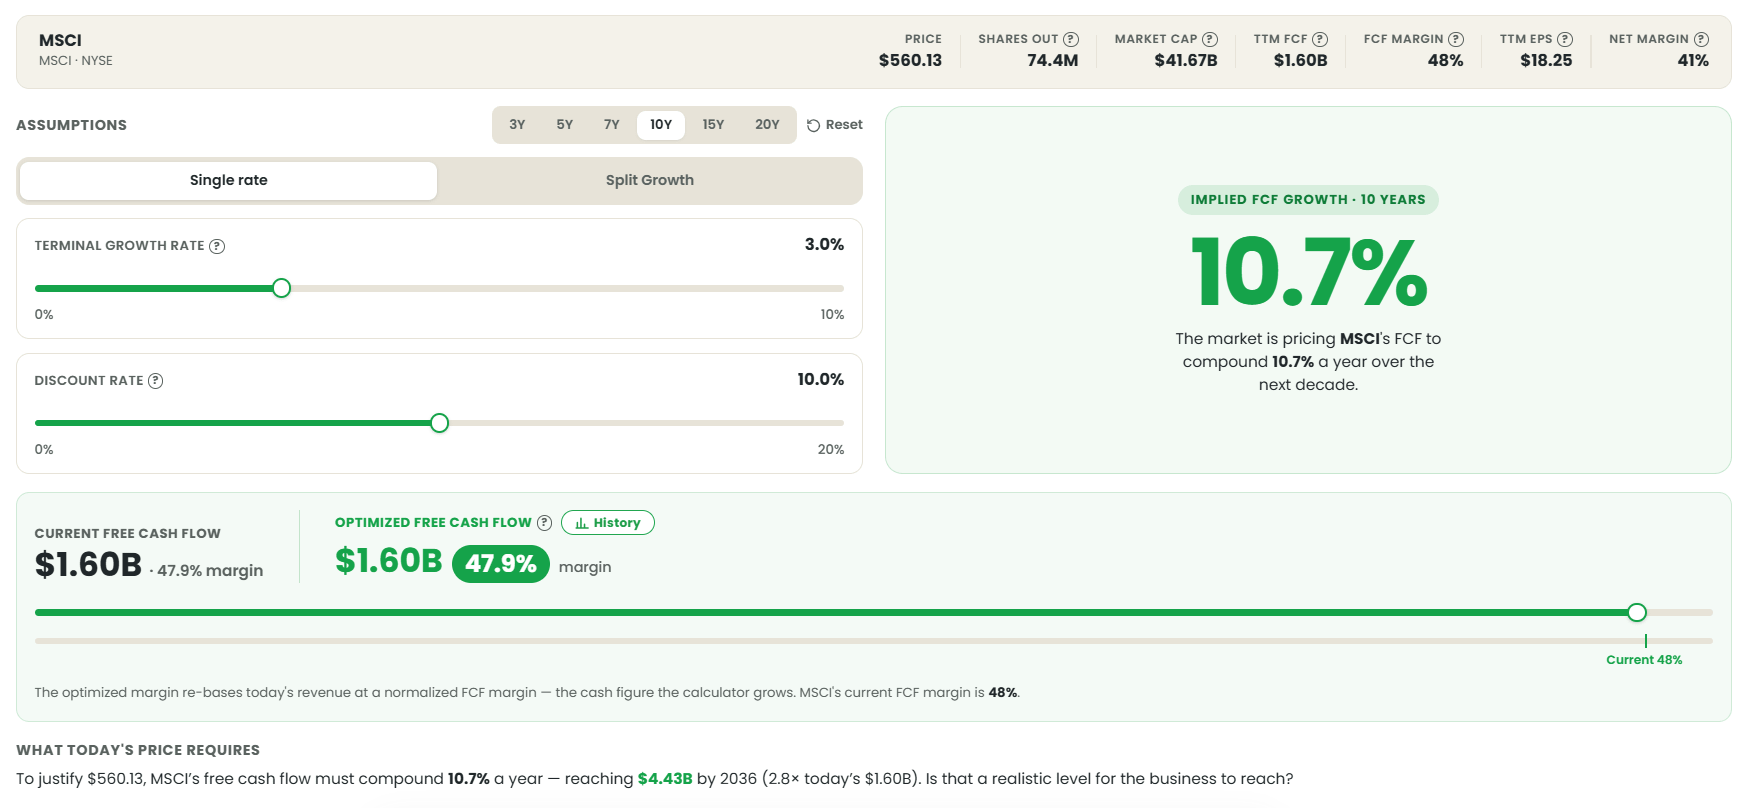
Okay, now let’s look at a reverse DCF based on the above numbers. Let’s use a 10% discount rate, a 3% terminal growth rate with a 10-year horizon.
To get to our current price of $561, the market implies MSCI must growth free cash flow per share by 11% a year for the next decade.
The big question then. Does the 11% seem believable? If check the company history we can see a good base case:
2020 free cash flow per share: $9.56
2025 free cash flow per share: $21.06
Five-year growth rate: 17.1%
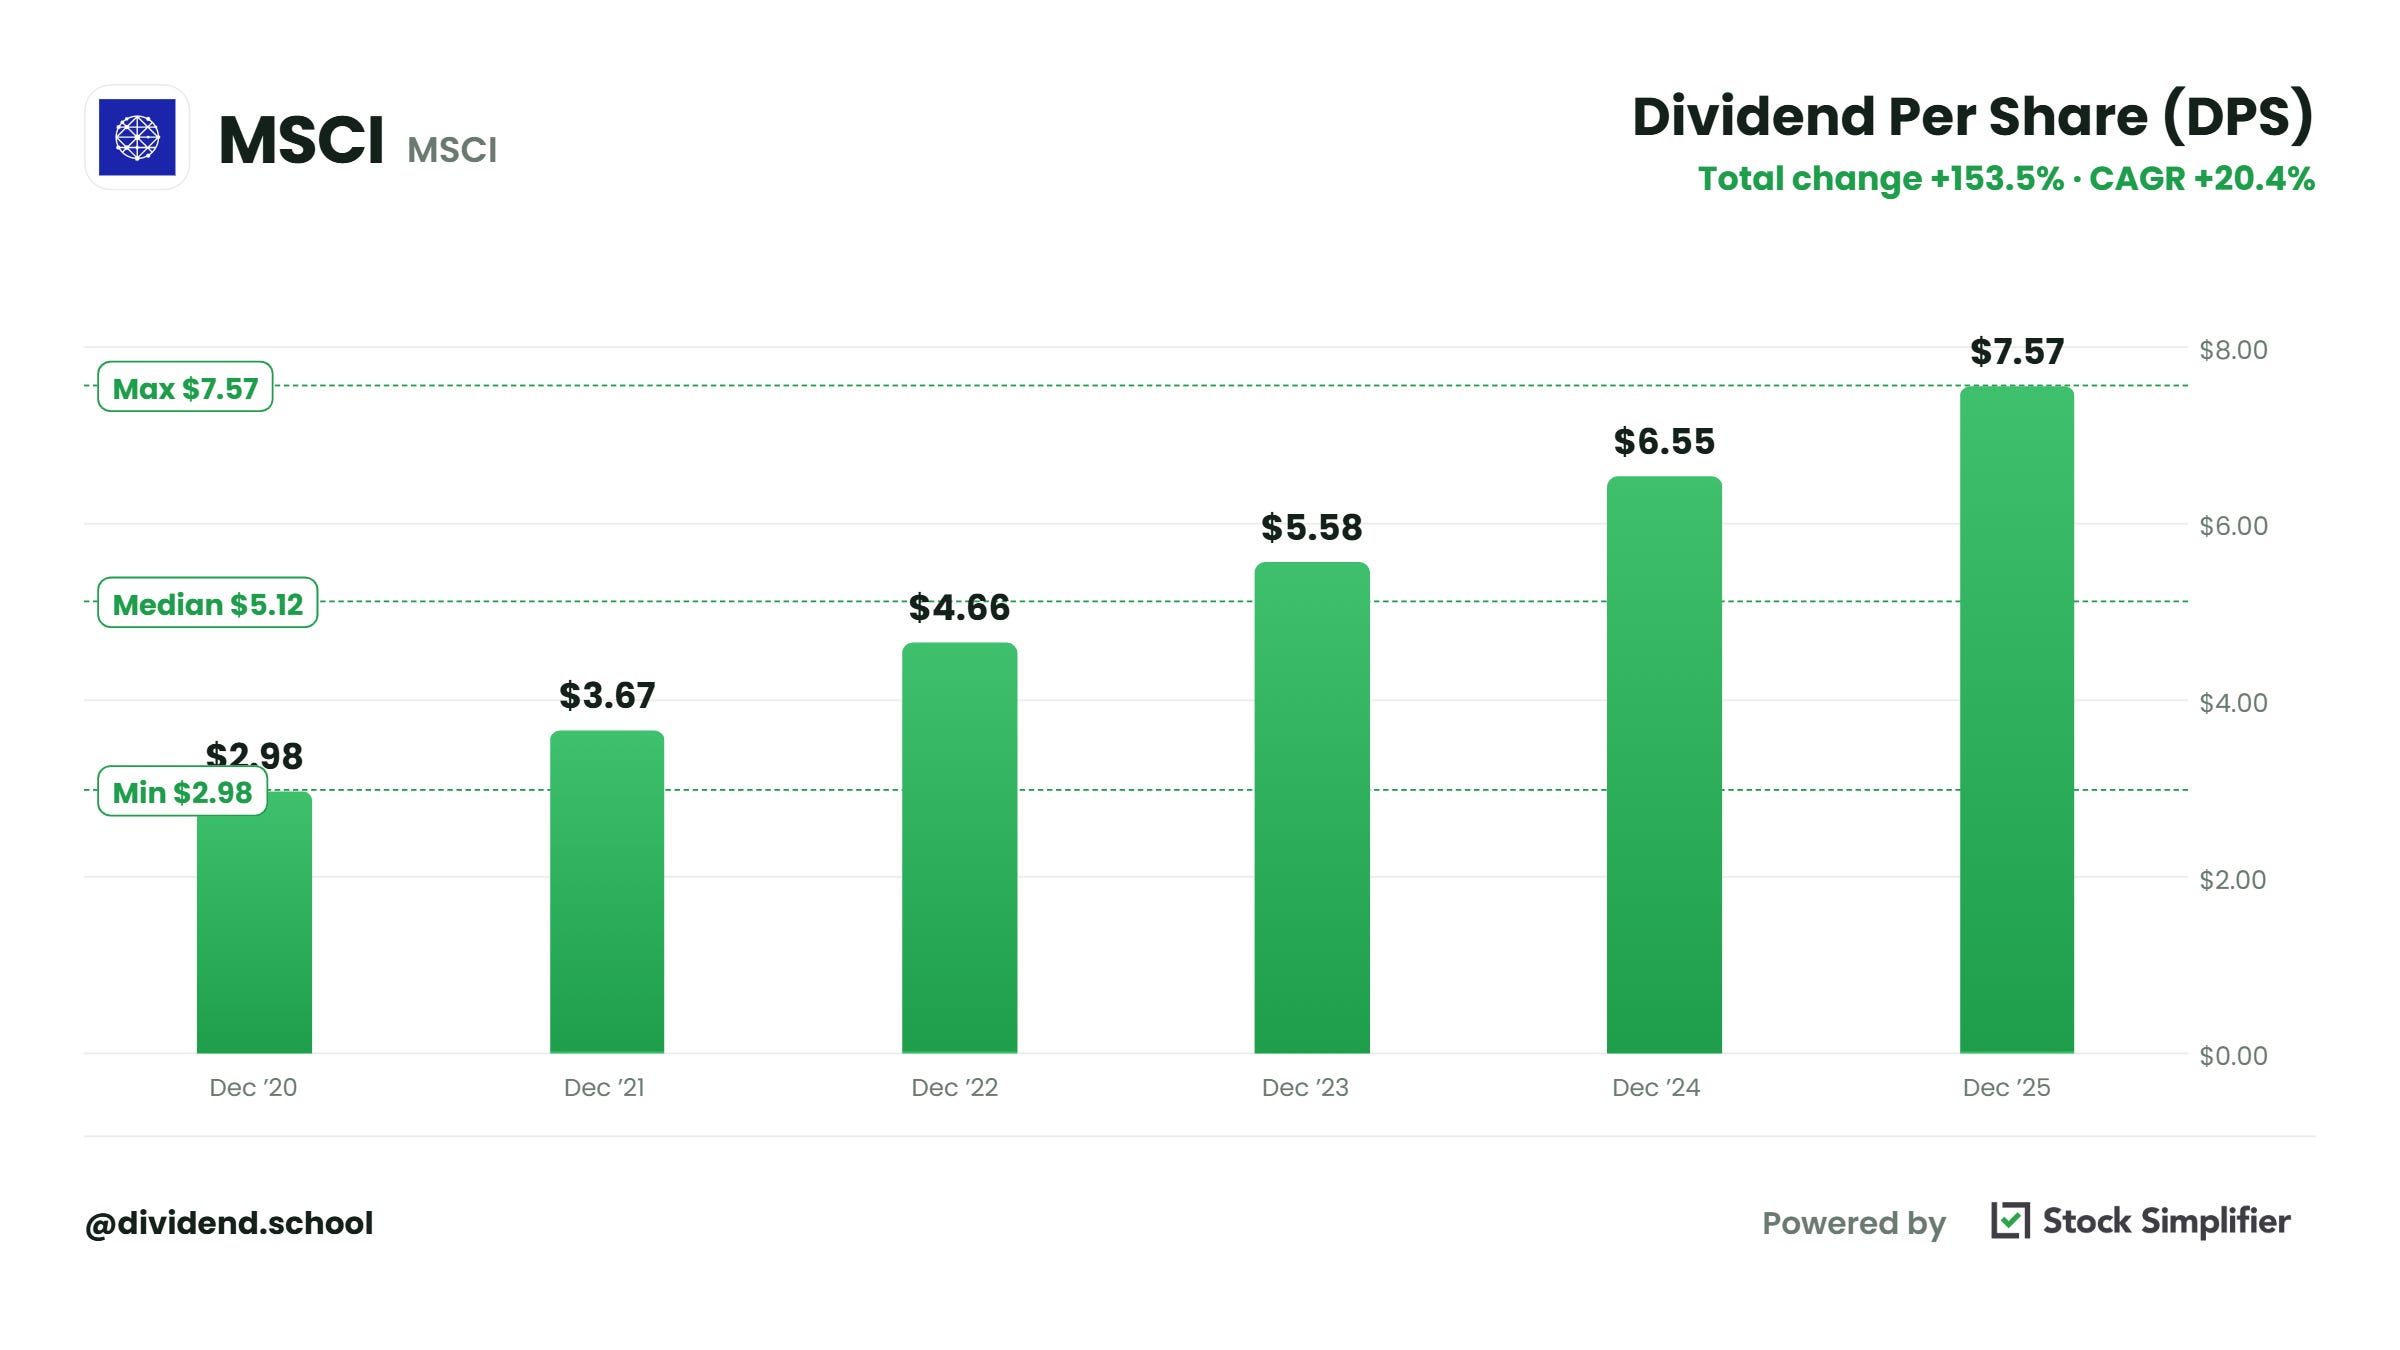
History tells us MSCI has grown faster than the market implies or the price indicates. Both have had a helping hand from good revenue growth and a reduction in shares outstanding over the same period. The dividend has also grown, from $2.98 per share to $7.57 per share or 20.4%.
The gap between what the market believes and what history tells us is where we earn our money. If you believe index investing continues to compound and MSCI keeps buying back stock, then the price is asking less from you than MSCI has delivered. If you believe index investing has seen better days, then the 11% becomes a lot harder to achieve.
One warning: the reverse DCF is sensitive to changes in both the discount rate and terminal rate. For example, if we drop the discount rate to 9%, then the implied growth rate falls to 8.5%.
A good practice with a reverse DCF, run the model with two or three discount rates to get a range of possible outcomes. And then decide what’s reasonable based on your knowledge of the company.
As with P/FCF, substitute the same metrics above for free cash flow for a REIT, BDC, or MLP.
Tool 3: Discounted Cash Flow Model
The dividend discount model values companies based on the present value of all its future dividends, thus the name. The simplest version (which we use), the Gordon Growth Model, needs only three inputs.
Value = next year’s dividend ÷ (required return - dividend growth rate)
Works best for stable dividend growers with rates below the required return. For example, MSCI from above, would break in this model because 10% minus 13.9% gives us a negative number.
Steady growers work best like Coca-Cola, Proctor & Gamble, and Johnson & Johnson.
Today, we are going to use a REIT, VICI Properties ($VICI). For those unfamiliar, VICI owns real estate specializing in casinos on the Las Vegas Strip. Examples include Caesars Palace and the Venetian.
As mentioned earlier, we measure a REIT's cash flows as AFFO, or adjusted funds from operations. AFFO strips depreciation and other non-cash items from earnings.
Here are some inputs from VICI’s Q2 2026 earnings:
Current dividend: $0.45 quarterly, $1,80 annualized
Dividend record: 8 straight years of raises since 2018 IPO
Dividend growth: 7.1% a year since 2019, with recent raises closer to 4%
2026 AFFO guidance: $2.45 to $2.47 a share, with a payout ratio near 73%
Current price: $25.98, for a 6.93% yield
We will use 4% raises for the growth assumption. The earlier years represent a different interest rate environment, and the current raises are more conservative (always a bonus).
Now the math.
Next year’s dividend: $1.80 x 1.04 = $1.87 (10% required return)
Current value: $1.87 ÷ (0.10 - 0.04) = #31.20
With an 11% required return and the same growth rate: $26.74
With an 9% required return and the same growth rate: $37.40
How to interpret all this?
At $25.98, the DDM is telling us that VICI is priced to deliver 11% return if the 4% dividend growth rate holds. We determine the 11% return based on the 6.9% yield and 4% dividend growth.
Again, always use a range of numbers to help give you a sense of what’s possible and reasonable.
As mentioned earlier, the sensitivity warning applies doubly here. The denominator is a small number, so a one-point change in either assumption swings the value big.
How to Use These Tools in Your Process
Use these tools as a process to determine a fair value for every company you buy.
Use the P/FCF or substitute as a screener to find good investment ideas. Compare to historical performance over 5 to 10 years, and then compare to others in the same industry.
Next, run a reverse DCF to determine what growth rates the market is implying with the company’s current price. Judge these assumptions against the company history to determine reasonableness. Remember it is sensitive to the inputs of both the discount rate and terminal growth rate.
And finally, run the DDM to determine a fair value based on the growth of the dividend, which is what we are buying, not the cash flows.
Go a step further than most, write down your assumptions. Six months from now, check those assumptions and determine whether the thesis is still good or broken.
Common Mistakes to Avoid
A few traps to avoid:
Trusting headline free cash flow numbers without verifying with the financials.
Using a DDM on a fast growing dividend payer like MSCI, V, or MA
Treating any ouput as a point estimate. Every number you calculate should measure against a range of numbers.
Always, always check the free cash flow payout ratio or business relevant coverage.
Final Thoughts
None of these tools predict the future; wish they did. But treat them as a method to tell what a company might be worth. And our job is to decide whether or not those assumptions are reasonable.
Value the cash, check the dividend coverage, and understand the dividend growth you are paying for before we buy any company.
Until next time, take care and be safe out there,
Dave
I can’t believe I only now stumbled upon your Substack account Dave. Great to connect!
The MSCI example contains a point worth stating outright: the reverse DCF is solving for free cash flow per share, not free cash flow, so a company retiring stock can meet the implied rate with slower business growth. That makes the buyback a real part of the forecast, and also the assumption most exposed to a change of mind by management, since repurchases can be paused in a way that revenue cannot. Checking whether the implied growth still works with the share count held flat is a quick way to see how much of the case rests on it.