

Hi everyone!
One of the five companies on today’s list cut its dividend 55% on July 31.
I pulled up a screener alert on it dated September 10. It listed the yield at 8.2%.
That number is built from a dividend the company stopped paying in July, divided by a September price. The trailing dividend told the story it did, but the company cut the dividend, which is a story we will tell. It also broadcast that a cut was on the horizon once we dug into the financials.
That is this month’s lesson, and it runs through all five names. Every company reports trailing numbers because history is what we have to work with. The trick is to read the financials and figure out what story they're telling us. For example, a tariff refund that will not repeat. An accounting reversal. A cut that has not caught up. Same tools, same screens, five different ways to get it wrong
Okay, let’s dive in and grade this month’s batch.
1. TELUS (TU)
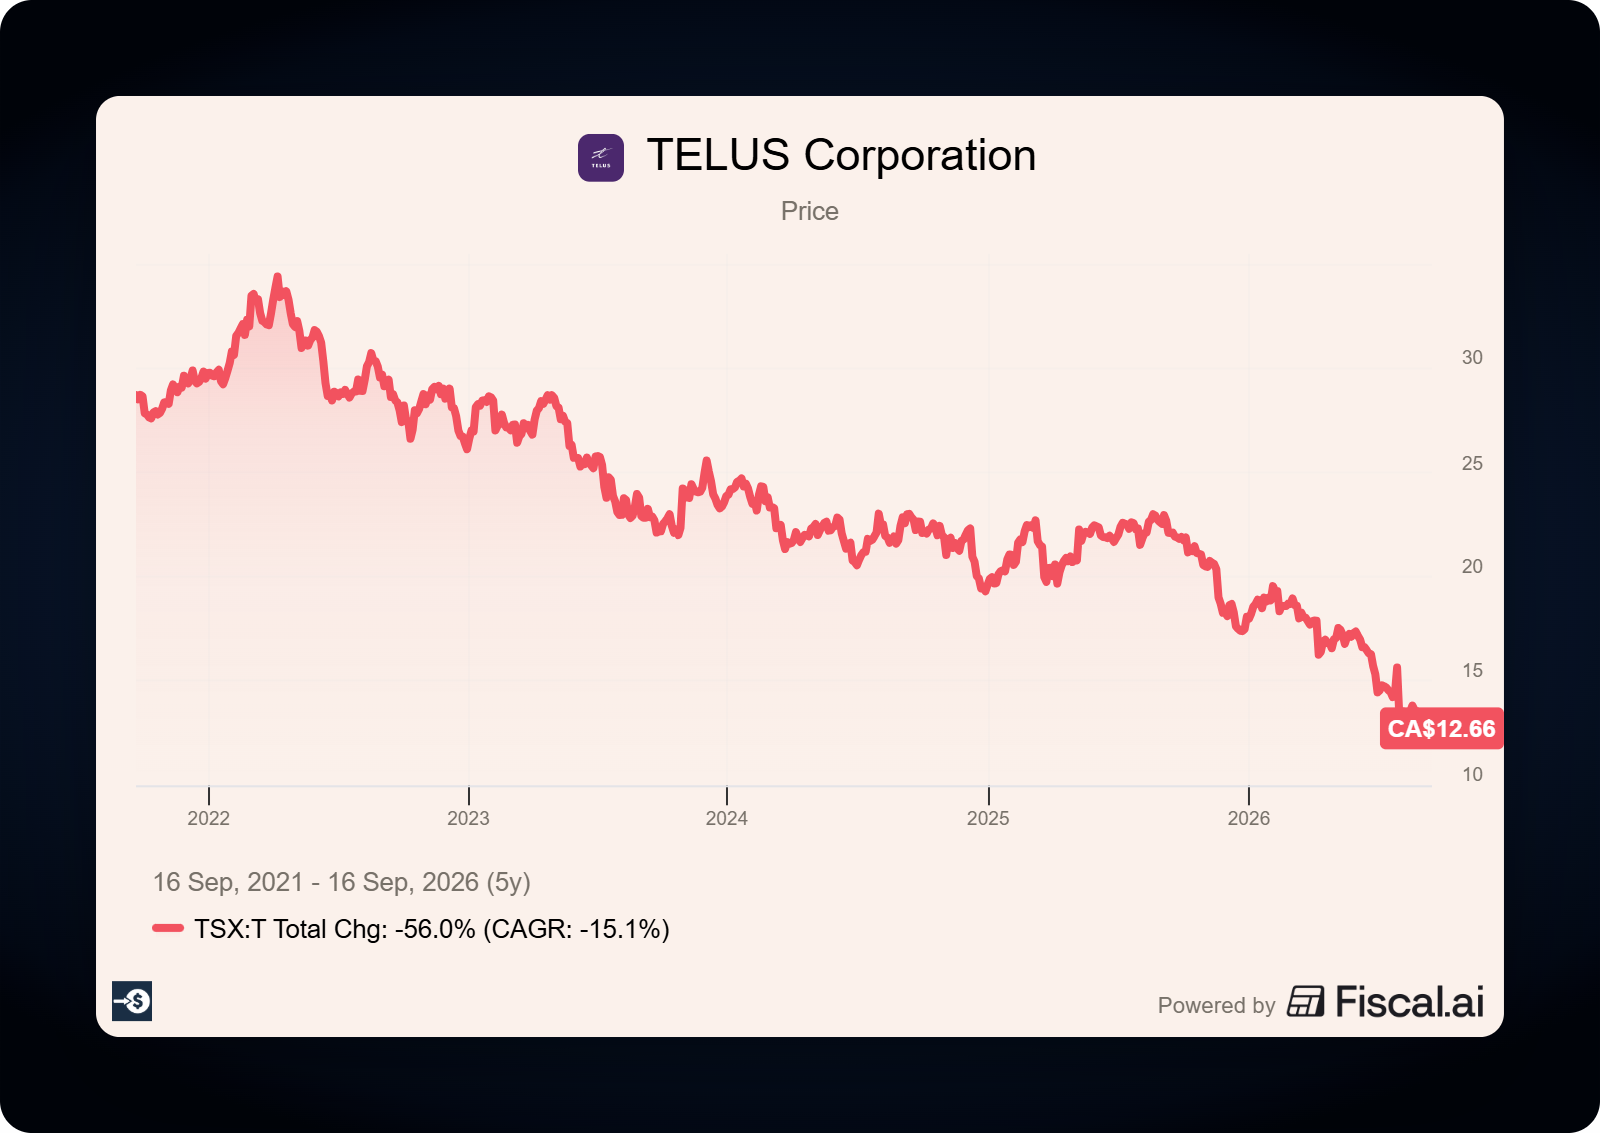
TELUS is one of Canada’s three big telecom carriers. It has wireless, internet, and a couple of side businesses in health and agriculture that were supposed to be the growth story.
The company is unlike any I have covered before, and it offers us a great case study.
On July 31, TELUS cut the quarterly dividend from CAD 0.4184 to CAD 0.1875. That is a 55% cut. The multi-year dividend growth program, 34 increases since 2004, was withdrawn entirely. Free cash flow guidance for 2026 came down from CAD 2.45 billion to CAD 1.8 billion. The company also took a CAD 2.1 billion write-down on TELUS Digital, the business it had finished buying out nine months earlier.
We are not asking if this is a trap; instead, we are reading what went wrong and trying to anticipate it in the future.
What did it look like on the way down?
At USD 9.10 on the NYSE, the forward yield is 5.94% (CAD 0.75 annualized, converted).
The screener alert I mentioned at the top said 8.2%. Here is how it got there: it took the Canadian-dollar dividend and divided it by the US-dollar price. Two currencies, no conversion, and simple division math all on a company cutting its dividend.
The payout ratio gave us the clues
We could have predicted this by looking at the payout ratios.
TELUS’s payout ratio over the trailing twelve months before the cut:
On TELUS’s own definition of free cash flow: 112% (CAD 2,601M of dividends / CAD 2,313M of free cash flow)
On plain operating cash flow minus capex: 108% (CAD 2,601M / CAD 2,405M)
Against the company’s own stated target of 60% to 75%
A company paying 112% of its free cash flow is not paying us out of the business. It is paying us out of something else. In TELUS’s case, two things: debt and new shares.
The share count is the scary part. Weighted average shares went from 1,525 million in the second quarter of 2025 to 1,574 million a year later. Up 3.2% in a year; that’s a lot of dilution for shareholders without any return.
Where did the dilution come from?
Well, TELUS paid a dividend it didn’t earn (funded from debt), and then sold the discounted stock to the market (dilution). All of it making next year’s dividend funding an even bigger bill.
Adam Shine at National Bank called all of this in March: 339 million extra shares since 2019, carrying CAD 567 million of additional annual dividend cost. He called for a cut of at least 30%. It came in July at 55%.
And TELUS told you. Its own disclosure put the payout at 106% of operating cash flow once DRIP dividends were counted. Above 100%, in the company’s own words, in public.
Now the dividend, going forward
So is the reset dividend safe?
The new payout policy is 45% to 60% of trailing free cash flow, down from 60% to 75%.
All of this against trailing free cash flow of CAD 2,313 million, with the reset dividend costing CAD 1,192 million or 52%. Well inside our comfort zone.
Against the company’s own revised 2026 guidance of CAD 1.8 billion, that same dividend is 66%. Still above the top of a target range they announced seven weeks ago.
Which one is right?
Both are. The company’s policy specifies trailing free cash flow and doesn't formally begin until 2027, so this isn't a contradiction. It does mean the reset dividend is only comfortably covered if free cash flow recovers, and adjusted EBITDA is guided to shrink 2% to 4% this year.
Leverage sits at 3.5 times net debt to EBITDA against a 3.0 target. Net debt to EBITDA is just the mortgage-to-income ratio of the corporate world, how many years of operating profit it would take to clear the debt. That target used to be end of 2027. But in July that moved to 2028.
This year will act as a runway, even as leverage grows from 3.4 to 3.5.
What the business is doing
The news even management can’t spin: the subscription numbers are going in the wrong direction.
Mobile phone net adds: 82,000 in Q3 2025, 17,000 in Q2 2026
Mobile ARPU: CAD 57.21 down to CAD 56.36
Churn: 1.06% to 1.08%
Internet net adds: 40,000 down to 20,000
What happened to the growth?
CEO Victor Dodig names the cause plainly: “lower immigration, which is translating into lower demand for certain core products across all carriers.” Canadian telecom grew on population growth for a decade. Now that input is gone, and credit to him for saying it out loud.
One thing for US readers before we leave. TELUS is Canadian, and Canada withholds 25% on dividends to foreign holders, reduced to 15% under the treaty if your broker has a W-8BEN on file. In an IRA, the treaty generally waives it entirely. In a taxable account, we net 5.05% before any foreign tax credit, not 5.94%.
Verdict for our process: Things went south in July, which we could have seen coming in the financials. Now the wreckage is priced in, more or less. If you buy today, you own a reset dividend covered by trailing cash flow, a levered balance sheet, and a subscriber base that has stopped growing. This case study isn't a buy signal; it's an early warning signal from the payout ratio (FCF). And to understand the business and what drives it.
For me, a pass, and the most useful case study on this list.
2. Nike (NKE)
Nike needs no introduction.
At $37.05, the stock yields 4.43%, trades at 17.6 times trailing earnings, and sits 52% below its 52-week high of $76.97. Twenty-four consecutive years of dividend increases.
At first glance, this dividend aristocrat-in-waiting has had a bad decade and looks like a bargain here. After all, it is down roughly 80% from all-time highs.
Then we open the cash flow statement.
Nike paid out more than it earned in cash
How much of the dividend did the business pay for?
Fiscal 2026 ended May 31. Here is the math, and it is not pretty:
Operating cash flow: $2,868 million
Less capital expenditures: $684 million
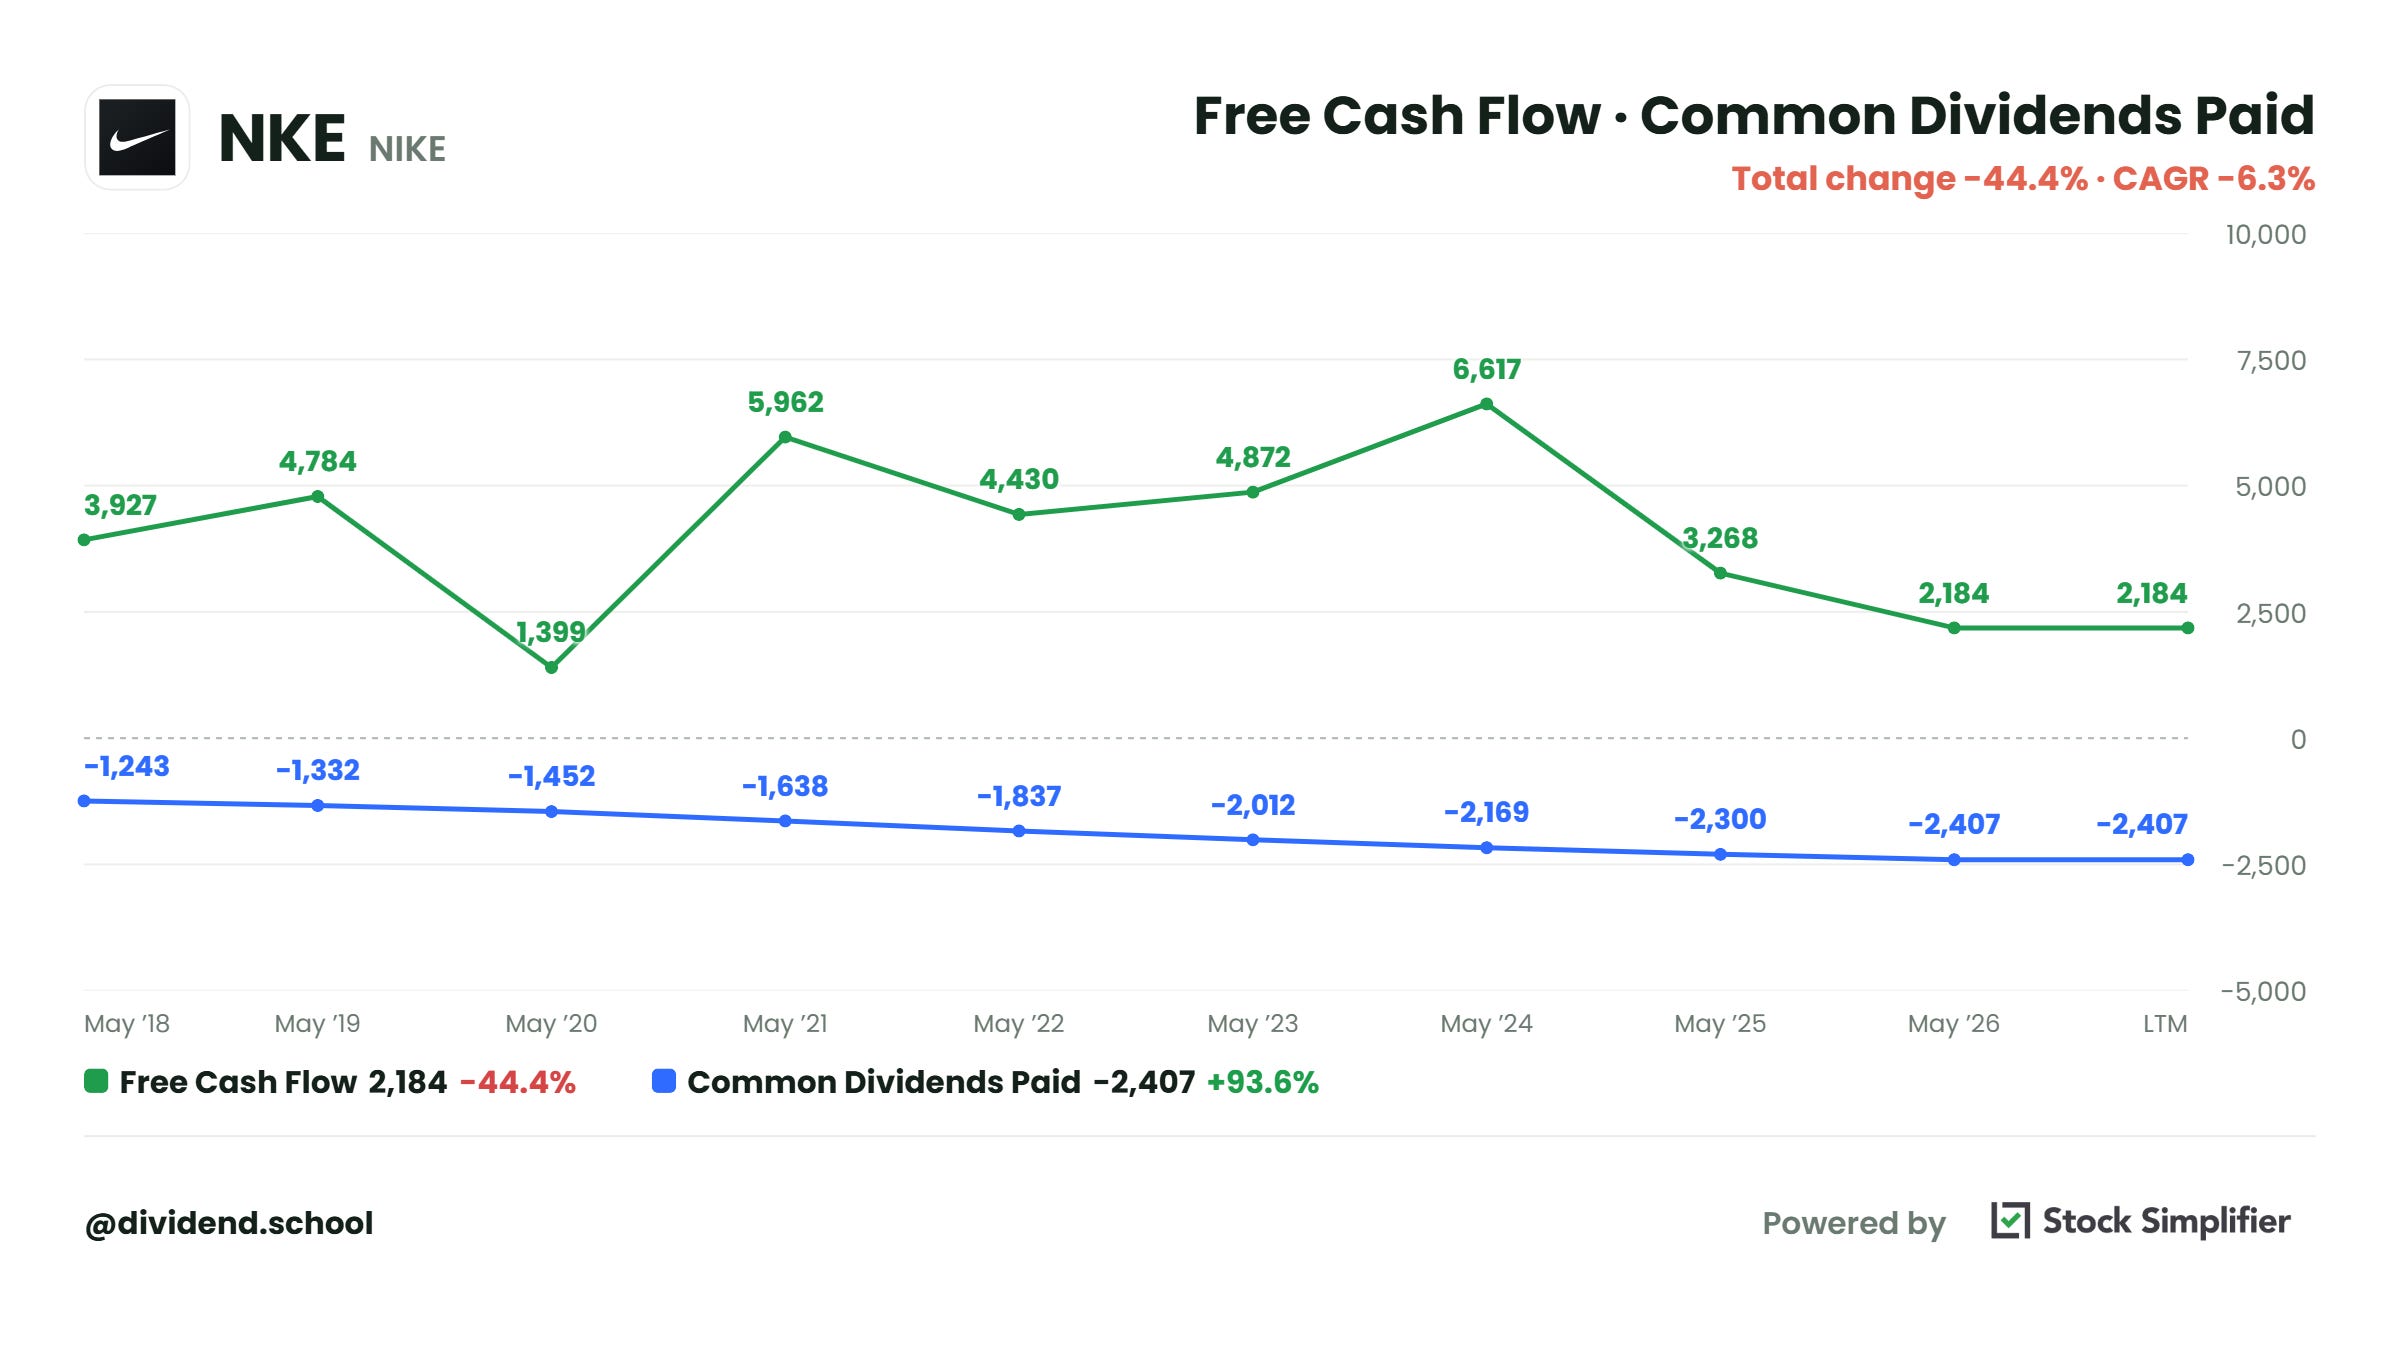
Free cash flow: $2,184 million
Dividends paid: $2,407 million
$2,407M / $2,184M = 110%.
Nike paid its shareholders $223 million more than the business produced in free cash. It funded the difference with balance sheet cash. And while that works for a while, it doesn’t forever.
And it gets worse when we take the tariff refund out. Fiscal 2026 earnings include a $986 million one-time benefit from recovering tariffs paid under IEEPA, after the Supreme Court ruled them unauthorized in February. That is $0.52 of the $2.10 in reported earnings per share. Of the $986 million, just over $300 million had arrived as cash by year-end. The rest sits in receivables owed by the federal government.
Strip it out:
Underlying EPS: $1.58, not $2.10. Payout on earnings goes to 103%
Underlying free cash flow: $1,884 million. Payout goes to 128%
Is this a one-year wobble or a trend? Three years of coverage tells us:
FY2024: $6,617M of free cash flow against $2,169M of dividends — covered 3.05 times
FY2025: $3,268M against $2,300M — covered 1.42 times
FY2026: $2,184M against $2,407M — covered 0.91 times
Operating cash flow is down 61% in two years.
What the board did about it
If the coverage broke, what did the board do?
Two things, and both of them give us better insight than the earnings release did.
The November raise history:
2020: +12%
2021: +11%
2022: +11%
2023: +9%
2024: +8%
2025: +3%
And buybacks went from $2,985 million to $123 million. Down 95%, at a 12-year low share price, by a company sitting on $9 billion of cash.
Think about what that choice is telling us. Given one pool of cash, a 12-year low share price, and a 24-year streak, the board spent it on the dividend streak.
That is a board protecting a record, not funding a policy. When the flexible return gets cut 95% so the fixed one can be maintained, the fixed one has become the constraint.
Neither Elliott Hill nor the CFO said one word about the dividend on the fiscal fourth-quarter call. No analyst asked. I read the transcript twice looking.
The part that settles the valuation question
So is it cheap or not?
Nike’s forward P/E is 21.7. Its trailing P/E is 17.6.
Read that again. The market expects Nike to earn less next year than it did last year, so the forward multiple is higher than the trailing one.
A stock whose forward multiple exceeds its trailing multiple is not cheap. It is a stock whose earnings are still falling, wearing a cheap-looking trailing number. On free cash flow, which is what the valuation runs on, Nike trades at 25.2 times against a five-year average of 31.2 times — a 19% discount, not the 44% the trailing P/E advertises.
What does the business underneath look like, once the tariff benefit is out of it?
Revenue lower. Gross margin down 190 basis points to 40.8%. Greater China down 11% for the year and down 17% in the fourth quarter once we strip out the exchange rate, which is what currency-neutral means. Converse down 31%. Management guided the first quarter down low-to-mid single digits and declined to give a full-year number.
Is any of this fatal? No. We are not predicting bankruptcy.
Nike holds $9.0 billion in cash and short-term investments against $7.9 billion of debt, so it is net cash and could fund this dividend from the balance sheet for years. A cut in the next twelve months would be a choice, not a necessity.
The real near-term risk is not a cut. It is the streak.
Nike has declared its annual raise in the third week of November for six straight years. This year, Investor Day falls on November 16 and 17. A board that went from 8% to 3% while cutting buybacks 95% and watching coverage drop below 1.0 could declare $0.41 again and end a 24-year run.
Verdict for our process: the cheapest-looking number is built from a house of cards (tariffs) that won’t repeat. If you strip out the tariff-inflated numbers, you see lower revenues, lower gross margins, and higher P/E ratios. All while the market is predicting higher forward P/E ratios, telling us it believes earnings will continue to fall. Nike reports its first-quarter results on October 1, and we will have some more clues then.
For me, a trap, and a hard, hard pass. Retail remains on the too-hard pile.
That’s two graded in full, free: the payout arithmetic, the inputs that flatter each one, and the verdict.
Below the line, the other three:
A company whose dividend takes 27% of free cash flow, leaving $13 billion of cushion, trading at under 5 times free cash flow, and which broke a 17-year raise streak anyway. The reason it broke is the whole story.
A business down 70% from its high with a 4.17% headline yield that pays you 2.95%. The gap is not the business. It is a tax most US holders never reclaim, and in a retirement account it is permanent.
A blue chip where the last raise was 1.3%, the buyback has been exactly zero for a full fiscal year, and the multiple has compressed 9%. Three percent yield. Quality is not the question here; price is.
Plus the scorecard, all five graded on valuation, coverage, and what the price already assumes.
Members, keep scrolling. Everyone else, seven days free.
$369 a year or $35 a month. Thirty-day money-back guarantee.