

A 6.8% yield gets called a trap, and a 1.2% yield gets called quality, and most of the time nobody checks either one.
“Don’t chase yield” is the first thing anybody says to a new dividend investor. As advice, it does not survive contact with our own table.
The highest yielder in our Universe pays 6.8% and carries our top safety score, VERY SAFE. The next one down pays 5.8% and carries the same score. Neither one is a trap. Meanwhile, a 2.9% yielder in the same Universe has not raised its dividend in three years, and I did not notice until I went looking.
So the rule cannot be “high yield bad.”
A yield is a fraction. Fractions get big two ways, and only one of them is good news. The payment goes up, or the price goes down. Two completely different companies end up wearing the same number, and the number will not tell us which one we are holding.
That is what the test is for.
In today’s post, we will discuss:
Why the yield by itself gets us nowhere
Step one: does the cash cover the payment
Step two: is the payment still moving
Step three: does yield plus growth clear our hurdle
Where the test breaks and what it cannot tell us
Okay, let’s dive in and build a test we can run on any high-yielder in about 10 minutes.
Why the yield by itself gets us nowhere
Yield is this year’s cash divided by today’s price. It answers one year's worth of questions that have run for decades.
Back on August 18, we said that yield tells us about profits, not price. Same idea here, one step further. A dividend we are still collecting in year ten is worth a great deal more than a dividend that gets cut in year two, and the yield quoted on the screen treats those two as identical.
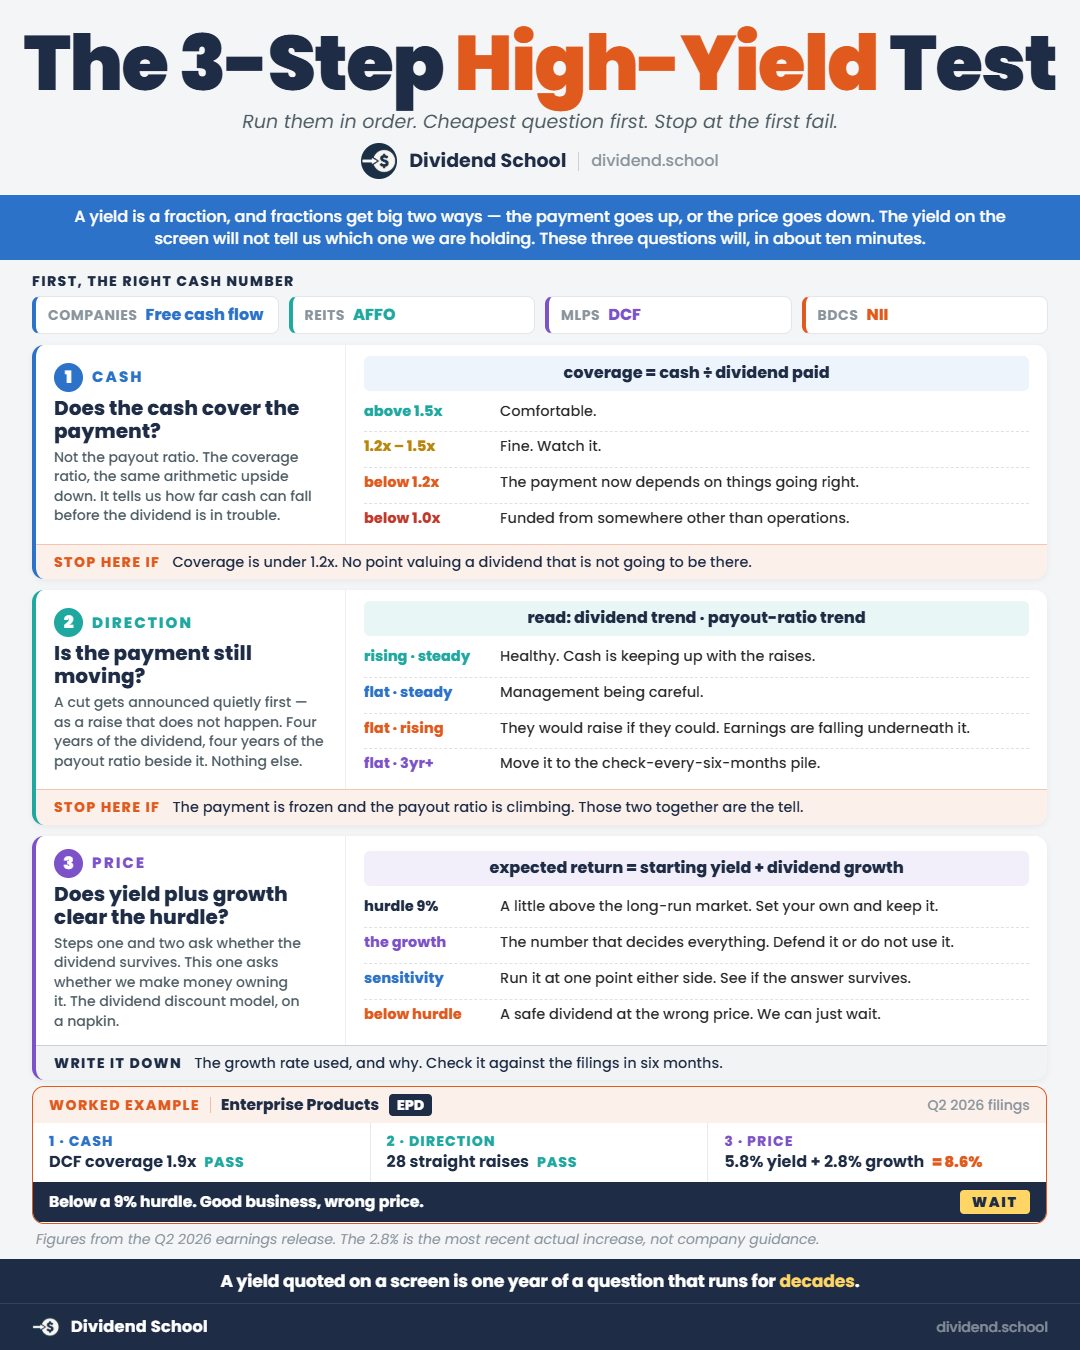
The screen will not do this work for us. Three questions will, and they go in order, cheapest first:
Does the cash cover the payment?
Is the payment still moving?
Does the yield plus its growth clear our hurdle?
Fail the first one, and we stop. No point valuing a dividend that is not going to be there.
One thing to get out of the way before we start, because it trips people up every time. “Cash” means something different depending on what we are holding:
Regular companies: free cash flow
REITs: AFFO, adjusted funds from operations
MLPs: DCF, distributable cash flow
BDCs: NII, net investment income
Use the wrong denominator and the whole test returns garbage. A REIT run on free cash flow looks like it is paying out 40% of nothing, because a landlord with no capital expenditures reports a free cash flow number that flatters it.
Step one: does the cash cover the payment?
Not the payout ratio. The coverage ratio.
Same arithmetic upside down, and it reads better. A 73% payout is a 1.37 times coverage, and 1.37 times tells us straight away how far cash can fall before the dividend is in trouble. Twenty-seven percent, in that case.
Here is where I draw the line, and it is a soft line:
Above 1.5x: comfortable
1.2x to 1.5x: fine, watch it
Below 1.2x: the payment is now depending on things going right
Below 1.0x: the company is funding the dividend from somewhere other than operations
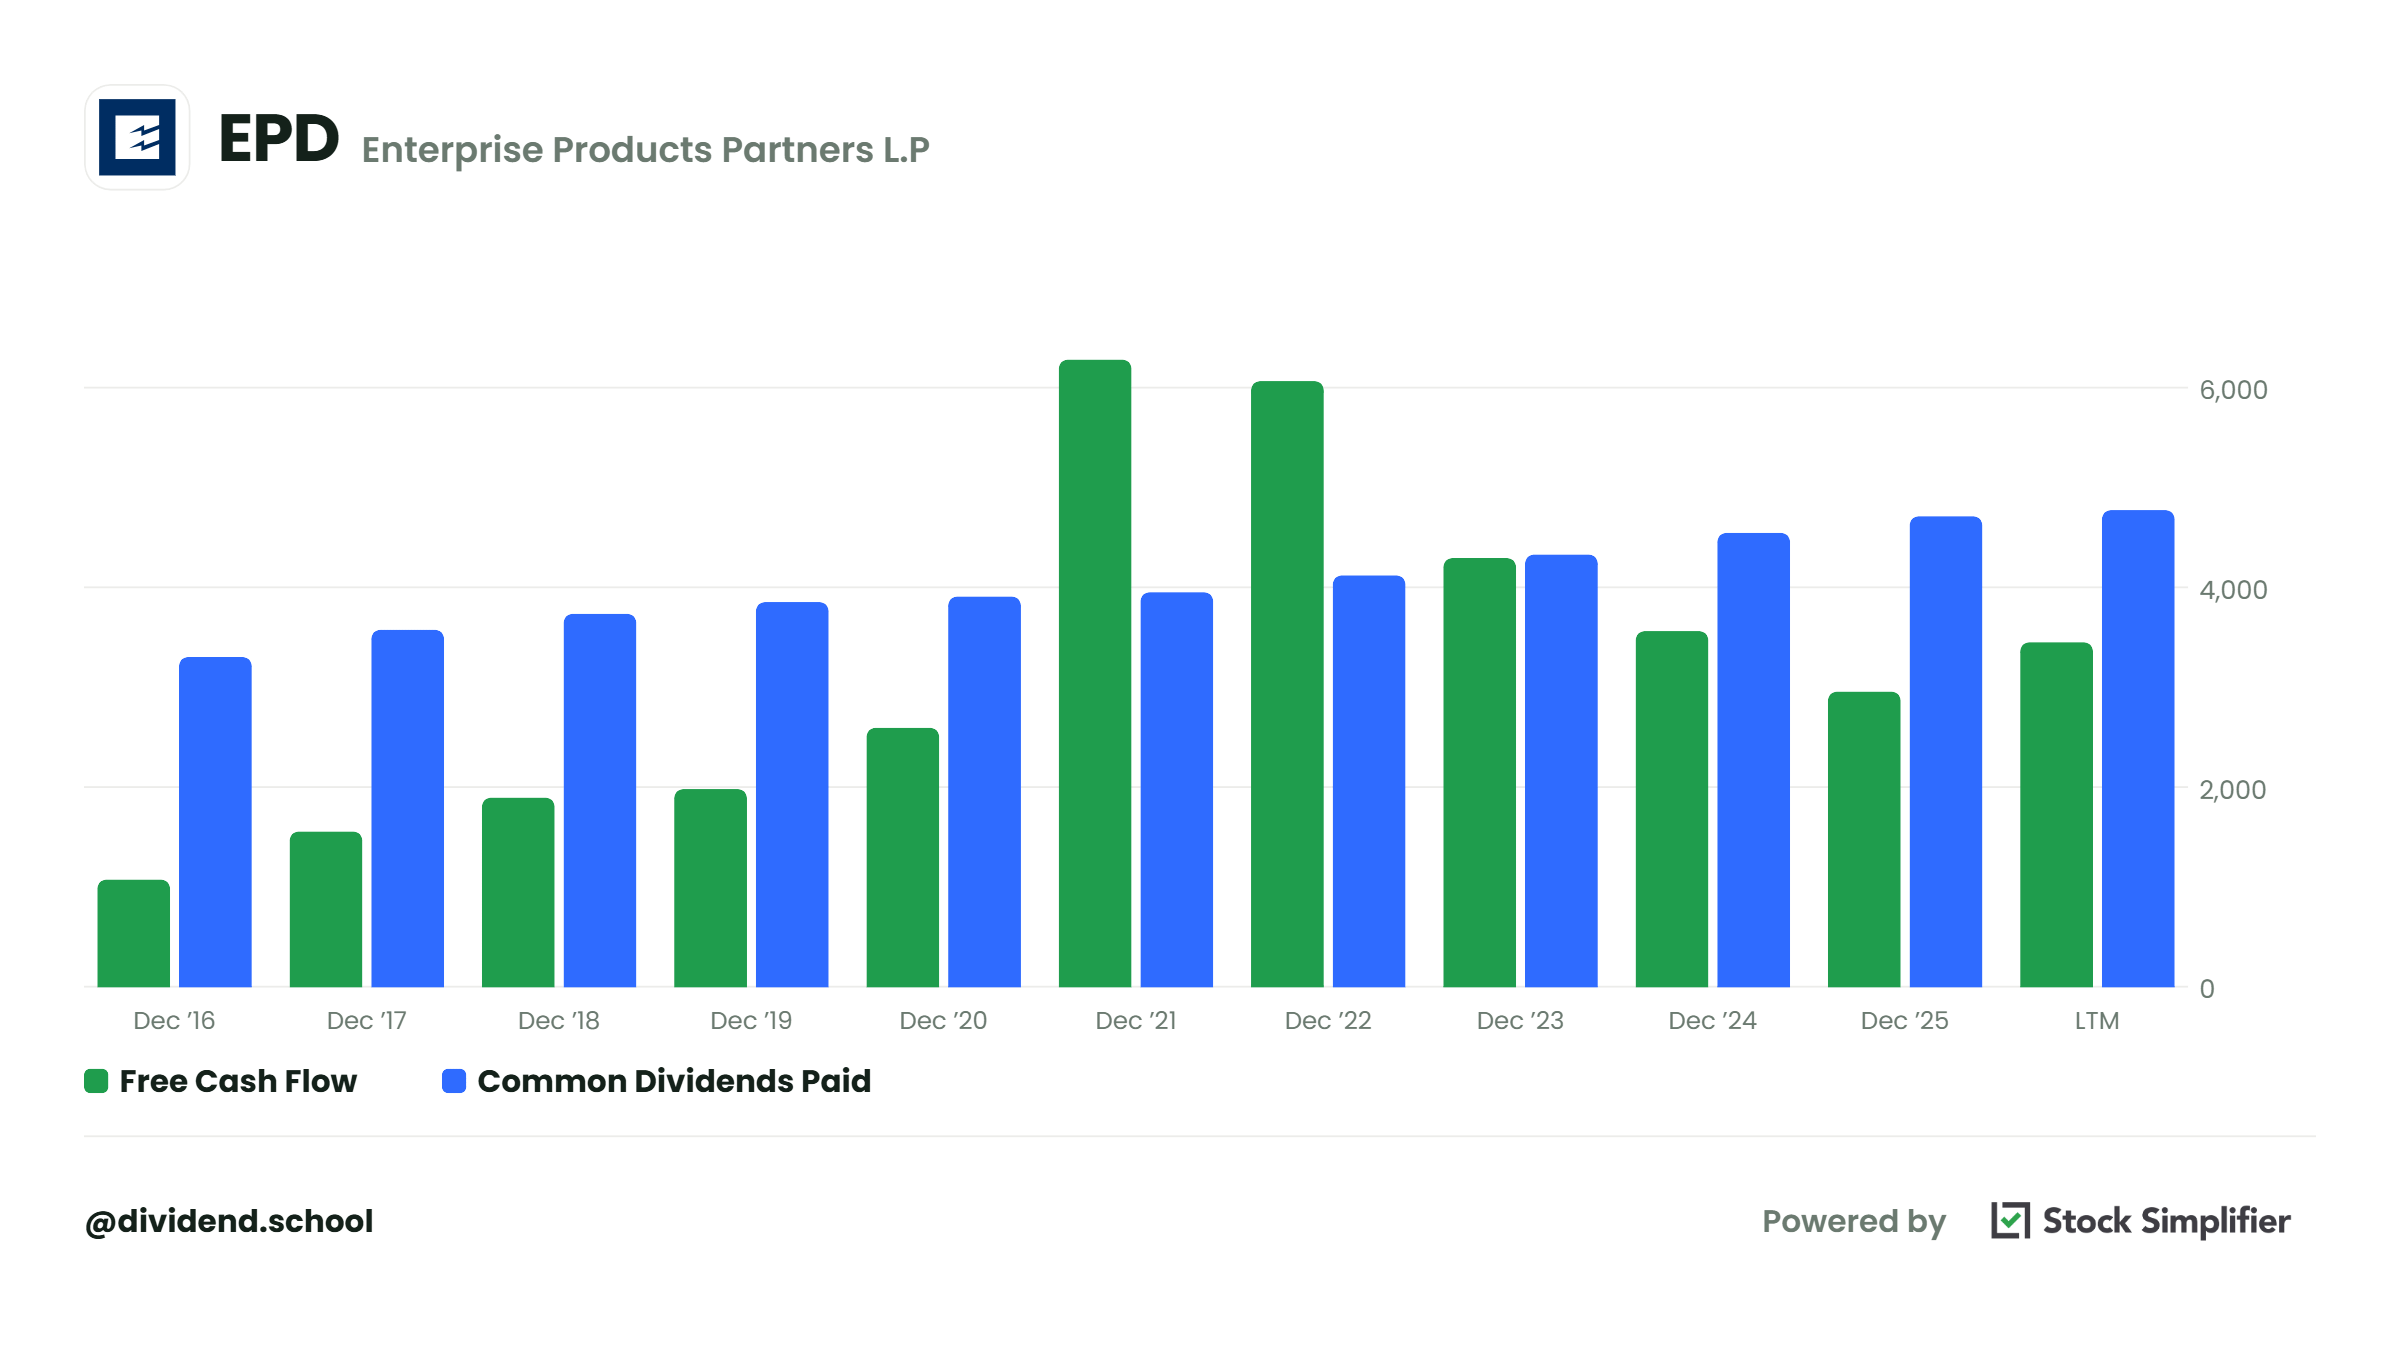
Let’s look at Enterprise Products Partners (EPD) as our guinea pig because it has one of the two highest yields on our board and makes this step look easy.
Enterprise moves natural gas liquids, crude, and petrochemicals through pipelines and terminals, mostly on long-term fee-based contracts. It is an MLP, so we use distributable cash flow, and it issues a K-1 at tax time instead of a 1099. Worth knowing before you buy one in an IRA.
The second quarter numbers:
Distributable cash flow: $2.315 billion
Coverage of the declared distribution: 1.9 times
Adjusted free cash flow: $1.341 billion, up 65%
Adjusted EBITDA: $2.829 billion, a record
Coverage of 1.9 times. Cash flow would have to fall by nearly half before the distribution came under pressure, and it went up.
Step one passed, and it was not close.
Run the same step on VICI Properties, and we get 1.37 times, using AFFO guidance of $2.45 to $2.47 against a $1.80 dividend. Comfortable, less roomy, still clear.
Two 6% yields, both covered. So far the “high yield is dangerous” rule is naught for two.
Is your dividend safe? Check any company for free:
Step two: is the payment still moving?
This is the step I got wrong in my own Universe, so we are going to spend a minute on it.
A cut almost never arrives out of nowhere. It gets announced quietly at first, and the announcement is a raise that never happens. Management stops raising long before it starts cutting, because a freeze costs them nothing and a cut costs them the shareholder base.
Which makes a freeze the single most useful signal we get, and the easiest one to miss. Nothing happens. There is no press release saying “we have decided not to raise the dividend.” The payment just shows up the same as last year, and if we are not looking at four years side by side, we will never see it.
I missed one. LVMH sits in our Universe, and I had it filed as a compounder that raises like clockwork. Then I went and looked:
Fiscal 2022: EUR 12.00
Fiscal 2023: EUR 13.00
Fiscal 2024: EUR 13.00
Fiscal 2025: EUR 13.00
One raise in four years. Frankly, I should have caught that a lot earlier than I did, and the only reason I caught it at all was writing up the Universe and putting the years in a column.
Now the part that turns a boring flat line into an actual warning. Look at what the payout ratio did across those same three flat years:
2023: 43%
2024: 52%
2025: 59%
The dividend did not change, and the payout ratio climbed by 16 points. That only happens one way. Earnings fell underneath it.
WARNING: This is the case that fools people. A flat dividend with rising coverage is a management team being careful. A flat dividend with a falling cushion is a management team that would like to raise and cannot, and those two look identical on a dividend history page. Always pull the ratio alongside the payment.
The 2026 interim came in at EUR 5.50, the same interim they have paid every year since 2023. Year four.
So what do we do with that?
We do not sell on a freeze. A freeze is information, not a verdict. LVMH is still a business I want to own at a price. What the freeze does is move it out of the “raises every year, do not need to check” pile and into the “check every six months” pile, which is where it should have been all along.
Step two is a directional question and takes about 90 seconds. Four years of the payment, four years of the ratio, side by side. That is the whole step.
Step three: does yield plus growth clear our hurdle?
The first two steps ask whether the dividend survives. This one asks whether we make any money owning it, and they are genuinely different questions.
The dividend discount model we ran on August 18 is the long way round. Rearranged, it gives us a shortcut that fits on a napkin:
Expected return = starting yield + dividend growth rate
That is it. Buy a 6% yield that grows 3% a year and hold it while the valuation stays put, and we are looking at 9% a year. The market can do whatever it likes in between, and over a long enough stretch this is what shows up.
So we need a hurdle. Mine is 9%. That is where I sit on a good-quality dividend payer, because it is a little above the long-run market average, and I want the premium for the predictability to still leave me ahead.
Back to Enterprise.
Yield: 5.83%, at $38.43
Most recent increase: 2.8%
Yield plus growth: 8.6%
Below the hurdle.
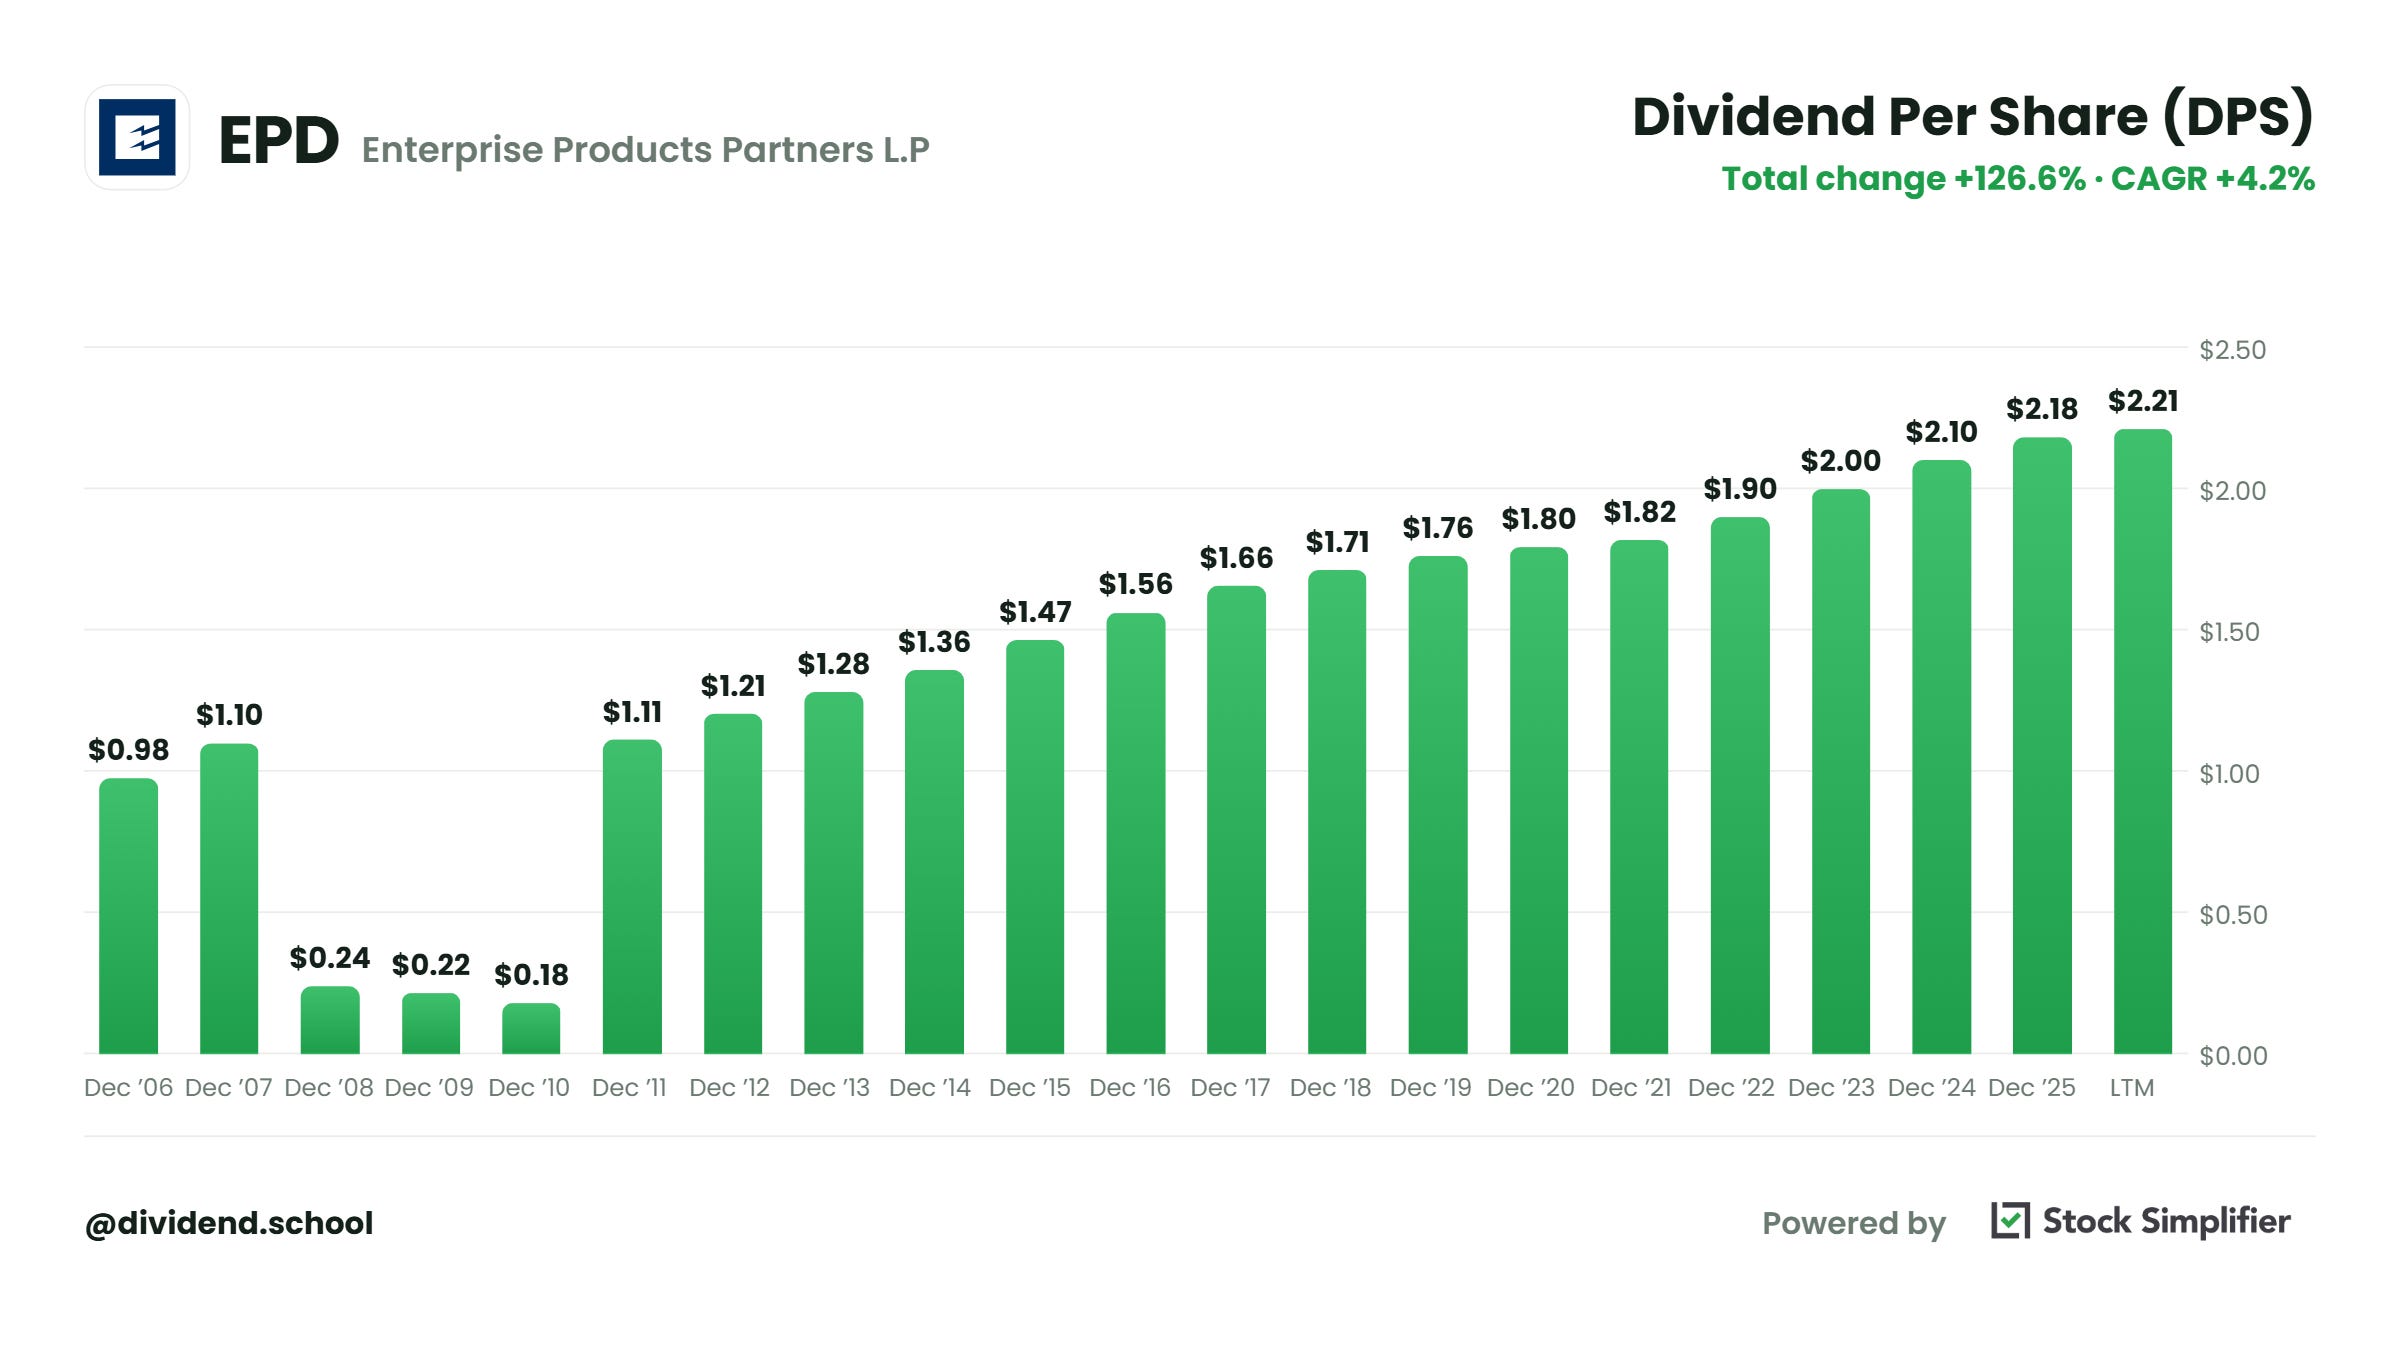
And notice what did not happen there. Nothing broke. Coverage is 1.9x, 28 straight years of increases, distributable cash flow up, and a record EBITDA quarter. This is a good business paying a safe distribution, and it still does not clear the bar.
Because the growth stopped keeping up. A 2.8% raise on a 5.8% yield is a fundamentally different investment than the same yield growing 7%, and the yield quoted on the screen is identical in both cases.
Our Buy Below on EPD is $32.77. It trades at $38.43, so it sits 17.3% above the price where this becomes a buy for us. That is not a criticism of the company. It is the price that asks for more than the cash flow can afford to pay, and we can just wait.
Two notes before you run this on your own book.
The growth rate is the number that decides everything, and it is the one we have to defend. The 2.8% above is EPD’s most recent actual increase, not company guidance, because Enterprise has not guided to a distribution growth rate at all. When we pick a growth number, we are making a claim, and we should be able to say where it came from.
And the sensitivity warning applies twice, same as it did in August. A single point of growth swings the answer. Run it at 2%, run it at 4%, and see whether the conclusion holds across the range before committing to it.
Where the test breaks
Three things it will not do for us.
It will not catch a business that is about to change. Coverage, direction, and price are all measured on what has already happened. A tenant walking away, a regulator moving, a contract repricing- none of that shows up until it shows up.
It will not tell us anything useful about a company whose growth rate exceeds our hurdle rate. Run this on Mastercard, and the arithmetic falls apart, same as the DDM did in August. The test is built for stable payers, and it should be used on stable payers.
And it will not stop us from paying up for a good story. That is what the third step is there to argue with, and it only works if we run it before we buy, not after.
How to run it in ten minutes
The whole thing, start to finish, on any name:
Pull the right cash number. Free cash flow, or AFFO, or DCF, or NII.
Divide it by the dividend. Under 1.2 times, stop reading.
Put four years of the payment in a column. Then put four years of the payout ratio next to it.
Take the current yield, add the growth rate we are willing to defend, and compare it to our hurdle.
Write down the growth rate we used and why. Check it in six months.
That last one is the step everybody skips, and it is the one that compounds. A number we wrote down is a number we can be wrong about on purpose, which is the only way any of this gets better.
What I would read next
On Saturday, I ran these exact three steps on VICI Properties, which had just touched a 52-week low of $25.81, while the dividend and cash flow rose with it.
Steps one and two came back clean, and I published both, free. Coverage of 1.37 times. Eight straight years of raises. The $413 million “miss” that made the headline in July turned out to be an accounting entry nobody wrote a check for.
Step three is the one members got, and it is the one that cost me something. Running the growth number honestly meant admitting our own table had been carrying VICI at a fair value I could not defend, built on a growth assumption I had been too generous with. So I cut it, in public, and showed the grid the old number and the new one both fall out of.
The verdict, the arithmetic behind the growth rate, and the new Buy Below are here:
[VICI Just Hit a 52-Week Low. Bargain or Trap?]([VICI POST URL])
Seven days free to read it. After that, it’s $369 a year or $35 a month, with a 30-day money-back guarantee either way.
Every yield-anchored pick gets these same three steps. The next one lands this month.
Until next time, take care and be safe out there,
Dave
P.S. The three-step test is below as a one-page printable, no email required. Stick it next to the screen. It is the same test in the same order, and it fits on one side of a sheet of paper.