

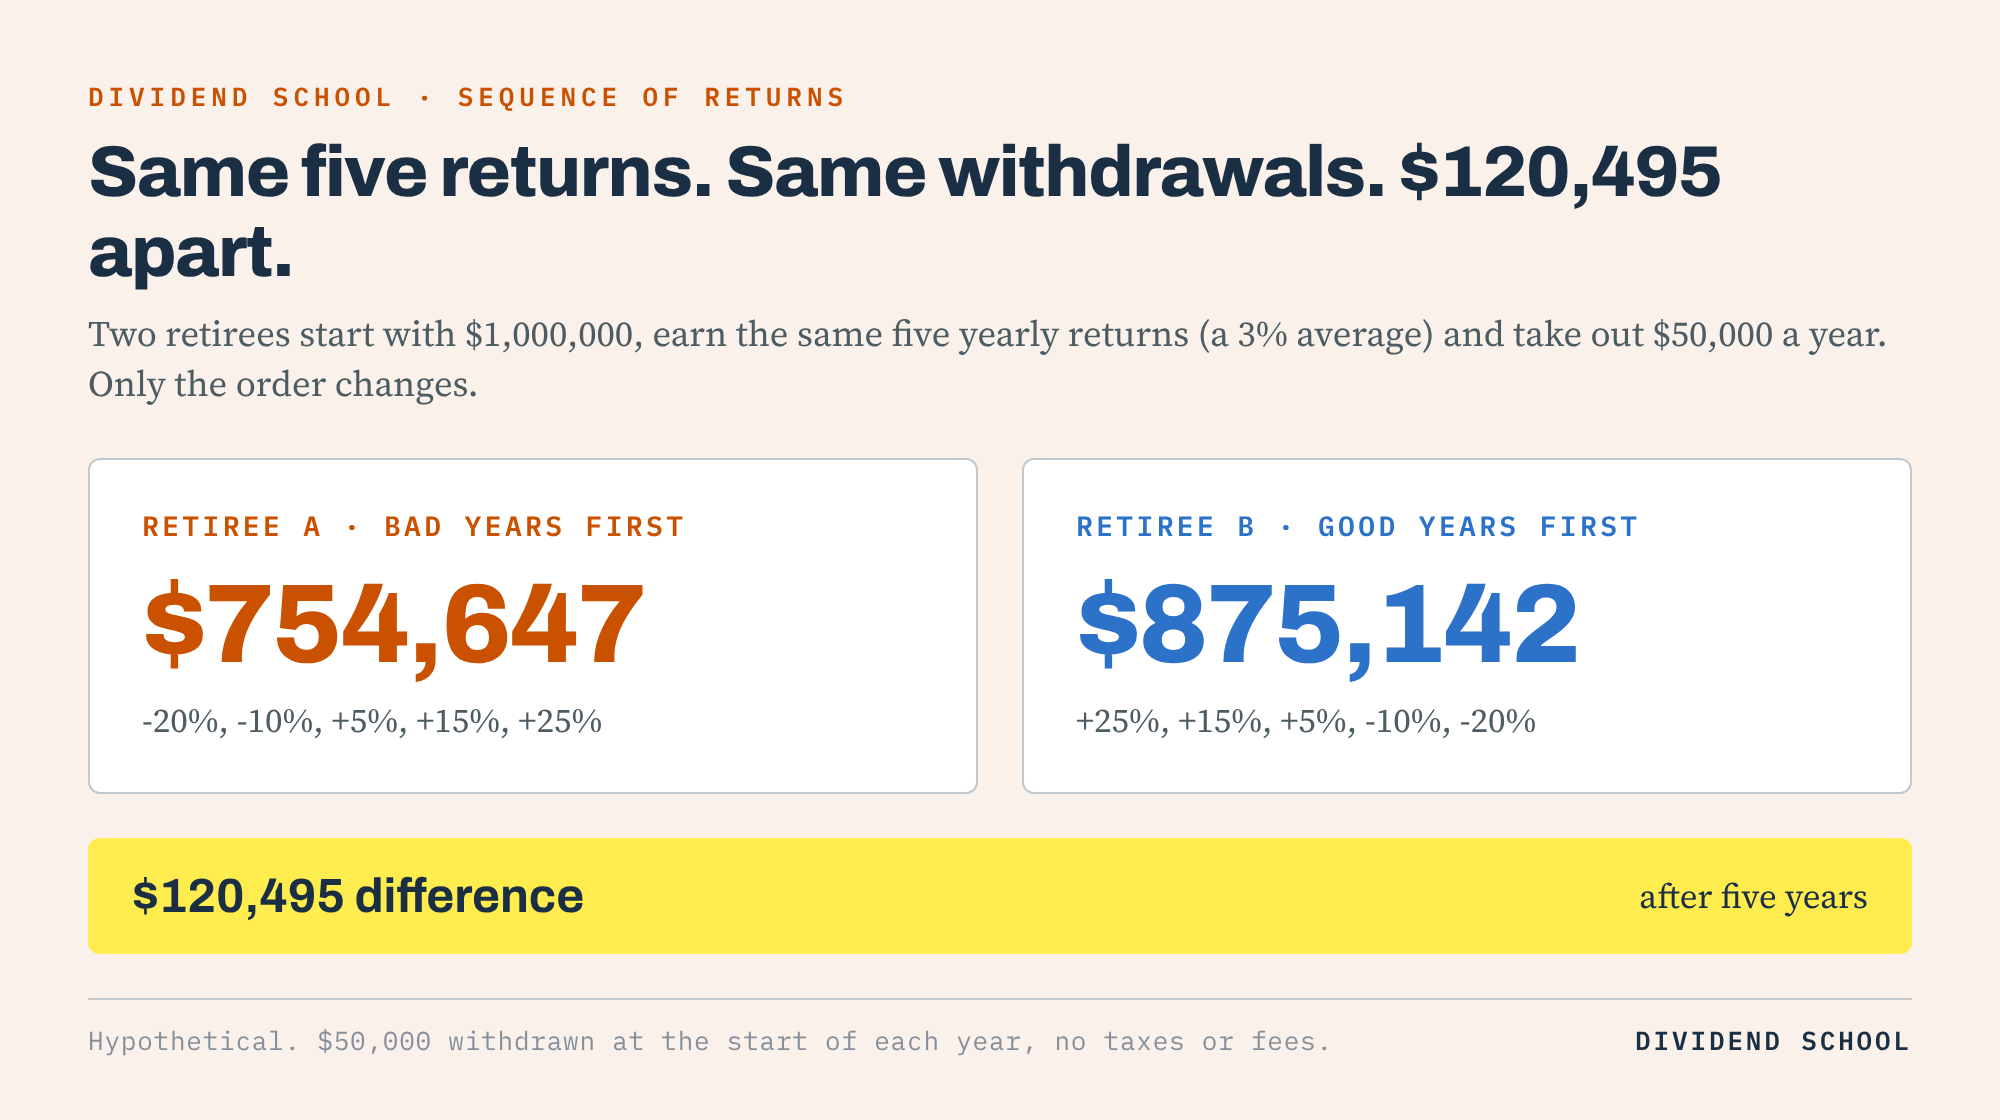
Two retirees start with $1,000,000 each. Both earn the exact same five annual returns, averaging 3% a year. Both take out $50,000 a year to live on.
Five years later, one has $754,647. The other has $875,142.
Same returns, same withdrawals, a $120,495 difference. The only thing that changed was the order the years showed up in.
That’s sequence of returns risk, and it’s the risk I’d worry about most in the years right around retirement. I’m 59, so this one isn’t academic for me.
In today’s post, we will discuss:
What Sequence of Returns Risk Is
Why It Only Matters When We’re Withdrawing
A Real Example: Retiring in January 2000
The Danger Zone Around Retirement Day
How to Set Up a Portfolio for It
Common Mistakes to Avoid
Okay, let’s dive in and learn how the order of returns can sink a retirement plan, and what we can do about it.
What Sequence of Returns Risk Is
Sequence of returns risk is the risk that bad years show up at the wrong time.
Most of us learn to think in averages. The market returns 10% a year over the long haul, so we plan around that number. The problem is that nobody receives the average. We receive the actual years, one after the other, in whatever order the market hands them out.
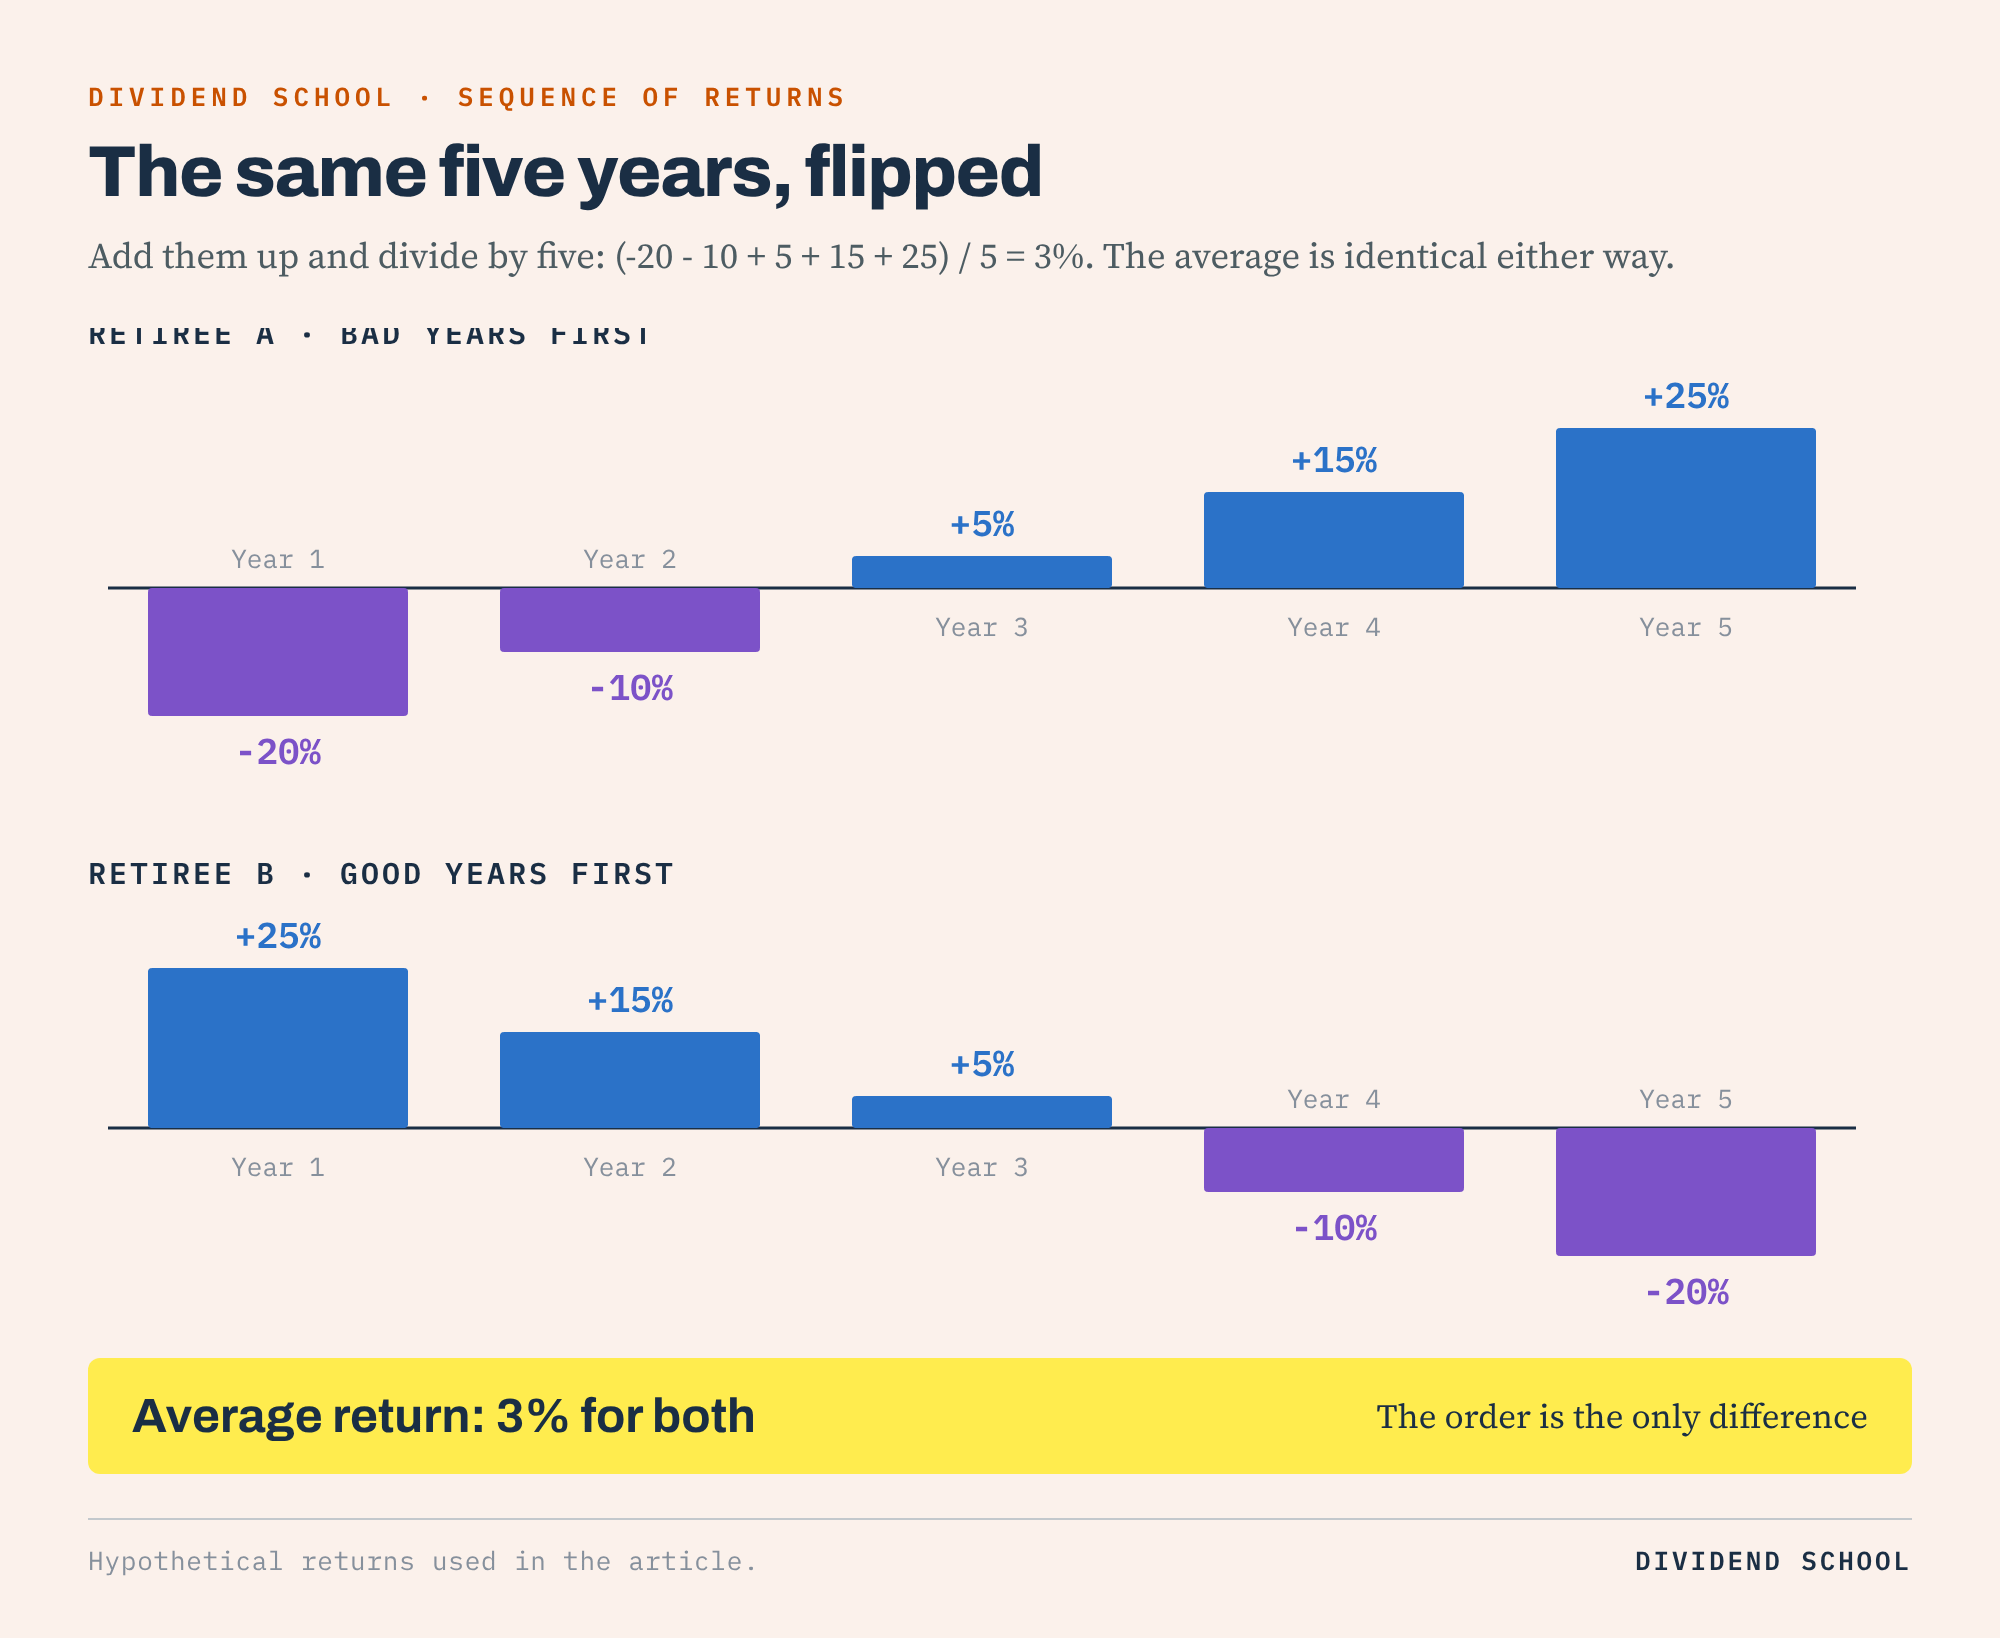
Here are the five returns from our two retirees:
Year 1: -20%
Year 2: -10%
Year 3: +5%
Year 4: +15%
Year 5: +25%
Retiree A gets them in that order, bad years first. Retiree B gets them in reverse, good years first.
The average is 3% either way.
So why did one end up $120,495 behind?
Why It Only Matters When We’re Withdrawing
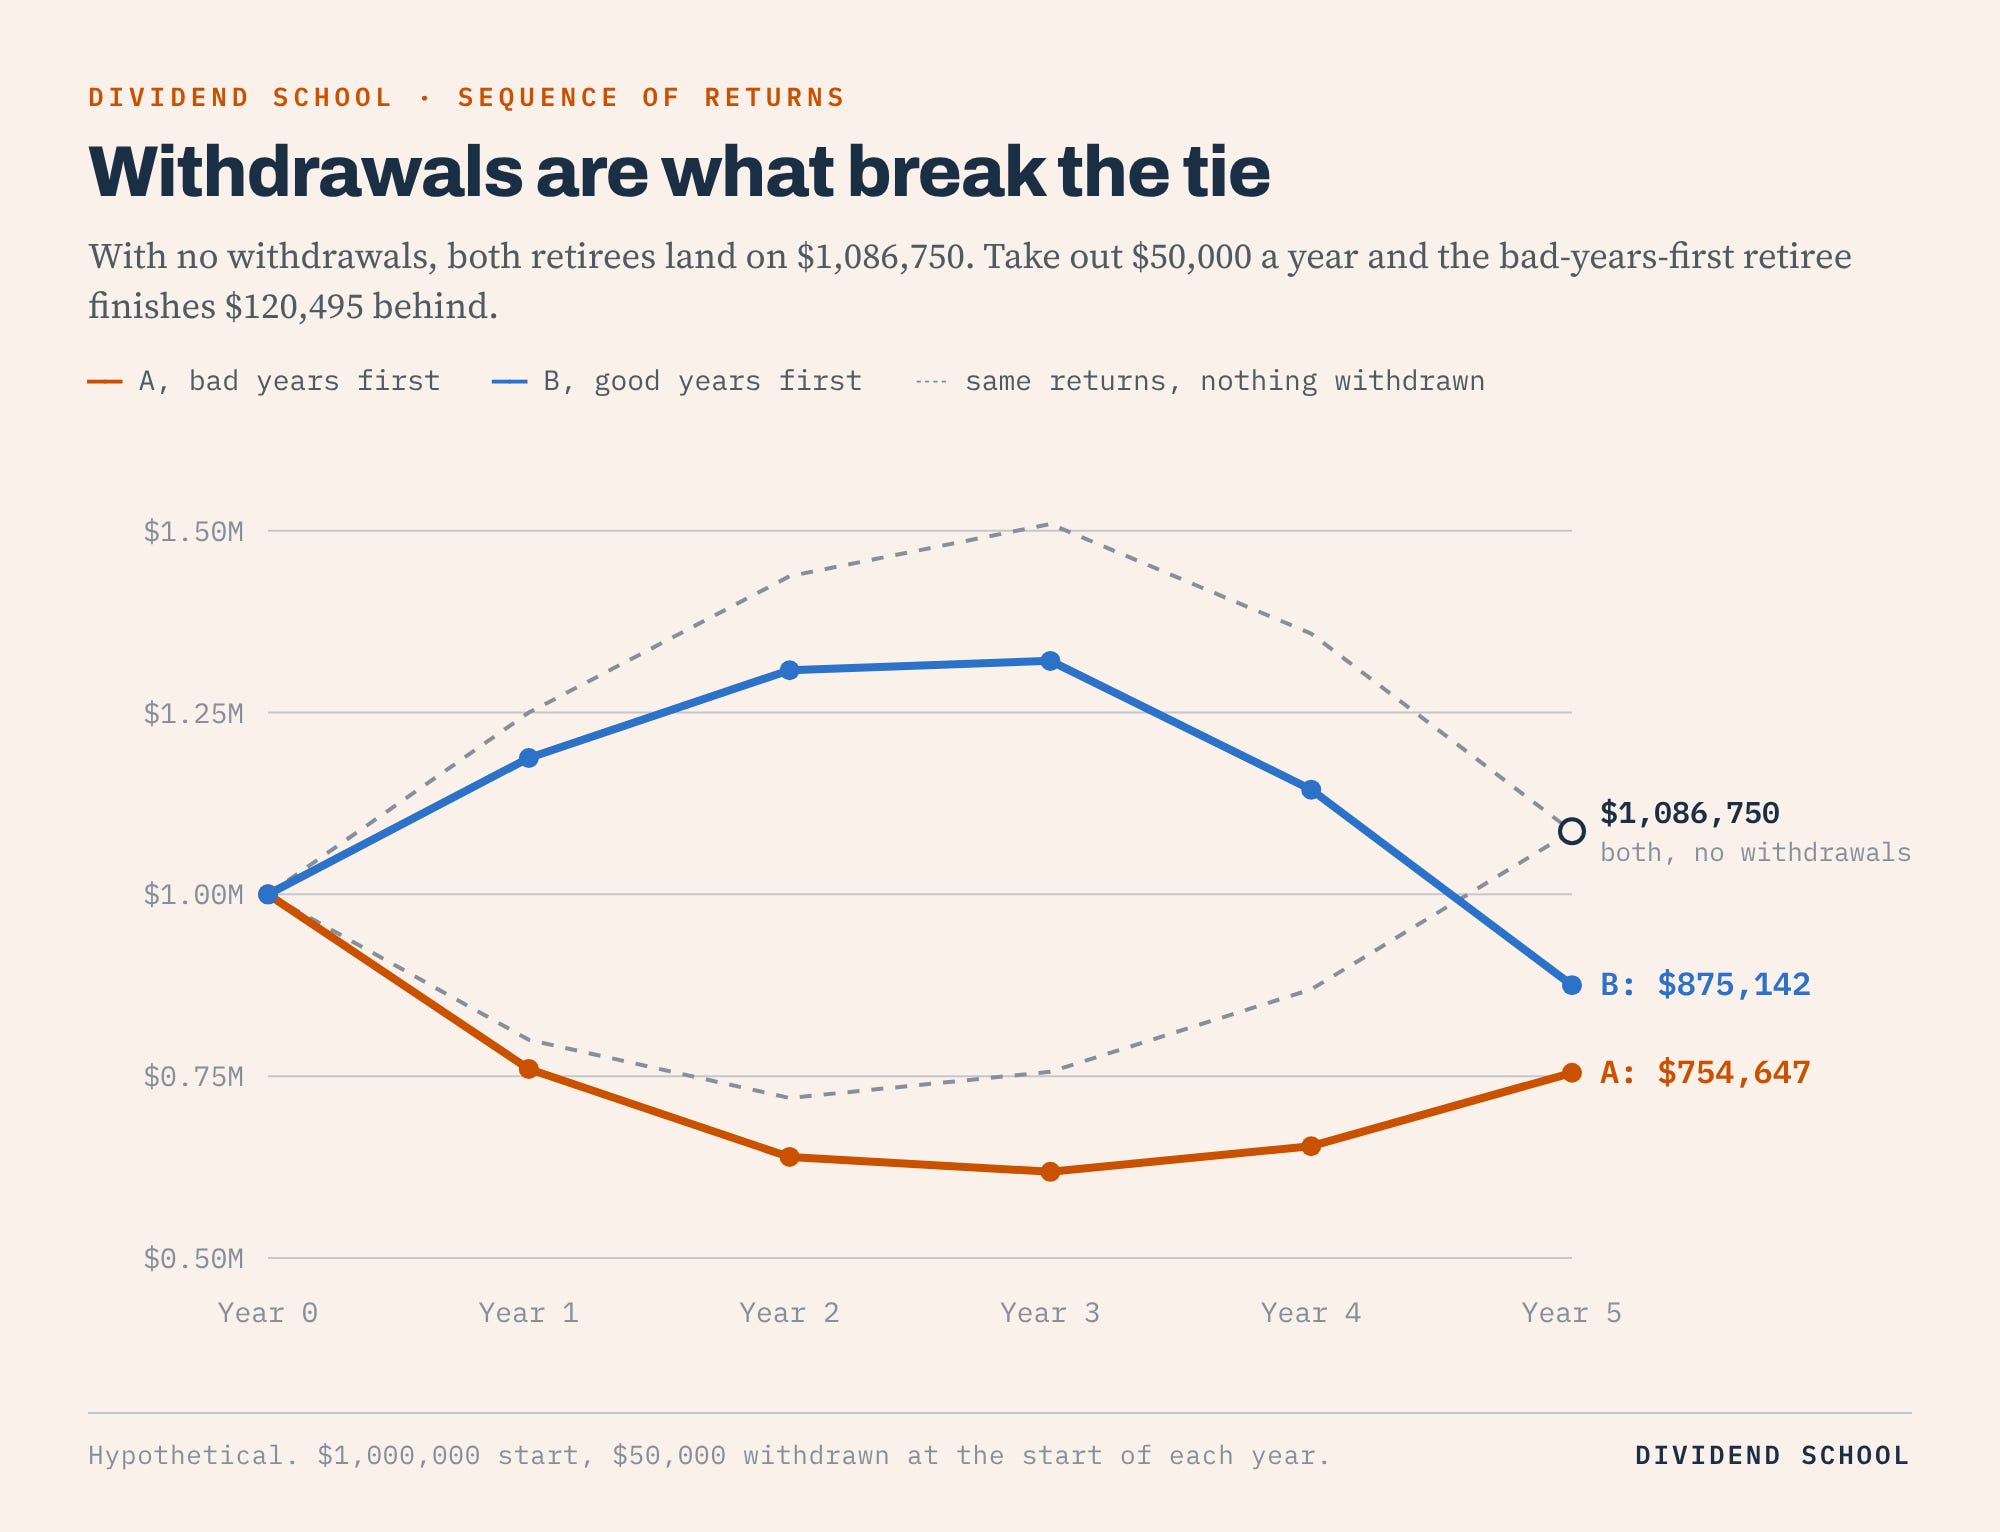
If neither retiree takes out a dime, they finish in exactly the same place. That surprised me the first time I ran it.
Both end at $1,086,750. Multiplication doesn’t care about order. Five returns in any sequence compound to the same number.
The withdrawals are what break the tie.
Watch what happens to Retiree A in the first two years, taking $50,000 out at the start of each year:
Year 1: $1,000,000 - $50,000 = $950,000, then down 20% = $760,000
Year 2: $760,000 - $50,000 = $710,000, then down 10% = $639,000
After two years, Retiree A has $639,000 left to catch the recovery. The +25% year shows up eventually, but it lands on a much smaller pile.
Retiree B spends those same two years pulling $50,000 out of a portfolio that’s growing. By the time the -20% hits in year five, B has already banked the gains.
Ending values:
Retiree A (bad years first): $754,647
Retiree B (good years first): $875,142
The money we sell at the bottom is gone for good. It never gets to come back with the market.
During our working years, we have the opposite setup. We’re adding money every paycheck, so a crash early in our career is a gift; we buy more shares on sale. The moment we switch from adding to withdrawing, the math switches with us.
A Real Example: Retiring in January 2000
The hypothetical is clean. Real history is messier, and worse.
Say someone retired at the start of 2000 with $1,000,000 in an S&P 500 index fund and took $40,000 out at the beginning of each year. One big caveat up front: I kept withdrawals flat at $40,000, with no inflation adjustment and no taxes. A real retiree would have been taking more, so these numbers flatter the outcome.
Here’s what the S&P 500 did, dividends included:
2000: -9.03%
2001: -11.85%
2002: -21.97%
Three years, down 37.4% in total.
Our retiree’s portfolio at the end of 2002? $541,969. Down 45.8%.
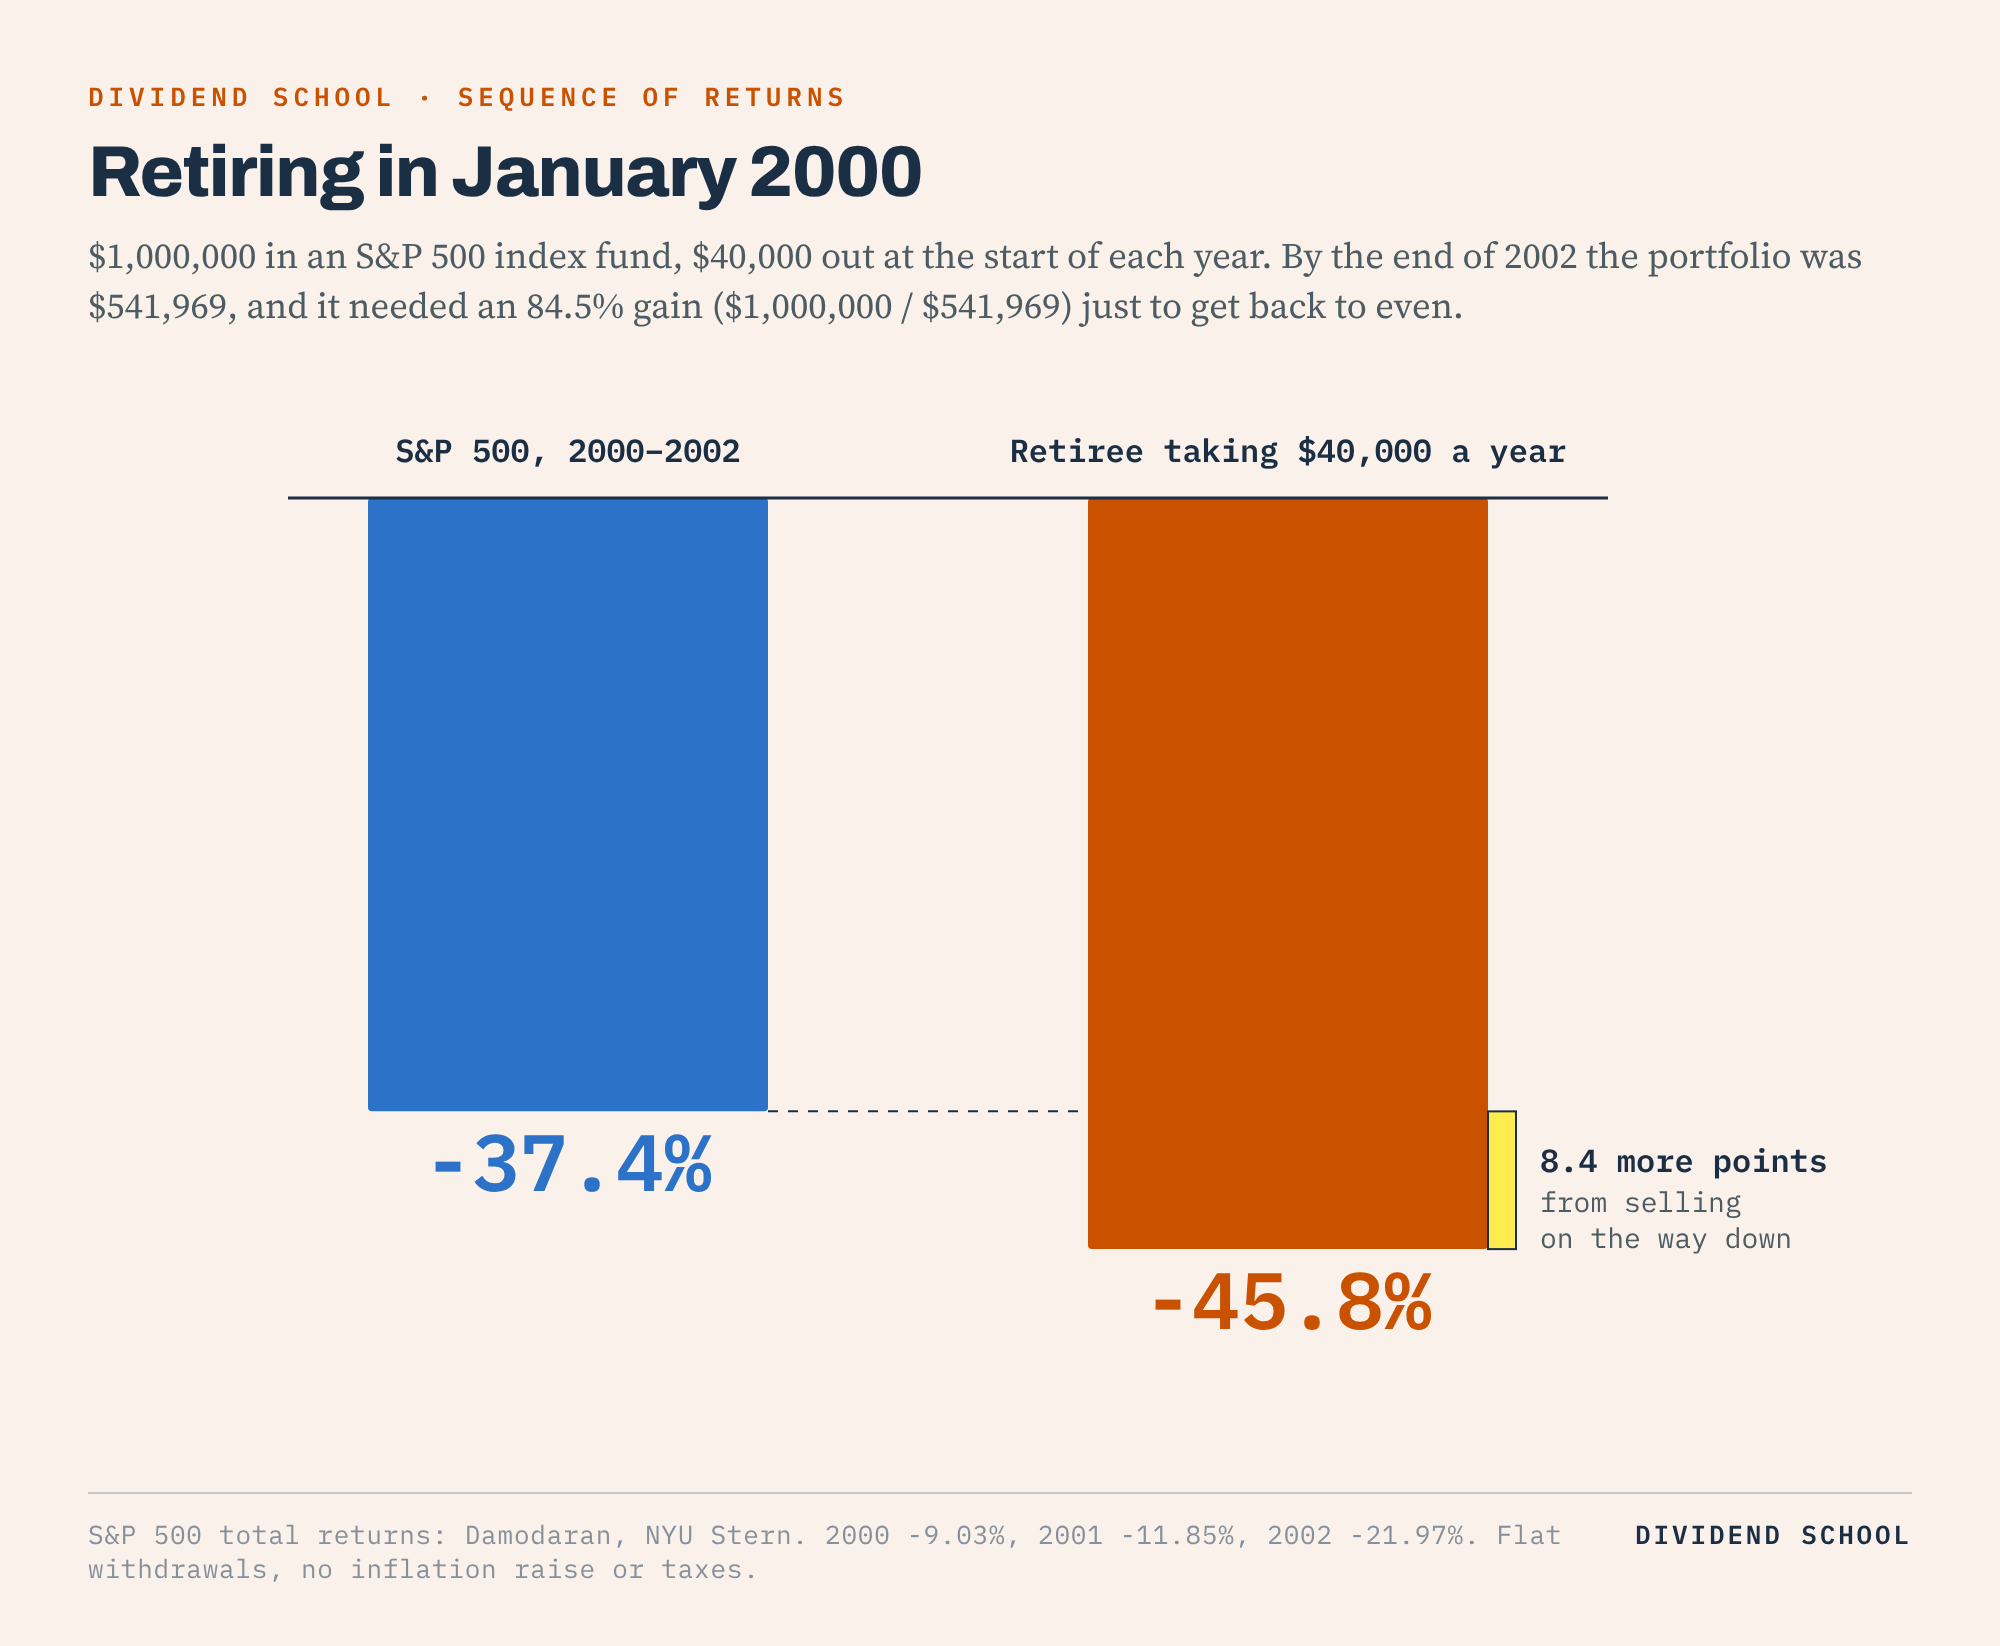
The market fell 37.4%, and the retiree fell 45.8%. The extra 8.4 points came from selling shares on the way down. From $541,969, the portfolio needed an 84.5% gain just to get back to where it started, while still paying out $40,000 a year.
And 2008 was waiting five years down the road.
The Danger Zone Around Retirement Day
So when does this risk bite hardest?
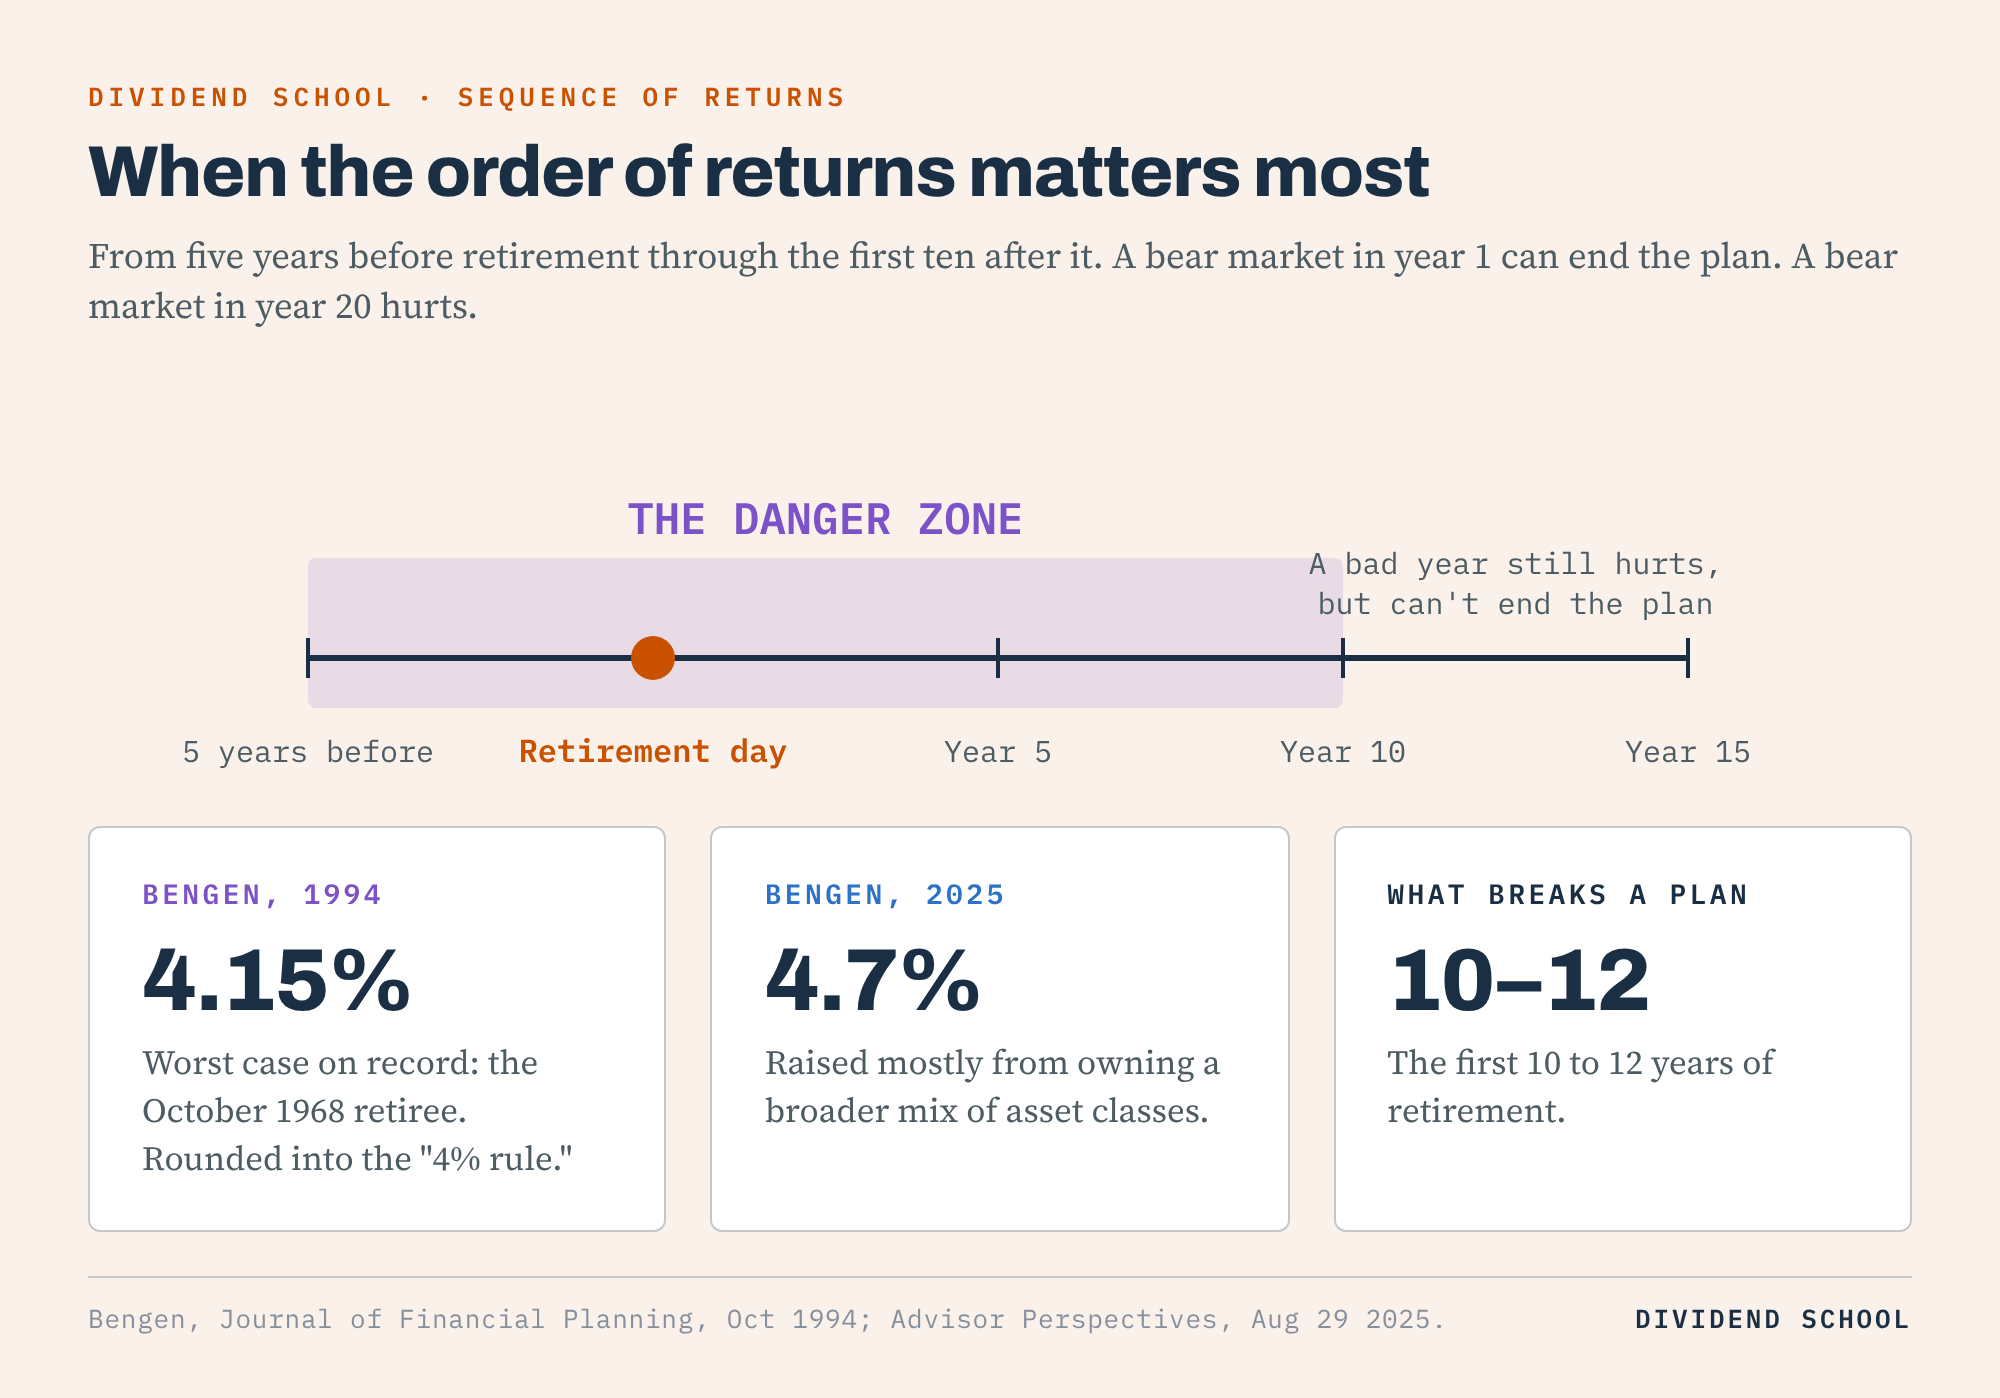
Bill Bengen, the financial planner behind the 4% rule, published his original study in the Journal of Financial Planning in October 1994. He tested historical 30-year retirements to find the highest starting withdrawal that never ran out. The worst case on record belonged to someone who retired in October 1968, right before a decade of poor markets and high inflation.
That retiree set the floor at 4.15%, which got rounded into the “4% rule.” In 2025, Bengen raised his number to 4.7%, mostly from owning a broader mix of asset classes.
His point about timing hasn’t changed: what breaks a retirement plan is what happens in the first 10 to 12 years.
A bear market in year 20 of retirement hurts. A bear market in year 1 can end the plan.
That gives us a window to prepare for: the five years before retirement through the first ten after it. The closer we are to the middle of that window, the more the order of returns matters and the less the long-term average helps us.
How to Set Up a Portfolio for It
We can’t control the order of returns. My crystal ball is quite cloudy, same as everyone’s.
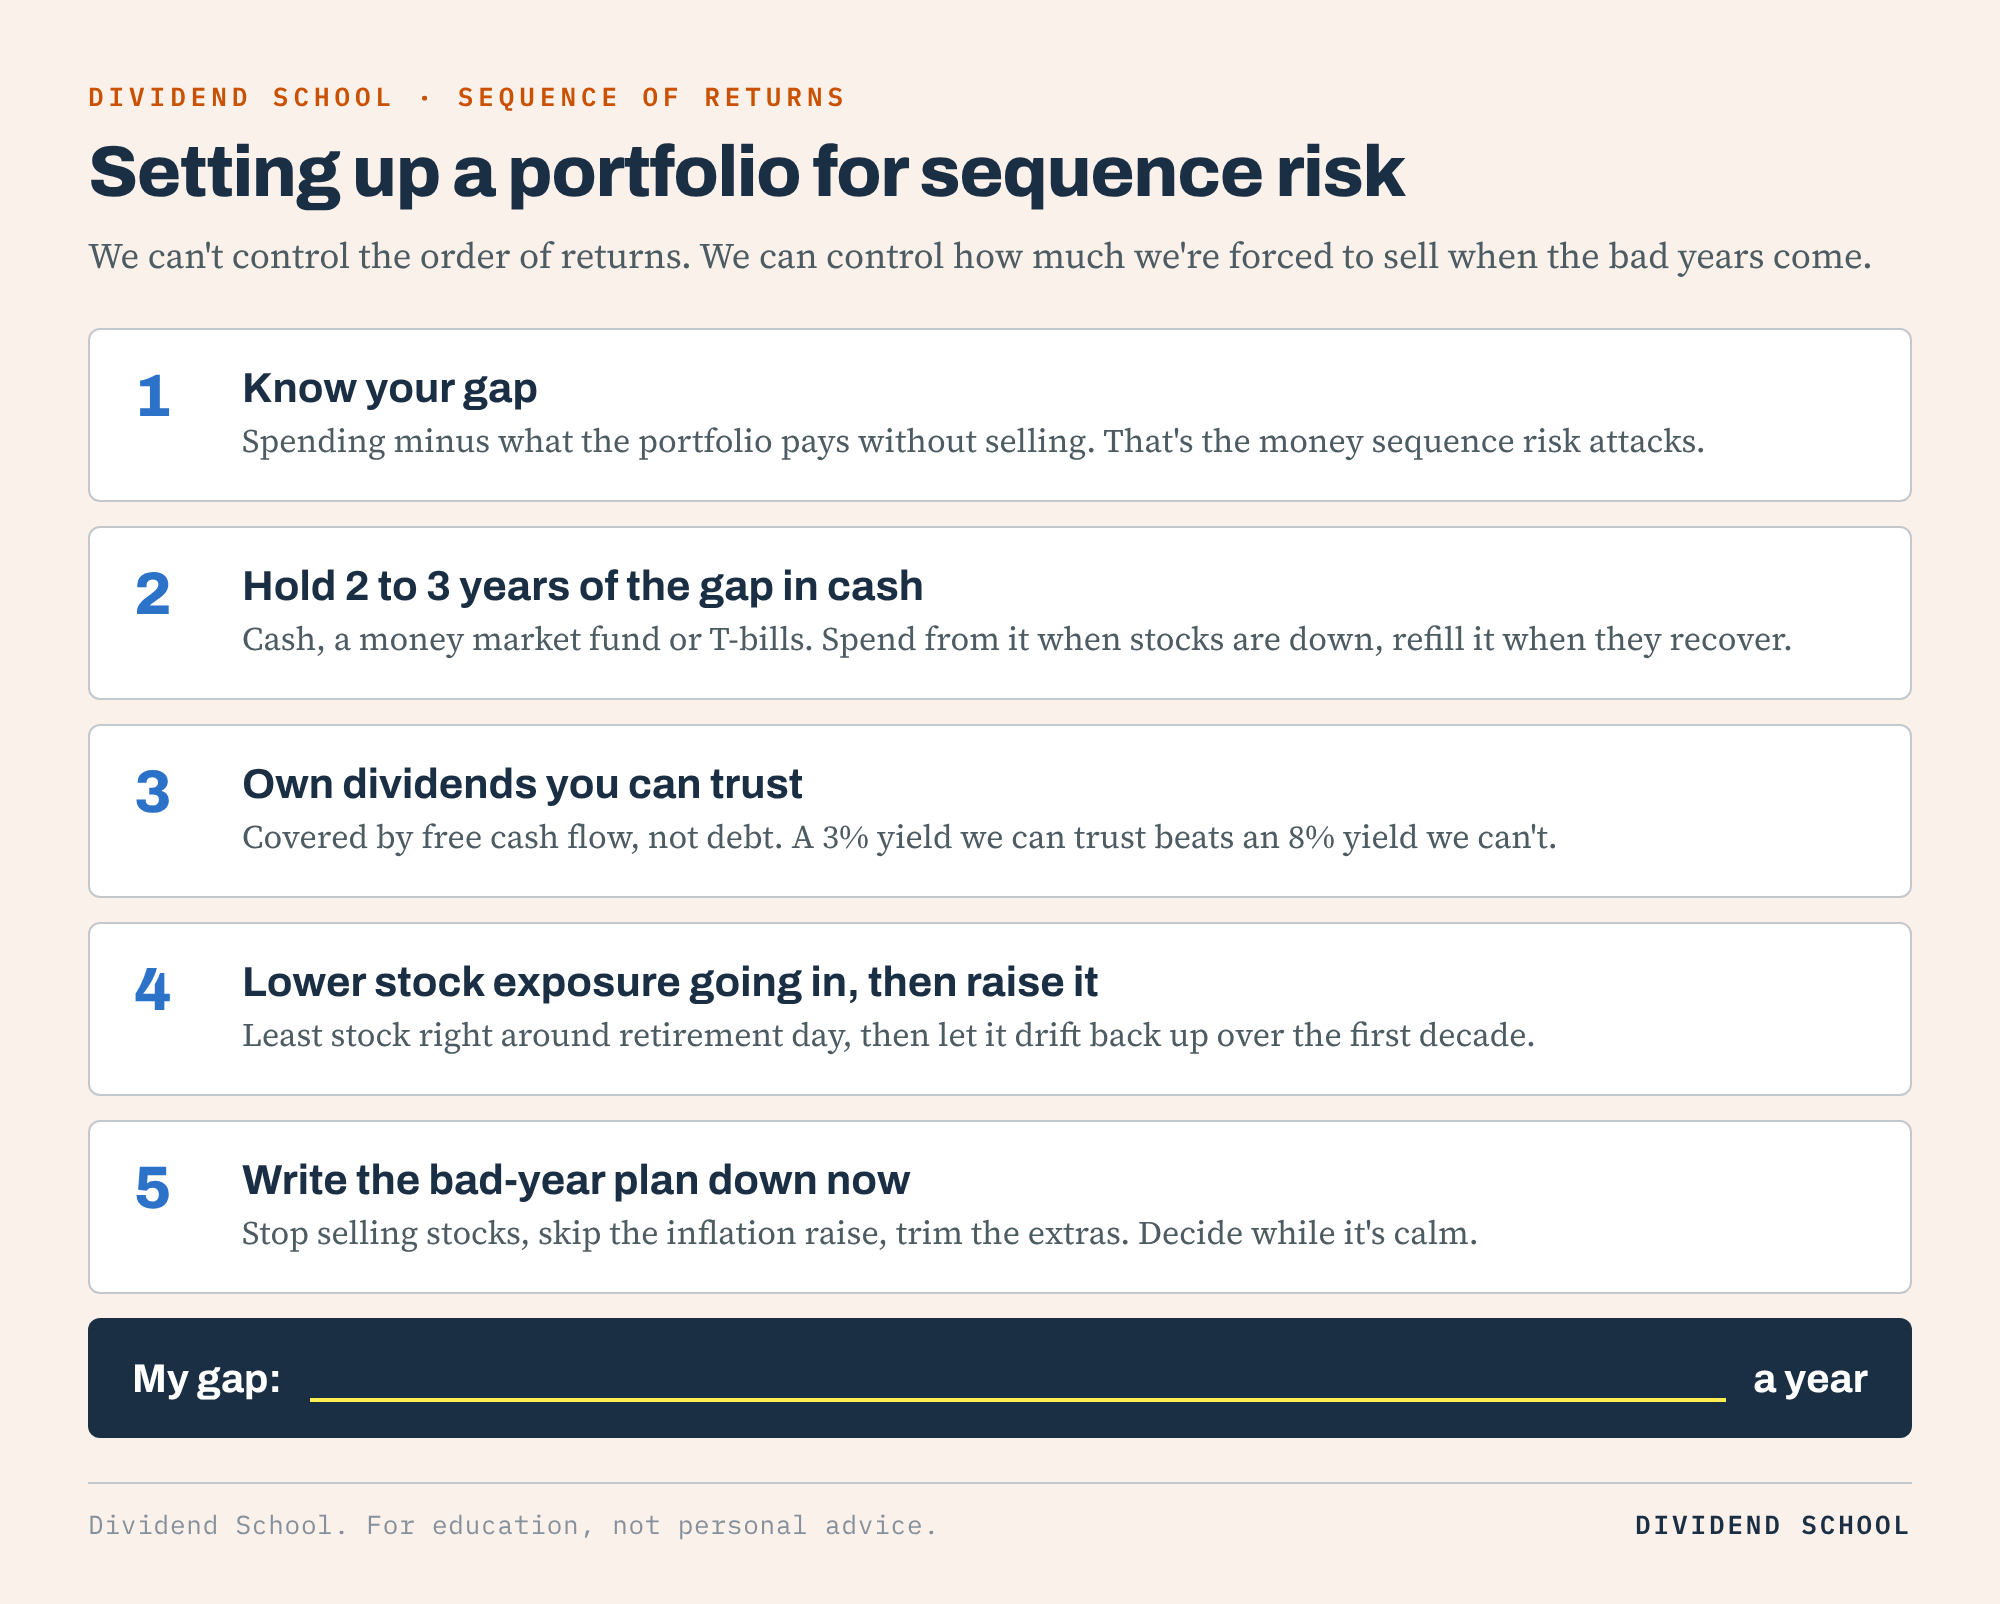
What we can control is how much we’re forced to sell when the bad years come.
Five pieces to it:
Know Your Gap
Hold Two to Three Years of the Gap in Cash
Own Dividends You Can Trust
Lower Stock Exposure Going In, Then Raise It
Write the Bad-Year Plan Down Now
Know Your Gap
The gap is what we spend each year minus what the portfolio pays us without selling anything.
Using our $1,000,000 retiree who needs $50,000 a year:
Spending: $50,000
Dividends at a 3% portfolio yield: $30,000 ($1,000,000 x 0.03)
Gap: $20,000
Why does this number matter so much?
That $20,000 is the only money that has to come from selling shares. It’s also the number that sequence risk attacks. The smaller the gap, the less we’re forced to sell at the bottom.
This is where dividend investors have a real edge. A dividend shows up in our account whether the stock price is up 20% or down 30%. We don’t have to sell a share to collect it.
Hold Two to Three Years of the Gap in Cash
Three years of a $20,000 gap is $60,000. Park it in cash, a money market fund, or Treasury bills.
When the market drops, we stop selling stocks and spend from the cash instead. When the market recovers, we refill it from gains.
Why cash and not bonds?
Bonds usually help in a stock crash. In 2008, the S&P 500 lost 36.55% while 10-year Treasuries gained 20.10%. But 2022 broke the pattern; the S&P 500 lost 18.04% and 10-year Treasuries lost 17.83%. T-bills gained 2.09% that year. For the money we know we’ll spend in the next few years, cash is the safer home.
Own Dividends You Can Trust
Dividends get cut in bad markets too, and that’s the big caveat for anyone planning to live on them.
In 2008, the S&P 500’s price fell 38. S&P 500 dividends per share went from $28.05 in 2008 to $22.31 in 2009, a 20.5% drop.
So income held up far better than the price, but it still fell.
What does a cut like that do to our retiree?
Dividends after a 20.5% cut: $23,850
New gap: $26,150
Years of cash cushion: 2.3
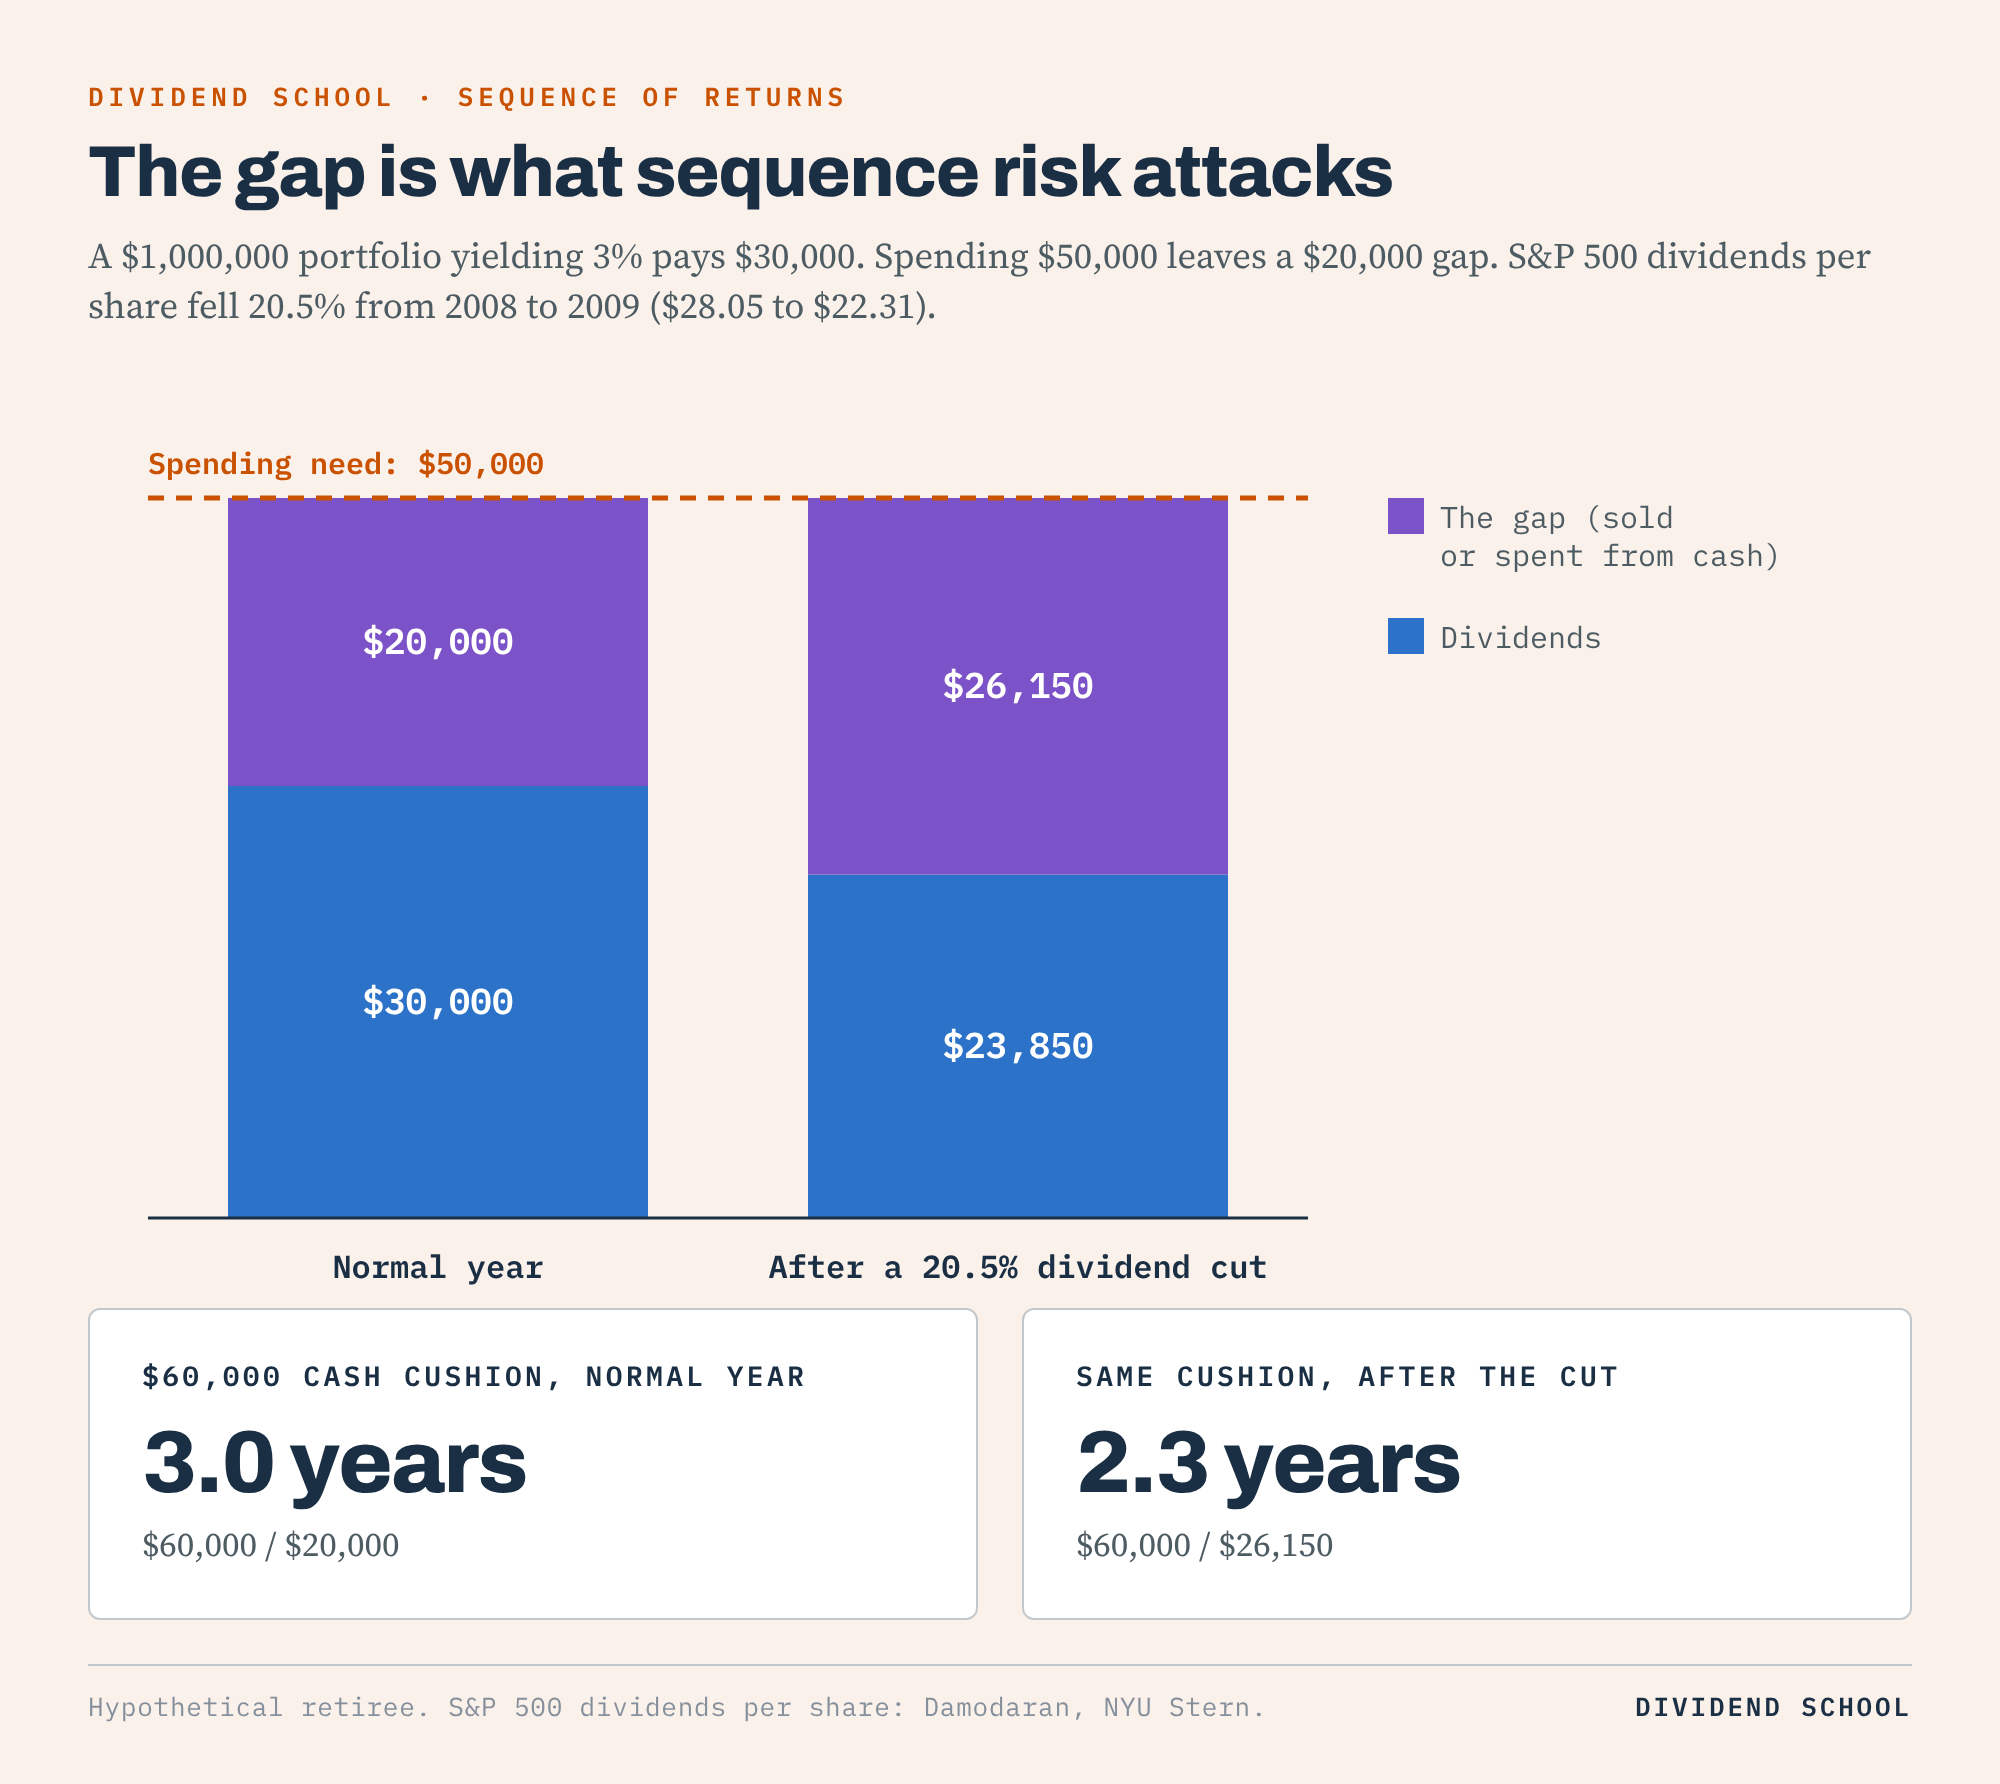
Still covered, but thinner. And that’s an index-wide cut. A portfolio full of 8% yielders with stretched payout ratios can lose far more than 20% of its income in one bad year.
This is why dividend safety matters more in retirement than at any other point. The Dividend Safety Scorecard and the 4-Layer Filter are built for exactly this job: making sure the income we’re counting on is covered by real free cash flow, not debt.
I’ll take a 3% yield I can trust over an 8% yield I can’t.
Lower Stock Exposure Going In, Then Raise It
Most advice says to own fewer stocks as we age and keep dialing it down. Wade Pfau and Michael Kitces tested a different idea in a January 2014 paper in the Journal of Financial Planning, and it fits sequence risk like a glove.
The idea is to hold the least stock right around retirement day, when a crash does the most damage, then let the stock allocation drift back up over the first decade of retirement. Some people call it a bond tent; the safe money builds up before retirement and gets spent down after.
Why flip the usual advice?
If the first few years are where the plan breaks, that’s where we want the most protection. Once we’re ten years in and past the danger zone, we can afford to own more stock again.
Write the Bad-Year Plan Down Now
This one is the most personal to me. Writing the plan down before I need it is one of the habits that has helped me most as an investor, and retirement is where it pays off biggest.
What does that look like?
Decide today, in writing, what happens when the market drops 25%:
We stop selling stocks and spend from the cash bucket
We skip the inflation raise on withdrawals that year
We trim spending on the extras (travel, the new car) until the cash is refilled
Nobody makes good decisions while watching a portfolio fall 30%. Decide when it’s calm, then follow the plan when it isn’t.
Common Mistakes to Avoid
What trips people up most often?
Planning on the average. A 7% average return means nothing if the first three years are -9.03%, -11.85%, and -21.97%. Run the bad sequence before signing off on any plan.
Reaching for yield to close the gap. It’s tempting to swap into 9% yielders so the dividends cover all $50,000. That’s how a retiree ends up owning the stocks most likely to cut in a recession, which is the exact moment the income needs to hold.
Treating bonds as automatic protection. 2022 showed us otherwise. Hold the near-term spending money in cash or T-bills.
Selling everything after a crash. Going to cash at the bottom locks in sequence risk permanently. The cash bucket exists so we never have to make that choice.
Waiting until retirement day to set this up. The danger zone starts five years out. Building a cash bucket and trimming a reach-for-yield portfolio is a lot easier in a calm market than in the middle of a bad one.
The Takeaway
The order of our returns doesn’t matter while we’re saving, and it matters more than anything else once we start withdrawing. Shrink the gap with dividends we can trust, keep two to three years of that gap in cash, and write the bad-year plan down before we need it.
Help me pick what I build next
I have five ideas and time to build one of them well. Which one would we use?
Click the one you want. One click is one vote:
Skill Sprints: 30-minute lessons on checking a dividend stock yourself
The Forever Five: the five dividend stocks I’d hold if I could never sell
The 2027 Raise Calendar: when every Universe stock usually raises its dividend, and by how much
The Infographic Book: my best dividend charts, all in one ebook
Dividend wallpapers: phone and desktop backgrounds made from the infographics
I’ll share the results by the end of October, and the winner gets built first. Majority rules on this one.
If you already check payout ratios and free cash flow coverage on everything you own, you don’t need this newsletter.
If you’re getting close to retirement and want that work done on the dividend payers you’re counting on, that’s what Dividend School Pro does. Every name in our Universe carries a safety score, a Buy Below price, and the cash flow math behind both, updated as companies report.
Seven days free.
If you have any questions or would like me to cover something in particular, please don’t hesitate to reach out.
Until next time, take care and be safe out there,
Dave
Order of returns mattering more than the average, I'm with you there.