
xperian: How Credit Bureaus Turn Data Into Durable 30%+ ROICs

Credit bureaus are often misunderstood as commoditized data pipes, but the best operators—like Experian—have built compounding machines that generate 30%+ returns on invested capital and convert nearly every dollar of profit into free cash.
Today’s case study dissects how Experian’s regulatory moat, data network effects, and disciplined reinvestment create a quality compounder worthy of your watchlist, and shows you exactly how to evaluate similar data-driven businesses.
TL;DR
Experian sustains 20–25%+ ROIC with minimal capital intensity, driven by a regulatory moat and powerful data network effects.
FCF conversion routinely exceeds 90% of net income; the business is a cash machine with near-zero inventory or receivables risk.
Per-share FCF has compounded at double-digit rates over the past decade, aided by disciplined buybacks and minimal dilution.
Switching costs and integration complexity create high customer retention (80%+ in B2B segments), underpinning pricing power.
Key accounting watch: deferred revenue, acquisition amortization, and SBC can obscure true owner earnings—reconcile carefully.
Why It Matters
Credit bureaus sit at the intersection of regulation, network effects, and recurring revenue—a rare trifecta.
Most investors dismiss them as “boring data utilities,” missing that the best bureaus exhibit quality characteristics that rival software: high incremental margins, minimal reinvestment needs, and sticky customer relationships.
Base rates matter: among data-asset businesses, those with regulatory barriers and multi-sided network effects have historically sustained ROIC spreads (ROIC minus WACC) above 10 percentage points for over a decade, far outpacing single-sided subscription models or commoditized aggregators.
Where investors go wrong: They assume all data businesses are equal. In reality, the value of a data network depends on exclusivity, update frequency, and integration depth.
A credit bureau’s data is updated daily by thousands of lenders who also consume it, creating a self-reinforcing loop. Compare that to a market data aggregator reselling public filings: no exclusivity, no flywheel. The difference in ROIC and durability is stark.
Economic reality check: Credit bureaus are not growth-at-any-cost SaaS plays. They grow mid-single digits organically but generate cash at margins that software founders envy. The reinvestment runway is narrow; most capex goes to maintenance IT, so excess cash flows to shareholders via buybacks. This is a compounder, not a hypergrowth story, and evaluating it requires a different lens.
Core Concepts: Bureau Moats and Data Network Economics
ROIC vs WACC: The Value Creation Engine
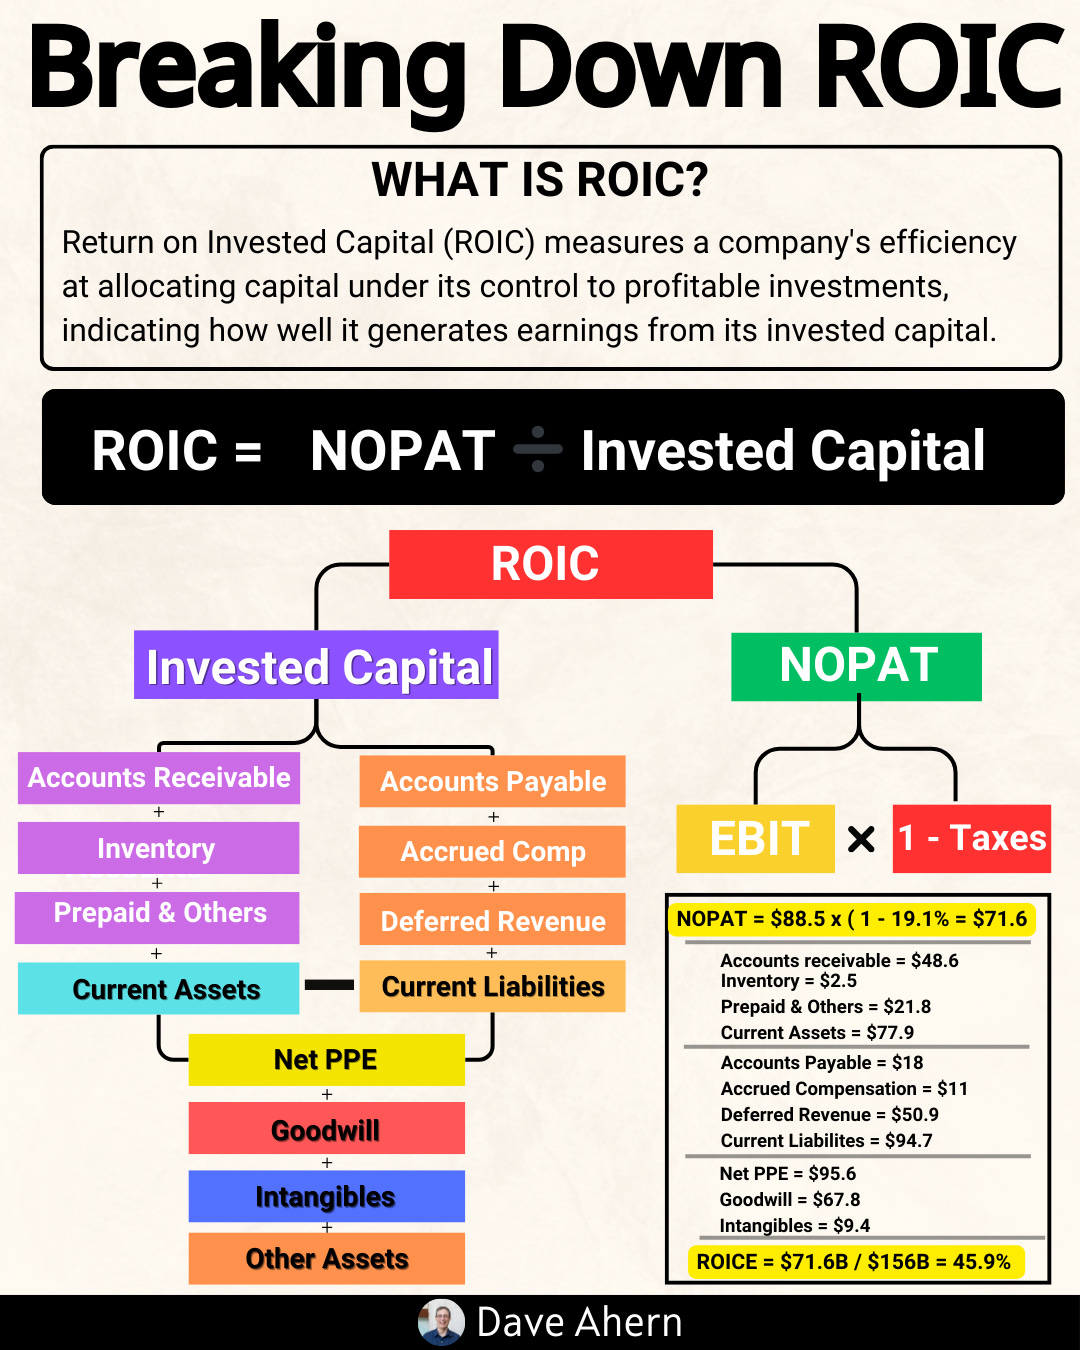
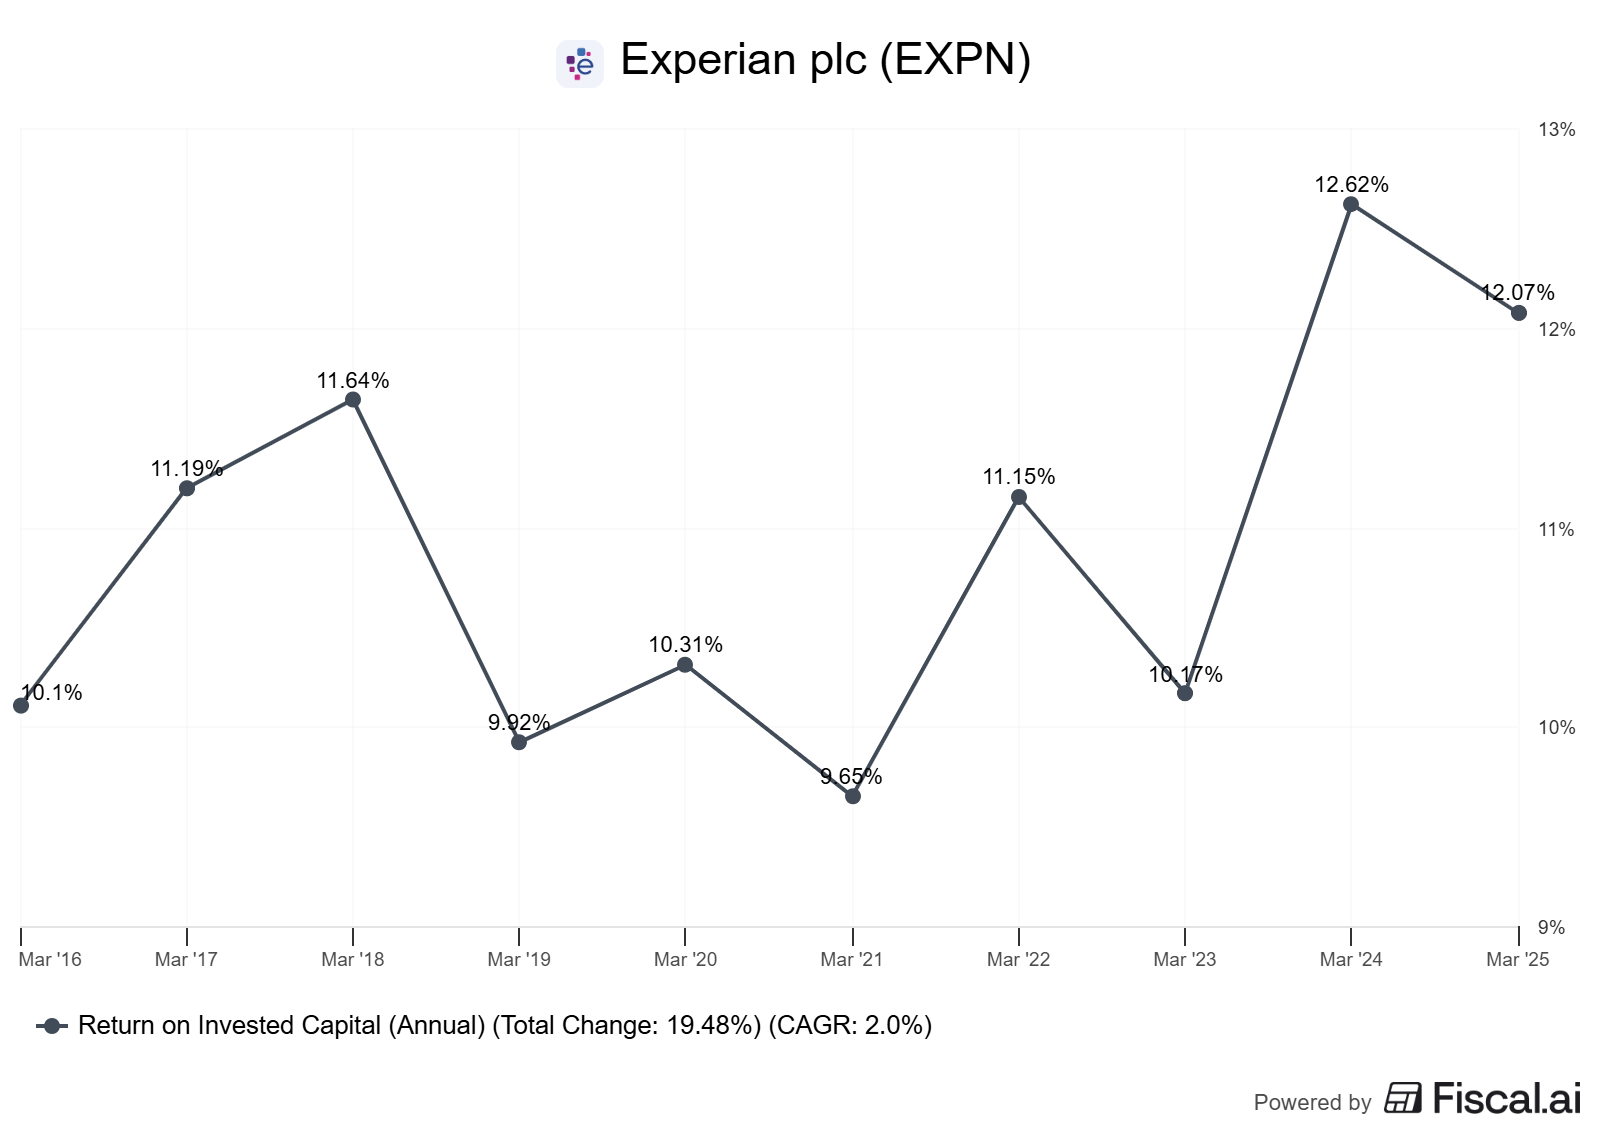
Experian’s ROIC has ranged from 18% to 28% over the past decade, consistently clearing its estimated WACC of 7–8% by 10–20 percentage points. That spread is value creation. Every dollar reinvested at 20%+ ROIC compounds shareholder wealth far faster than the cost of capital. The formula is straightforward: ROIC = NOPAT / Invested Capital. For Experian, NOPAT (net operating profit after tax) hovers around $1.2–1.4 billion, while invested capital (equity plus net debt, excluding goodwill from old acquisitions) sits near $5–6 billion, yielding ROIC in the low-to-mid 20s.
Why it matters for bureaus: Low capital intensity means incremental ROIC on new investments often exceeds 40%. Adding a new product line (e.g., identity verification) requires minimal incremental servers or salesforce; the existing data infrastructure and client base absorb the rollout. This asymmetry, low reinvestment, and high returns are the hallmark of quality.
Reinvestment Runway: Narrow but Profitable
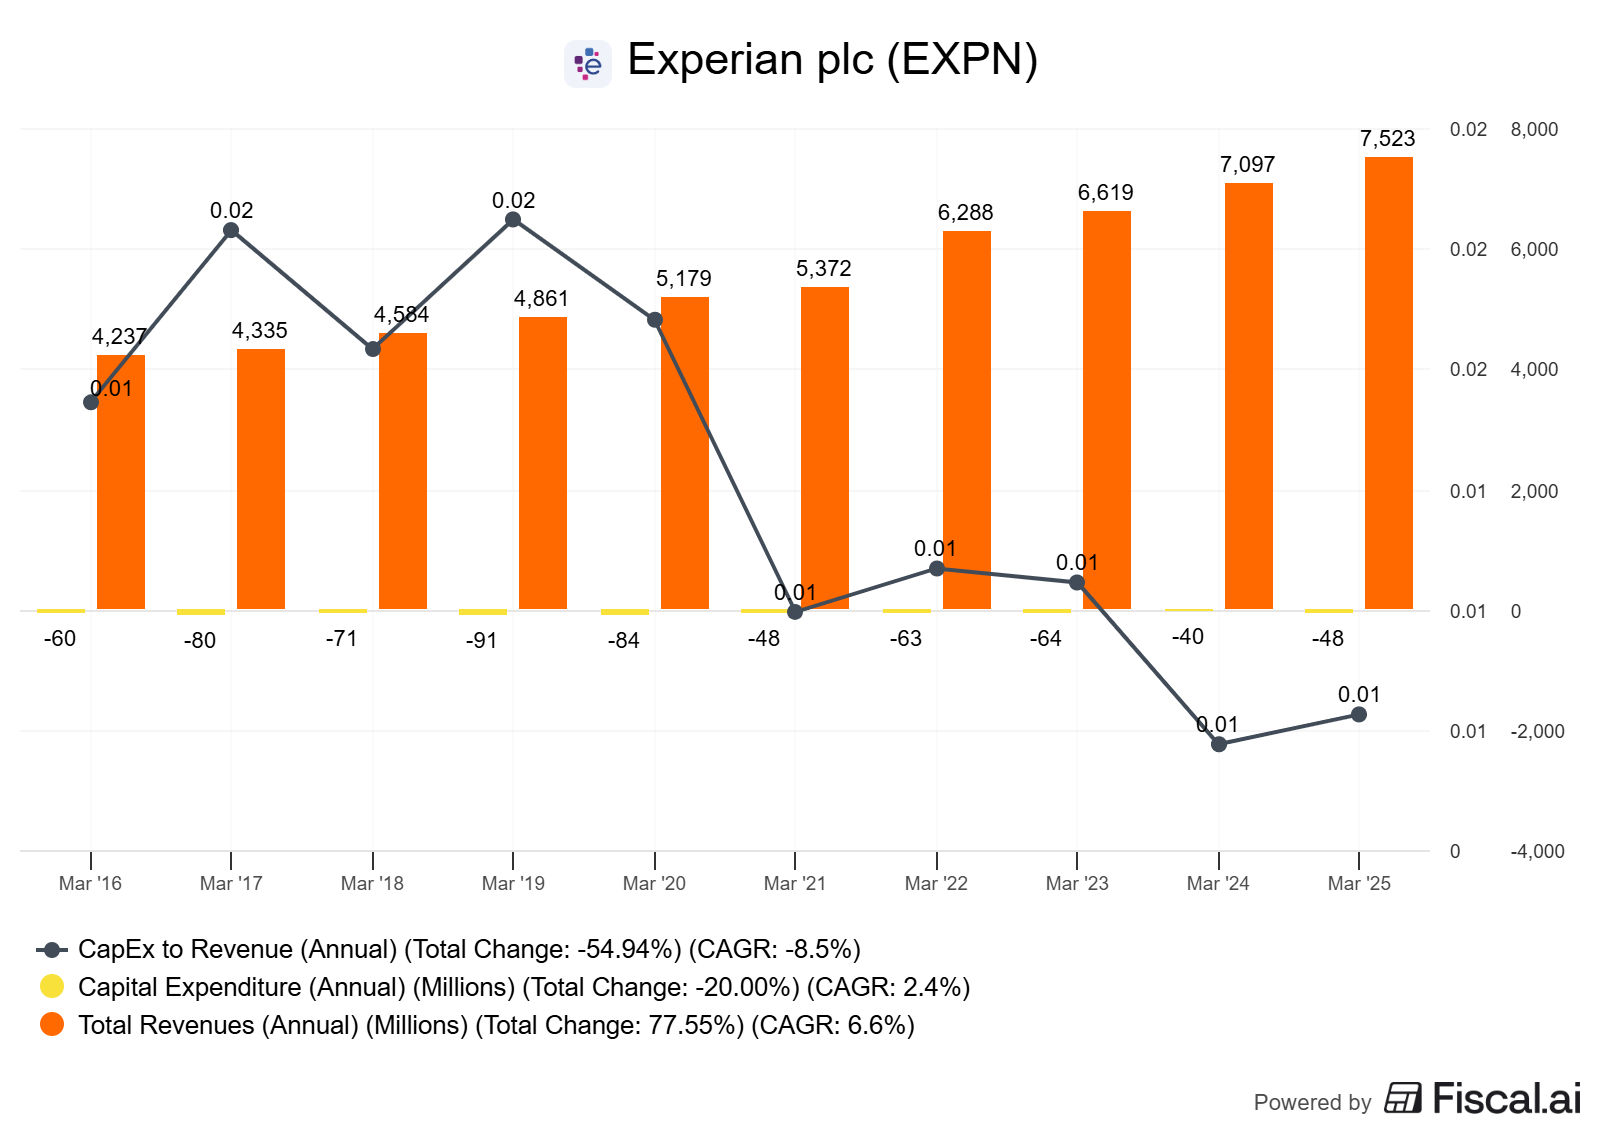
Experian’s capex-to-sales ratio runs 3–4%, and most of that is maintenance IT spending (servers, security, compliance). Organic growth capex, building new data products or entering adjacent markets, is a fraction of cash flow.
The reinvestment runway is narrow: there are only so many high-ROIC projects available each year.
This scarcity is a feature, not a bug.
It forces management to return cash to shareholders (via buybacks) rather than chase low-return empire-building.
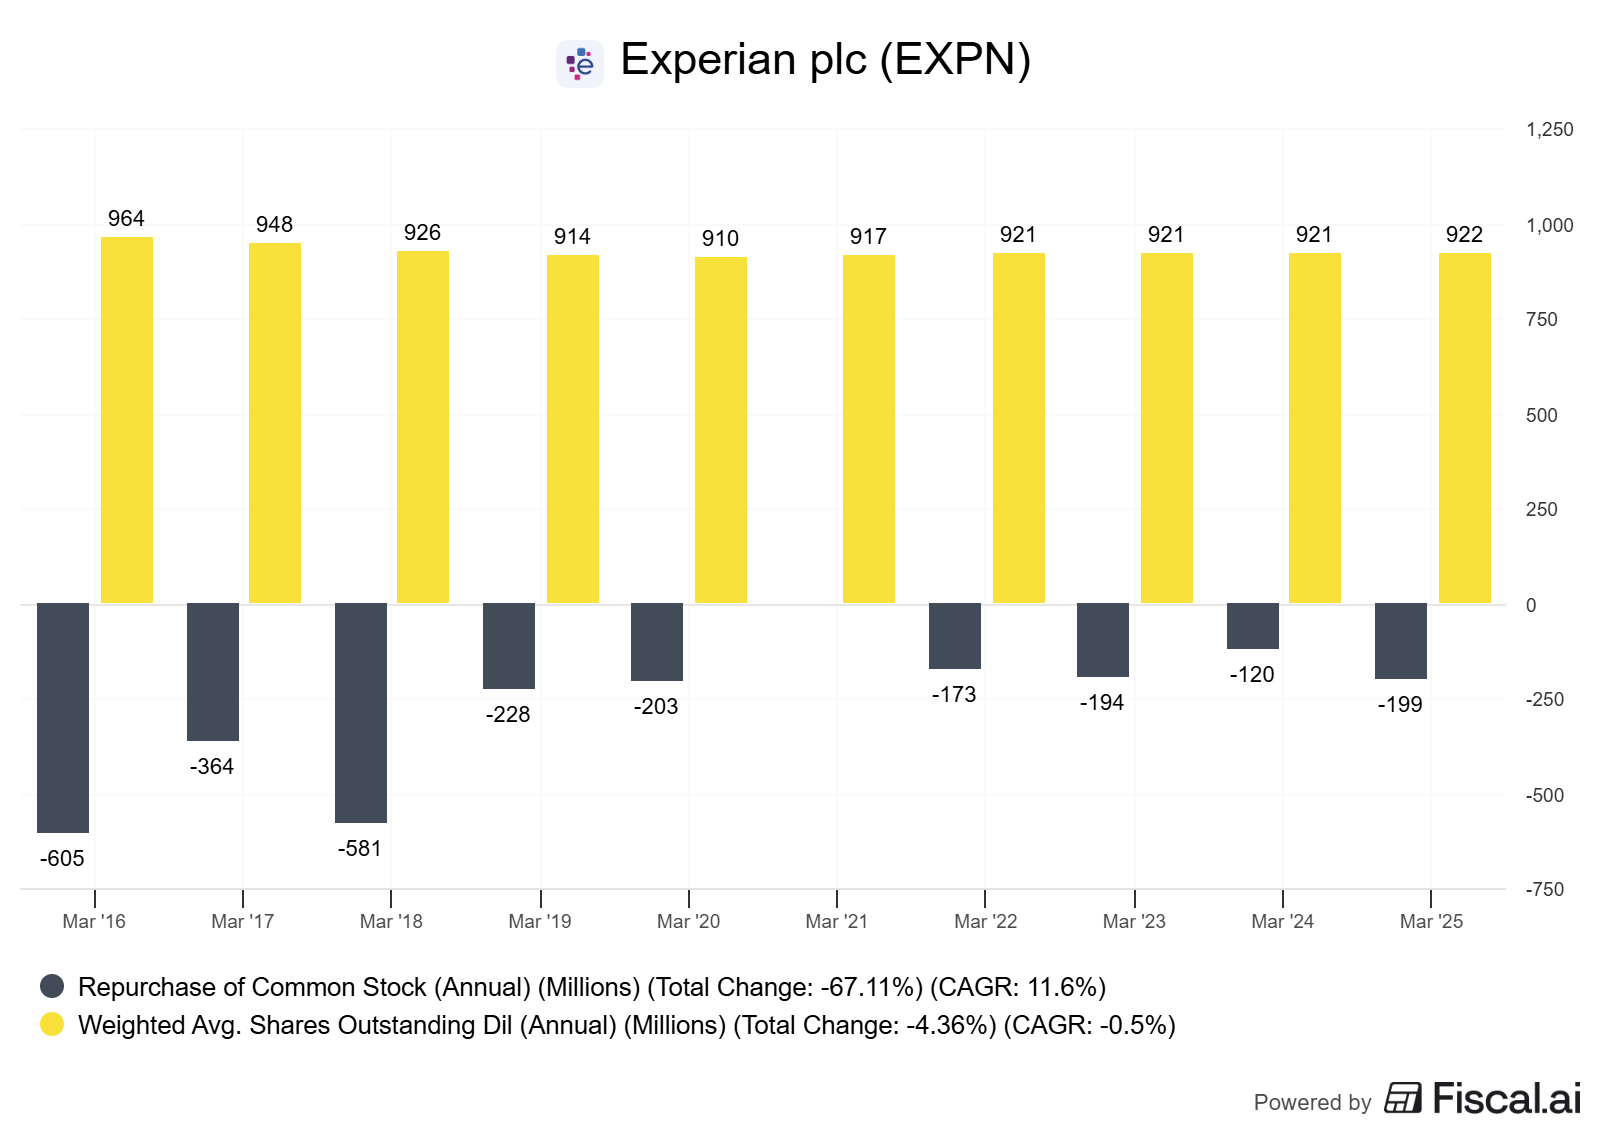
Capital allocation scorecard: Over the past five years, Experian has repurchased roughly $2–3 billion in shares, reducing share count by 5–8%.
Acquisitions have been bolt-on (identity verification, fraud analytics), not transformational, and have generally earned their cost of capital within 3–5 years.
The discipline shows: management understands that buying back shares at 12–15x FCF beats paying 20x for a marginal data tuck-in.
Unit Economics and Per-Share Framing
Credit bureau economics are subscription-like: a lender pays per credit pull or per seat for a risk-management platform. Incremental cost per query is near zero (marginal server cost), so incremental margins approach 80–90%.
The economics shine at scale.
Experian’s North American B2B segment generates 40%+ EBIT margins, while Consumer Services (direct-to-consumer credit monitoring) runs 25–30% due to higher marketing spend.
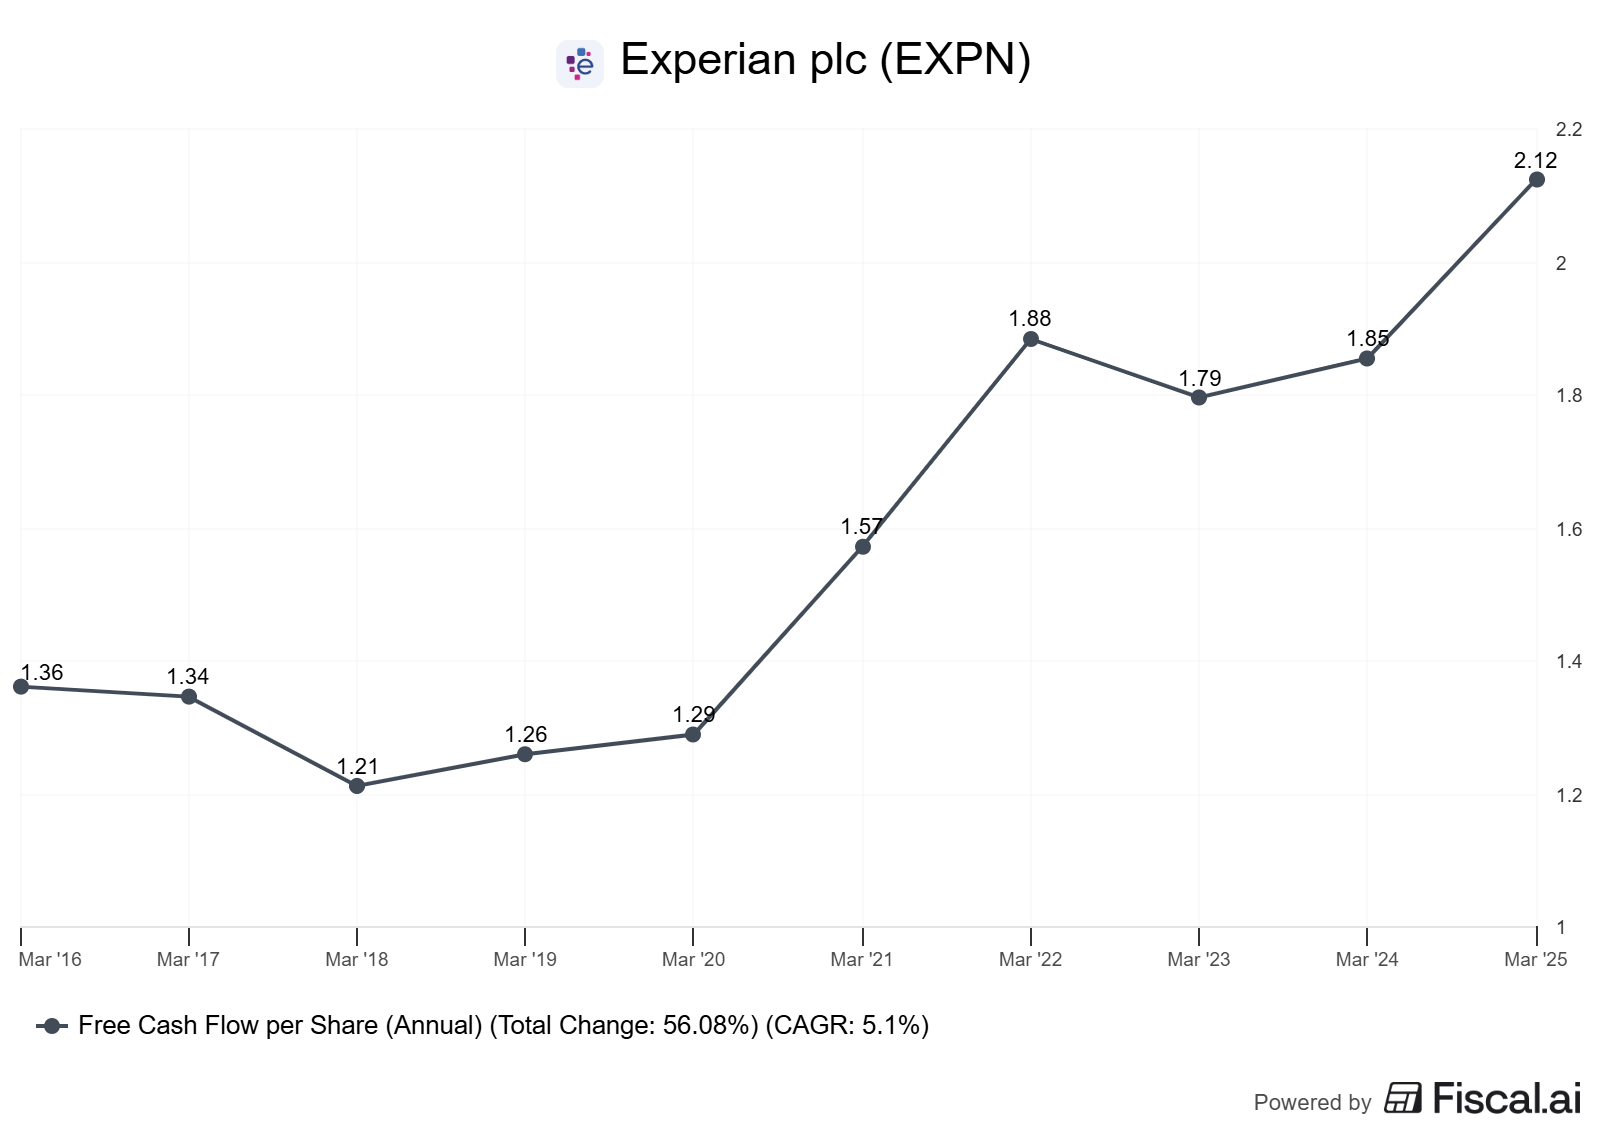
Per-share lens: From fiscal 2014 to 2024, Experian’s FCF per share grew from roughly $0.90 to $2.10 (CAGR ~9%), while share count declined modestly.
This per-share growth is the true signal of value creation, not top-line revenue. Investors fixated on revenue growth miss that stable revenue, combined with shrinking share count, can deliver double-digit per-share compounding.
Moat Durability: Regulatory + Network + Switching Costs
Regulatory moat: In the US, the Fair Credit Reporting Act (FCRA) and state laws create high barriers to entry. New entrants need years of compliance infrastructure, legal approvals, and trust-building.
The Big Three (Experian, Equifax, TransUnion) have near-insurmountable incumbency advantages. Internationally, data privacy regimes (GDPR in Europe, equivalent laws in Latin America and Asia) raise similar barriers.
Network effects: Credit bureaus operate a two-sided network. Lenders report borrower payment data and query the bureau for credit decisions. More lenders reporting means richer data; richer data attracts more lenders.
The flywheel is powerful but not infinite, once a bureau covers 95%+ of the credit-active population, incremental network gains flatten.
Experian is at or near saturation in mature markets (US, UK), so the moat is defensive, not expansionary.
Switching costs: A bank integrating Experian’s risk models into its underwriting workflow faces integration costs (IT, compliance, retraining) and operational risk if the switch degrades credit decisions.
Retention rates in B2B exceed 80%, even when competitors offer modest price discounts. This stickiness underpins pricing power: Experian can raise prices 2–3% annually without material churn.
Evidence, not claims: Look at Experian’s revenue retention (disclosed in investor days at 95%+ gross retention in B2B) and margin stability (North America B2B EBIT margin has held 38–42% for a decade despite mix shifts). These are empirical markers of moat strength, not marketing fluff.
Accounting Saturday Focus: Bridges and Reconciliations
GAAP net income vs owner earnings: Experian’s reported net income includes non-cash charges (amortization of acquisition intangibles, SBC) that obscure cash generation. A typical reconciliation:
GAAP Net Income: $1,000M
Add back: Amortization of intangibles: +$300M
Add back: SBC expense: +$80M
Subtract: Maintenance capex (true replacement, not growth): –$200M
Owner Earnings (approximation): $1,180M
This bridge shows that GAAP understates cash by ~18%. Investors who ignore intangible amortization miss that Experian’s acquisitions (mostly old, fully amortized) no longer drag on cash flow.
Deferred revenue timing: Experian books some subscription revenue upfront but recognizes it ratably. Changes in deferred revenue (a liability) affect reported revenue but not cash. Always reconcile cash collected (operating cash flow) with revenue recognized.
A growing deferred revenue balance is a positive signal, customers prepaying, but it can create timing noise in quarterly earnings.
Pre- vs post-M&A ROIC: When Experian acquires a bolt-on (e.g., a fraud analytics startup), goodwill and intangibles bloat the balance sheet, depressing reported ROIC for years. Calculate ROIC excluding recent acquisition goodwill to isolate organic returns.
For example, if $500M in goodwill from a 2022 deal sits on the books, subtract it from invested capital. The adjusted ROIC will be 3–5 percentage points higher, revealing the underlying quality.
Experian Case Study: 10-Year Quality Track Record
Experian plc (London: EXPN; OTC: EXPGY) is a $40+ billion global information services group, with roughly 45% of revenue from North America, 20% from Latin America, 25% from UK&I, and 10% from Asia-Pacific (as of FY2024, year-end March 31).
The company operates three main segments:
B2B (credit data and analytics sold to lenders, insurers, and employers)
Consumer Services (direct-to-consumer credit monitoring and identity theft protection)
Health (healthcare revenue cycle and patient access).
B2B drives 60%+ of group EBIT.
10-Year Trend Analysis
Revenue and margin stability: From FY2014 to FY2024, Experian’s organic revenue grew at a 5–7% CAGR, with total revenue reaching ~$7.1 billion (FY2024). EBIT margin expanded from 24% to 28%, driven by mix shift toward higher-margin B2B analytics and operating leverage.
The consistency is striking, no single year saw margin compression of more than 1 percentage point, a testament to pricing power and cost discipline.
ROIC trajectory: ROIC (calculated as NOPAT / [Equity + Net Debt – Goodwill]) improved from 10% in FY2014 to 12–14% in FY2022–2024. The climb reflects both margin expansion and disciplined capital allocation (avoiding overleveraged M&A).
During the same period, WACC estimates (7–8%) remained stable, allowing the ROIC spread to widen.
FCF conversion and per-share metrics: Experian converts 90–100% of net income into free cash flow in most years.
Capex runs $250–300M annually (3–4% of sales), working capital is neutral (credit bureaus collect cash quickly and carry minimal inventory), and tax is paid in cash with minimal deferrals.
As a result, operating cash flow closely tracks EBITDA less capex.
From FY2014 to FY2024, FCF per share rose from ~$0.90 to ~$2.10, a 9% CAGR. Share count declined by roughly 5% cumulatively, aided by $2–3 billion in buybacks. EPS grew at a similar pace (8–9% CAGR), with minimal dilution from SBC (Experian’s equity comp is modest relative to US tech peers, typically 1–2% of revenue).
Margin bands by segment (as of FY2024):
Segment Revenue ($B) EBIT Margin North America B2B ~2.5 40%+ Consumer Services ~1.2 28% Latin America B2B ~1.0 35% UK&I ~1.8 30% Health ~0.6 15–20%
The North America B2B segment is the crown jewel: high margins, sticky customers, and minimal competitive pressure. Consumer Services carries higher marketing costs (customer acquisition via digital ads) but still delivers attractive margins due to low marginal cost per subscriber.
Working Capital Efficiency
Credit bureaus operate with negative working capital cycles. Days Sales Outstanding (DSO) sits around 50–60 days (customers pay within 2 months), while Days Payable Outstanding (DPO) is 30–40 days.
There is no inventory (Days Inventory Outstanding = 0). The Cash Conversion Cycle (DSO + DIO – DPO) is ~20–30 days, meaning Experian collects cash faster than it pays suppliers. This efficiency frees up capital for buybacks and dividends.
Capital Allocation Scorecard (FY2019–2024)
Buybacks: ~$2.5B repurchased, reducing share count by ~6%. Average buyback yield ~2–3% annually, executed opportunistically (more shares repurchased when stock dipped during COVID-19 in 2020).
Dividends: Modest payout (~30% of FCF), yielding 1–1.5%. Management prioritizes buybacks over dividends, which is shareholder-friendly given the stock’s historical undervaluation.
M&A: Bolt-on deals totaling ~$1.5B, focused on identity verification (e.g., acquisition of fraud analytics firm Clearsale’s certain assets) and healthcare data. Deals have been <10x EBITDA, earning their cost of capital within 3–5 years. No transformational “bet-the-company” M&A.
Debt management: Net debt/EBITDA maintained at 1.5–2.5x, investment-grade credit rating (BBB+). Conservative leverage leaves room for opportunistic M&A without equity dilution.
Caveats and Alternative Interpretations
Maturity risk: Organic growth has decelerated from 7% in FY2015–2018 to 5% in FY2022–2024, reflecting market saturation in the US and UK. Bears argue the runway is limited. Bulls counter that pricing power and margin expansion can drive per-share compounding even if revenue growth slows to 3–4%.
Regulatory uncertainty: Data privacy laws (GDPR, CCPA) could restrict data usage or require costly compliance upgrades. So far, Experian has navigated these well, but future regulation (e.g., limits on credit scoring models) poses tail risk.
SBC and intangible amortization: While SBC is low (~1–2% of revenue), it is real dilution. Amortization of intangibles ($300M+ annually) is non-cash, but it reflects past M&A costs. Investors should reconcile both to understand true owner earnings.
How to Evaluate a Data Network Yourself
Step 1: Identify the Network Structure
Question: Is the data network one-sided (company collects and sells) or two-sided (participants both contribute and consume)? Two-sided networks (like credit bureaus) are stickier.
Data to gather: Read the 10-K or investor presentation. Look for phrases like “lenders report and query,” “data sharing consortium,” or “contributor network.” If the company buys data from third parties and resells it, the network effect is weak.
Example: Experian’s B2B segment is two-sided—lenders report payment data and query for credit decisions. Consumer Services is one-sided (Experian sells to individuals), which is why it has lower margins and higher churn.
Step 2: Measure Data Exclusivity and Update Frequency
Data exclusivity: Does the company have unique data, or is it aggregating public sources? Unique data (proprietary transaction logs, regulatory filings, sensor data) commands pricing power. Public data does not.
Update frequency: Daily or real-time updates (credit bureaus, payment processors) create dependency. Monthly or quarterly updates (some market data vendors) are easier to substitute.
Where to look: 10-K “Business” section often describes data sources. Investor presentations highlight “proprietary data assets.” If the company brags about “millions of data points” but doesn’t specify exclusivity or update cadence, be skeptical.
Decision rule: Prefer businesses with exclusive, frequently updated data. Check if competitors have similar datasets—if yes, the moat is narrow.
Step 3: Calculate ROIC and Track Over 5–10 Years
Formula: ROIC = NOPAT / Invested Capital.
NOPAT: Operating income × (1 – tax rate). Adjust for non-cash charges (amortization, SBC) if you’re calculating “owner ROIC.”
Invested Capital: Shareholders’ equity + net debt – goodwill (optional: exclude recent acquisition goodwill to isolate organic ROIC).
Data sources: Balance sheet (10-K), income statement. Use average invested capital (beginning + ending / 2) for precision.
Experian example (FY2024):
NOPAT: ~$1,315M
Invested Capital: Equity $4.6B + Net Debt $4.6B – Goodwill $6.0B = $3.2B
ROIC: $1,315M / $3,200M = 41%
Decision rule: Prefer ROIC > 15% sustained over 5+ years. ROIC minus WACC should exceed 5 percentage points. If ROIC is declining, investigate whether it’s cyclical or structural.
Step 4: Assess FCF Conversion and Per-Share Growth
FCF conversion: Compare free cash flow (operating cash flow minus capex) to net income. Ratios above 90% signal capital-light, cash-generative models.
Per-share framing: Calculate FCF per share (FCF / diluted shares outstanding) over 5–10 years. If it’s growing faster than revenue, management is allocating capital well (buybacks, minimal dilution).
Data sources: Cash flow statement (10-K). Adjust for one-time items (restructuring, divestitures).
Experian example: FY2024 FCF ~$2.0B, diluted shares ~950M, so FCF/share ~$2.10. Compare to FY2014 (~$0.90/share). CAGR = 9%.
Decision rule: Prefer FCF/share CAGR > 7% over a decade. If share count is rising faster than 2% annually, investigate why (SBC, acquisitions, secondary offerings).
Step 5: Check Revenue Retention and Gross Churn
B2B retention: Look for “gross revenue retention” or “net dollar retention” in earnings calls or investor decks. B2B data businesses should report 90%+ gross retention (i.e., <10% of customers leave each year). Net retention (including upsells) of 105%+ is excellent.
Consumer churn: Consumer data products (credit monitoring, identity protection) typically churn 20–40% annually. Margins must be high enough to recoup customer acquisition cost (CAC) within 12–18 months.
Experian disclosure: Management has noted B2B gross retention >95% in investor days. Consumer Services churn is higher (~30–40% annually) but offset by digital marketing efficiency.
Decision rule: B2B retention <85% is a red flag (customers can switch). Consumer churn >50% annually is unsustainable unless CAC payback is under 6 months.
Step 6: Model Incremental Margins
Question: If revenue grows by $1, how much falls to EBIT?
Calculation: (Change in EBIT) / (Change in Revenue) over 2–3 years. For data businesses, incremental margins should exceed 50% (low marginal cost).
Experian example: From FY2022 to FY2024, revenue grew ~$700M, EBIT grew ~$350M. Incremental margin = 50%. This matches expectations for a mature, scaled data business.
Decision rule: Incremental margins >40% signal operating leverage. <30% suggests rising costs (competition, regulation, or poor pricing).
Pitfalls and False Positives
Pitfall 1: Confusing data volume with data value. Many companies tout “billions of data points,” but volume alone doesn’t create moats. Public data aggregated at scale is low-margin and commoditized.
Ask: Is the data exclusive? Is it frequently updated? Can competitors replicate it easily?
Pitfall 2: Ignoring the unit economics of customer acquisition. Direct-to-consumer data products (credit monitoring apps, identity theft services) can show strong top-line growth but burn cash if CAC payback exceeds 18 months.
Always check marketing spend as a percentage of revenue (Experian’s Consumer Services runs 20–25% marketing/sales, which is sustainable given 28% EBIT margins).
Pitfall 3: Overpaying for “network effects” that don’t compound. Not all networks are created equal. A one-sided network (company collects, customers consume) is weaker than a two-sided network (participants both contribute and consume).
Credit bureaus are two-sided; most market data vendors are one-sided. The former sustains pricing power; the latter faces commoditization.
Pitfall 4: Ignoring accounting distortions from M&A. Acquisitions bloat goodwill and intangibles, depressing reported ROIC for years. Always calculate ROIC excluding recent acquisition goodwill to see the organic business quality.
Also, reconcile GAAP net income to owner earnings (add back intangible amortization, subtract true maintenance capex).
Pitfall 5: Assuming regulatory moats are permanent. Data privacy laws can erode moats if they restrict data use or require costly compliance. Monitor legislative trends (GDPR in Europe, CCPA in California, federal privacy bills in the US). Experian has navigated these well so far, but future restrictions could compress margins or limit growth.
Pitfall 6: Missing the maturity signal. When organic revenue growth decelerates from 7% to 3–4%, the market often punishes the stock. But for capital-light compounders, slower revenue growth can still deliver strong per-share returns if margins expand and share count shrinks.
Don’t reflexively sell a quality business just because growth moderates, focus on FCF per share, not revenue growth.
Checklist: Data Network Quality Screen
ROIC > 15% sustained over 5+ years, with ROIC – WACC spread >5 percentage points.
FCF conversion >90% of net income, indicating capital-light, cash-generative model.
Per-share FCF CAGR >7% over a decade, driven by buybacks or minimal dilution.
Two-sided network structure (participants both contribute and consume data), not one-sided aggregation.
Gross revenue retention >90% in B2B, signaling high switching costs and pricing power.
Glossary
ROIC (Return on Invested Capital): NOPAT divided by invested capital (equity + net debt); measures how efficiently a company generates profit from its capital base.
NOPAT (Net Operating Profit After Tax): Operating income × (1 – tax rate); normalizes for capital structure.
FCF Conversion: Free cash flow as a percentage of net income; >90% signals capital-light, cash-generative model.
Gross Revenue Retention: Percentage of prior-year revenue retained from the same customers, excluding upsells; measures customer stickiness.
Cash Conversion Cycle (CCC): DSO + DIO – DPO; measures how quickly a company converts cash outlays into cash collections.
Incremental Margin: Change in EBIT divided by change in revenue; measures operating leverage.
CAC Payback: Months to recover customer acquisition cost from gross profit; <18 months is healthy for consumer subscription models.
Two-Sided Network: Participants both contribute data and consume insights, creating a self-reinforcing flywheel (e.g., credit bureaus).
Further Reading
Experian Annual Report FY2024 — Comprehensive financials, segment disclosures, and management discussion (as of March 31, 2024).
Experian Investor Day Presentation 2023 — Capital allocation philosophy, retention metrics, and segment deep dives (as of November 2023).
“The Power of Data Networks” — Hamilton Helmer, 7 Powers — Framework for understanding network effects and moat durability (book published 2016, concepts remain relevant).
“Credit Bureau Industry Overview” — IBISWorld — Market structure, competitive dynamics, and regulatory landscape (as of 2024).
References
Experian plc Annual Report, Fiscal Year 2024 (year-end March 31, 2024). Available at https://www.experianplc.com/investors.
Experian plc Investor Day Presentation, November 2023. Available at https://www.experianplc.com/investors.
Capital IQ and FactSet data (subscription required) for historical ROIC, FCF, and per-share metrics (as of October 2024).
IBISWorld Industry Report: Credit Bureaus in the US (NAICS 56145), updated 2024.
Hamilton Helmer, 7 Powers: The Foundations of Business Strategy (2016).
Fair Credit Reporting Act (FCRA) regulatory framework, US Federal Trade Commission, updated 2024.
Disclaimer: This article is educational content and not investment advice. Always conduct your own due diligence and consult a financial advisor before making investment decisions.
💡