

Finding the right valuation metric is crucial when analyzing stocks. Free cash flow (FCF) remains one of the most popular metrics investors use to evaluate companies, and for good reason, it shows the cash a business generates after covering capital expenditures.
But here’s something that might shock the average investor: FCF can be deeply misleading for certain business models, particularly financial services companies and capital-intensive growth businesses.
In today’s post, we will learn:
Okay, let’s dive in and learn more about when free cash flow stops being your friend.
What Is Free Cash Flow and Why Investors Love It
Before we dig into where FCF falls short, let’s make sure we understand what it actually measures.
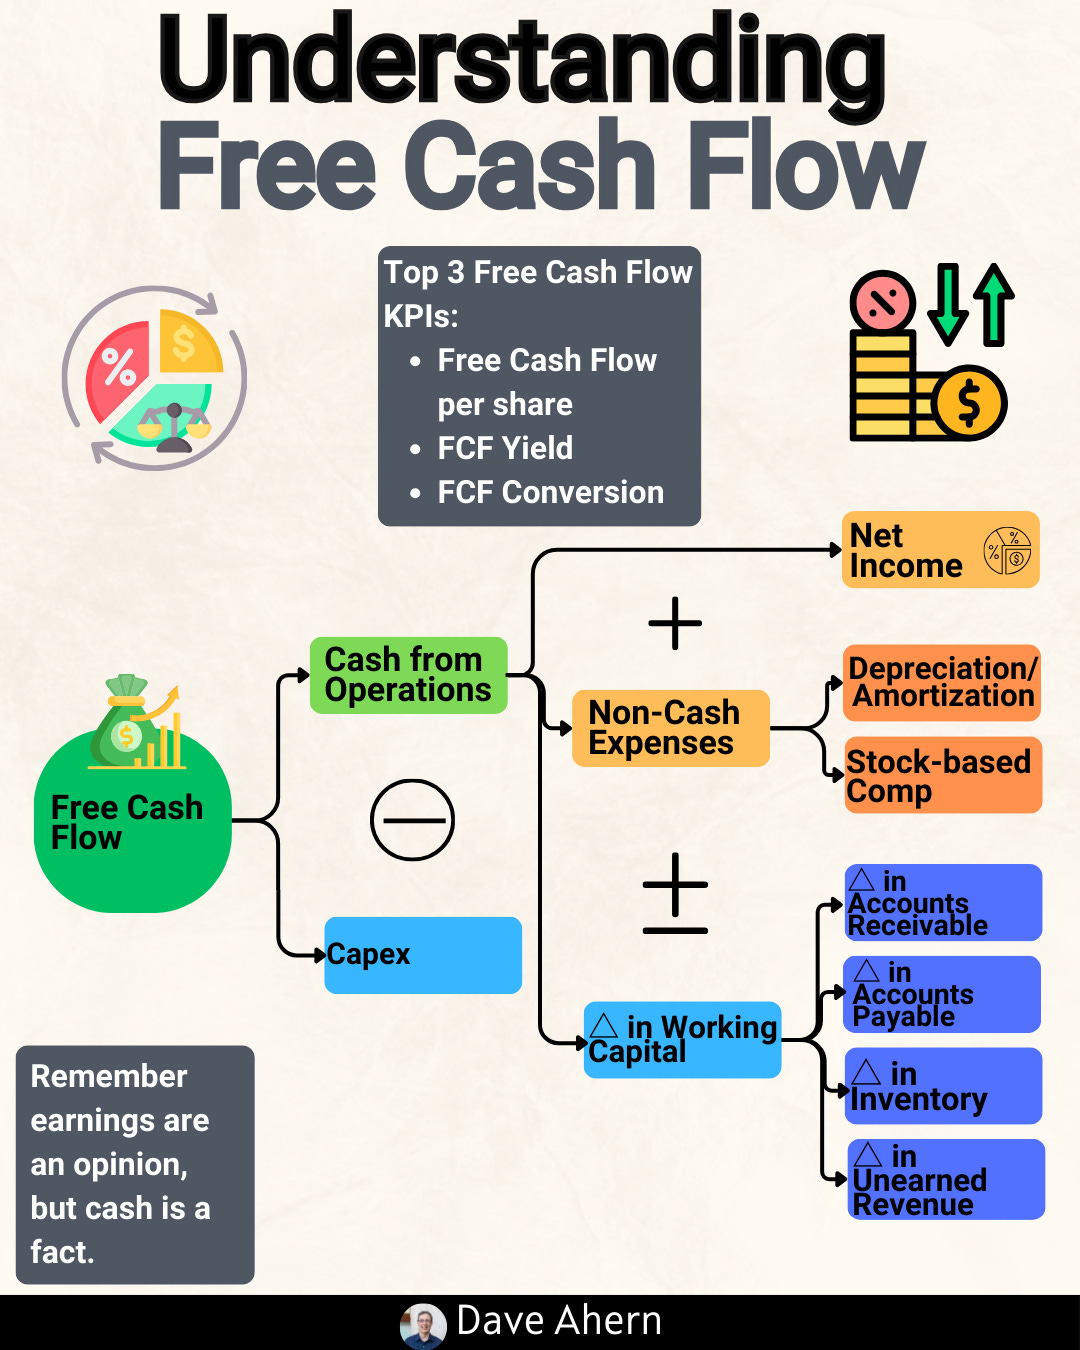
Free cash flow represents the cash a company generates from operations after accounting for capital expenditures needed to maintain and grow the business. The formula looks like this:
Free Cash Flow = Operating Cash Flow - Capital Expenditures
Where:
Operating Cash Flow = Cash generated from the company’s core business operations
Capital Expenditures (CapEx) = Cash spent on property, equipment, technology infrastructure, and other long-term assets
Investors love FCF because it shows the real cash available to reward shareholders through dividends, stock buybacks, debt reduction, or reinvestment. Unlike earnings, which can be manipulated through accounting choices, cash flow remains far more transparent. As Jeff Bezos famously said, “Stock prices are most closely correlated with cash flow.”
For many businesses—particularly mature, asset-light companies- FCF provides a crystal-clear picture of value creation. But what happens when a company’s business model doesn’t fit the traditional FCF framework?
Not too hard, was it?
The Problem: When Business Models Break the FCF Framework
Here’s where things get interesting. FCF assumes that capital expenditures represent straightforward investments in physical assets, factories, warehouses, delivery trucks, and technology infrastructure. But some business models render this framework incomplete or even misleading.
Two scenarios consistently break the FCF lens:
1. Financial Services Business Models (, The Pseudo-Bank Problem)
When a company starts taking deposits and making loans like a bank, it fundamentally changes how we should think about cash flows. The cash used for lending isn’t really “capital expenditure ” in the traditional sense; it’s more like bank inventory. Banks don’t report negative free cash flow when they originate loans, and neither should fintech companies operating similar business models. Yet traditional FCF calculations treat lending activities in ways that distort the underlying economics.
2. Lumpy Capital Expenditure Cycles (The Growth Investment Problem)
Some businesses, particularly those building massive infrastructure, experience wildly varying CapEx needs from year to year. Amazon’s AWS buildout provides a perfect example. During periods of heavy investment, FCF tanks, not because the business is unhealthy, but because management remains focused on long-term value creation. Judging these companies solely on FCF during peak investment years misses the bigger picture entirely.
Let’s look at both scenarios using real company data.
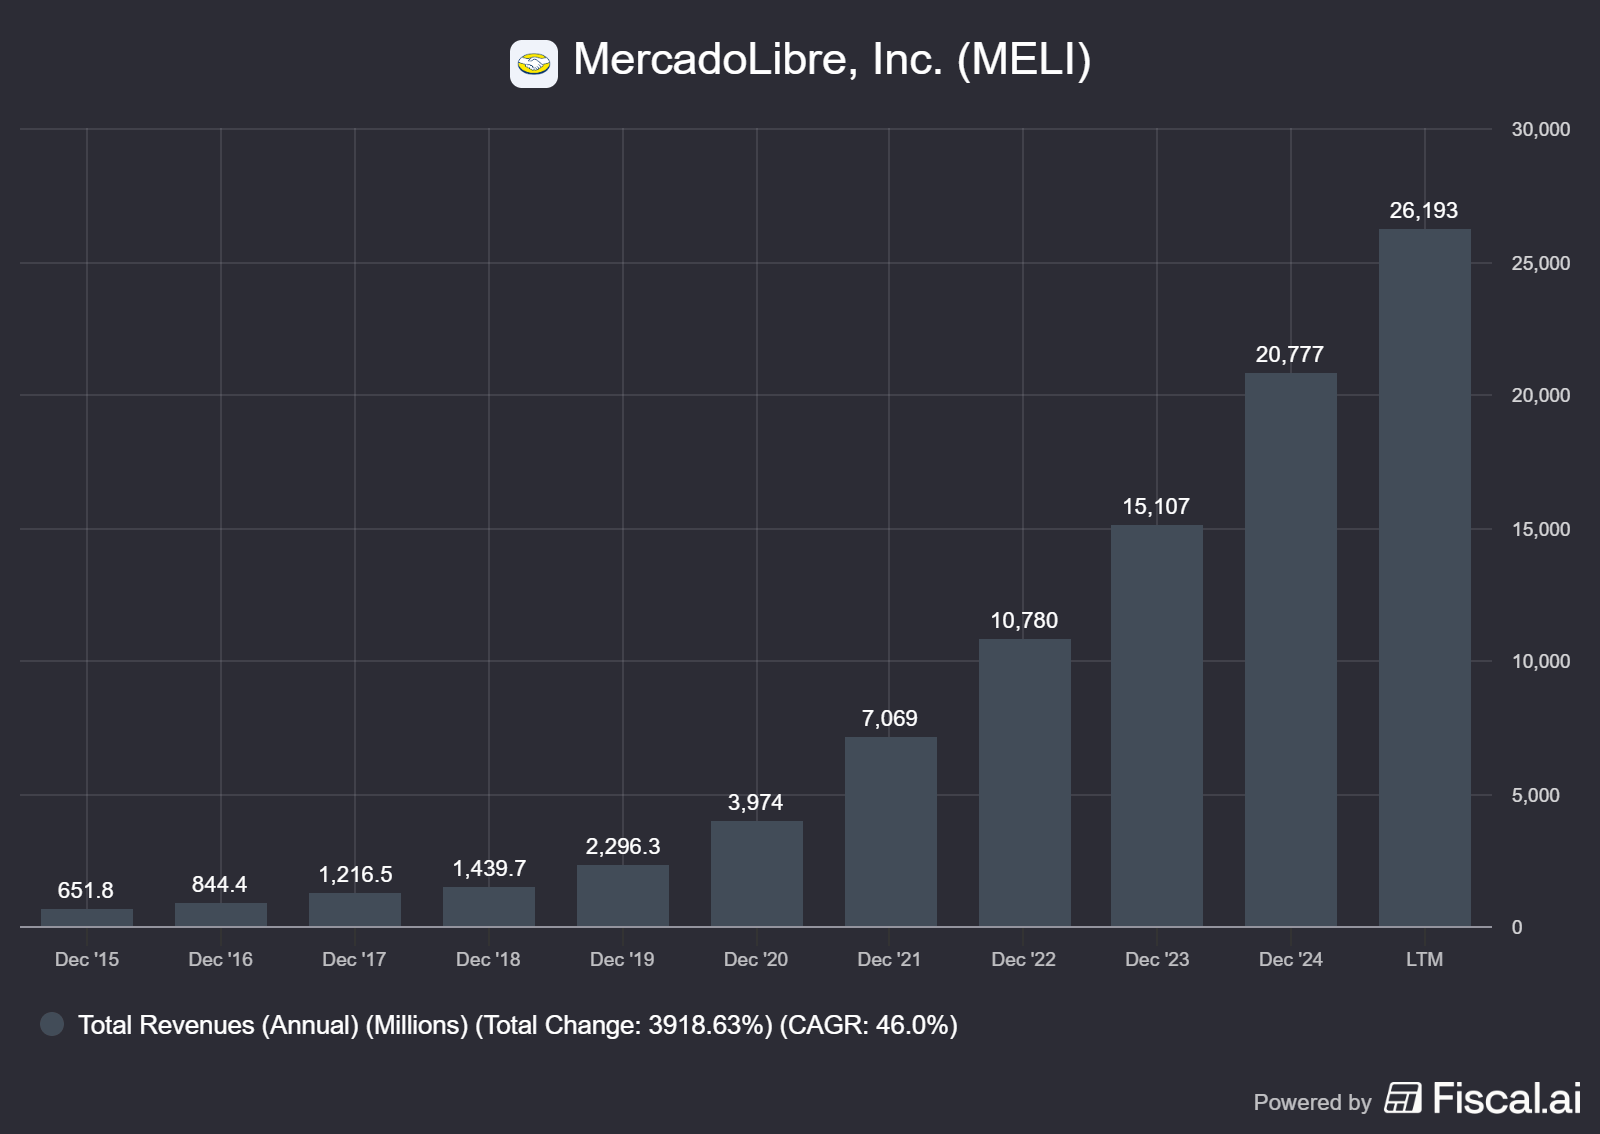
MercadoLibre: The Pseudo-Bank
For our first example, let’s examine MercadoLibre (MELI), Latin America’s e-commerce and fintech giant. Using data from their most recent 10-K filed with the SEC in February 2025, we can see how their transformation into a financial services powerhouse makes FCF problematic.
The Business Model Evolution
MercadoLibre started as Latin America’s answer to eBay—a marketplace connecting buyers and sellers. But over the past five years, the company transformed into something far more complex. Through Mercado Pago, they now offer:
Digital payment processing
Consumer credit cards with competitive limits
Merchant lending
Consumer loans
Investment accounts (Mercado Fondo), where users earn yields on deposits
As of their 2024 10-K, Mercado Pago reached 61 million monthly active users with $10.6 billion in assets under management. Their credit portfolio reached $6.6 billion in Q4 2024, up 74% year over year. The credit card business alone now represents 43% of their total credit book.
In other words, MercadoLibre operates as a pseudo-bank, taking deposits and originating loans across multiple Latin American markets.
The Free Cash Flow Picture
Let’s look at MercadoLibre’s cash flow statement from their SEC filings. Using data from Yahoo Finance (which sources directly from SEC 10-K filings), here’s what we find:
Not too bad, huh? FCF has grown dramatically, from just $356 million in 2020 to $7.4 billion in 2024. At first glance, this looks phenomenal. But here’s the problem: this FCF figure treats all cash used for lending as if it disappeared from the business forever, as if it were a warehouse.
Why FCF Misleads for Mercado Pago
Think of it this way: when MercadoLibre originates a $1,000 consumer loan, that cash leaves the company. Under traditional FCF analysis, this appears to be a cash outflow that reduces free cash flow. But unlike spending $1,000 on equipment that depreciates, that loan remains an asset on the balance sheet. The borrower repays it with interest, generating returns.
Banks don’t report massive negative FCF when they originate mortgages. They recognize that lending represents their core business model, not capital expenditure. Yet when a fintech like MercadoLibre scales up lending, traditional FCF calculations penalize them for growth that will likely generate attractive returns.
The company’s 2024 10-K specifically highlights how its credit scoring models improved, allowing it to extend credit more confidently. Their credit card cohorts from 2021-2023 have already reached profitability, and the 2024 cohort—the largest yet—remains on track to do the same. This doesn’t look like value destruction; it looks like profitable growth. But FCF can’t capture that nuance.
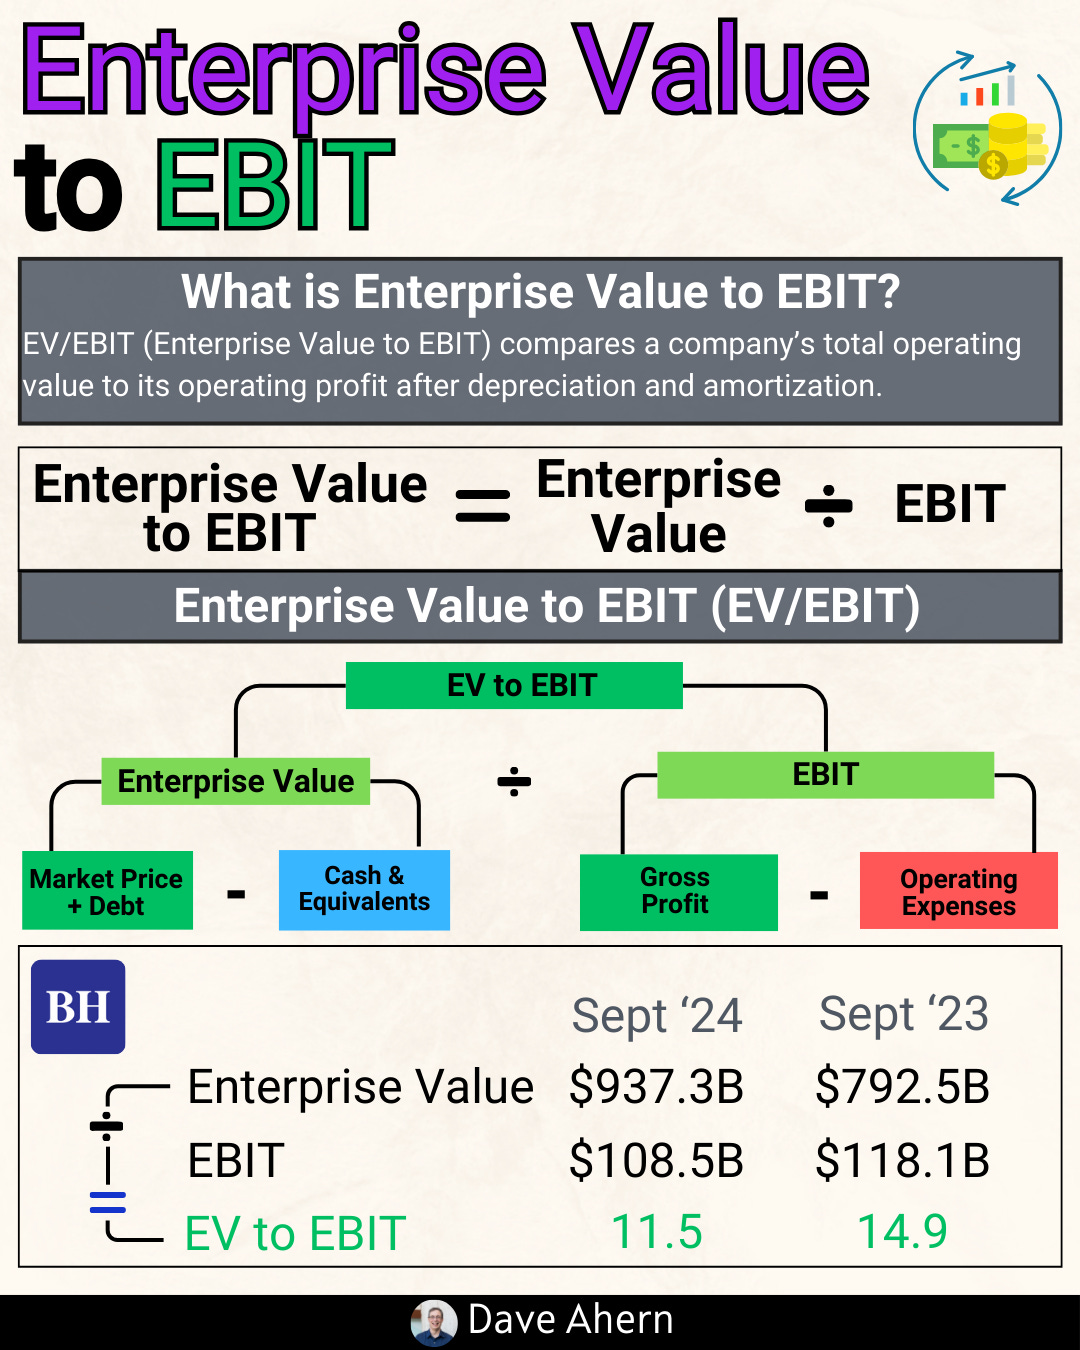
A Better Metric: EV/EBIT
For companies with significant financial services operations, Enterprise Value-to-EBIT (EV/EBIT) provides a clearer picture. This metric measures the business’s operating profitability before the complications of interest and taxes and values the entire enterprise (equity plus net debt).
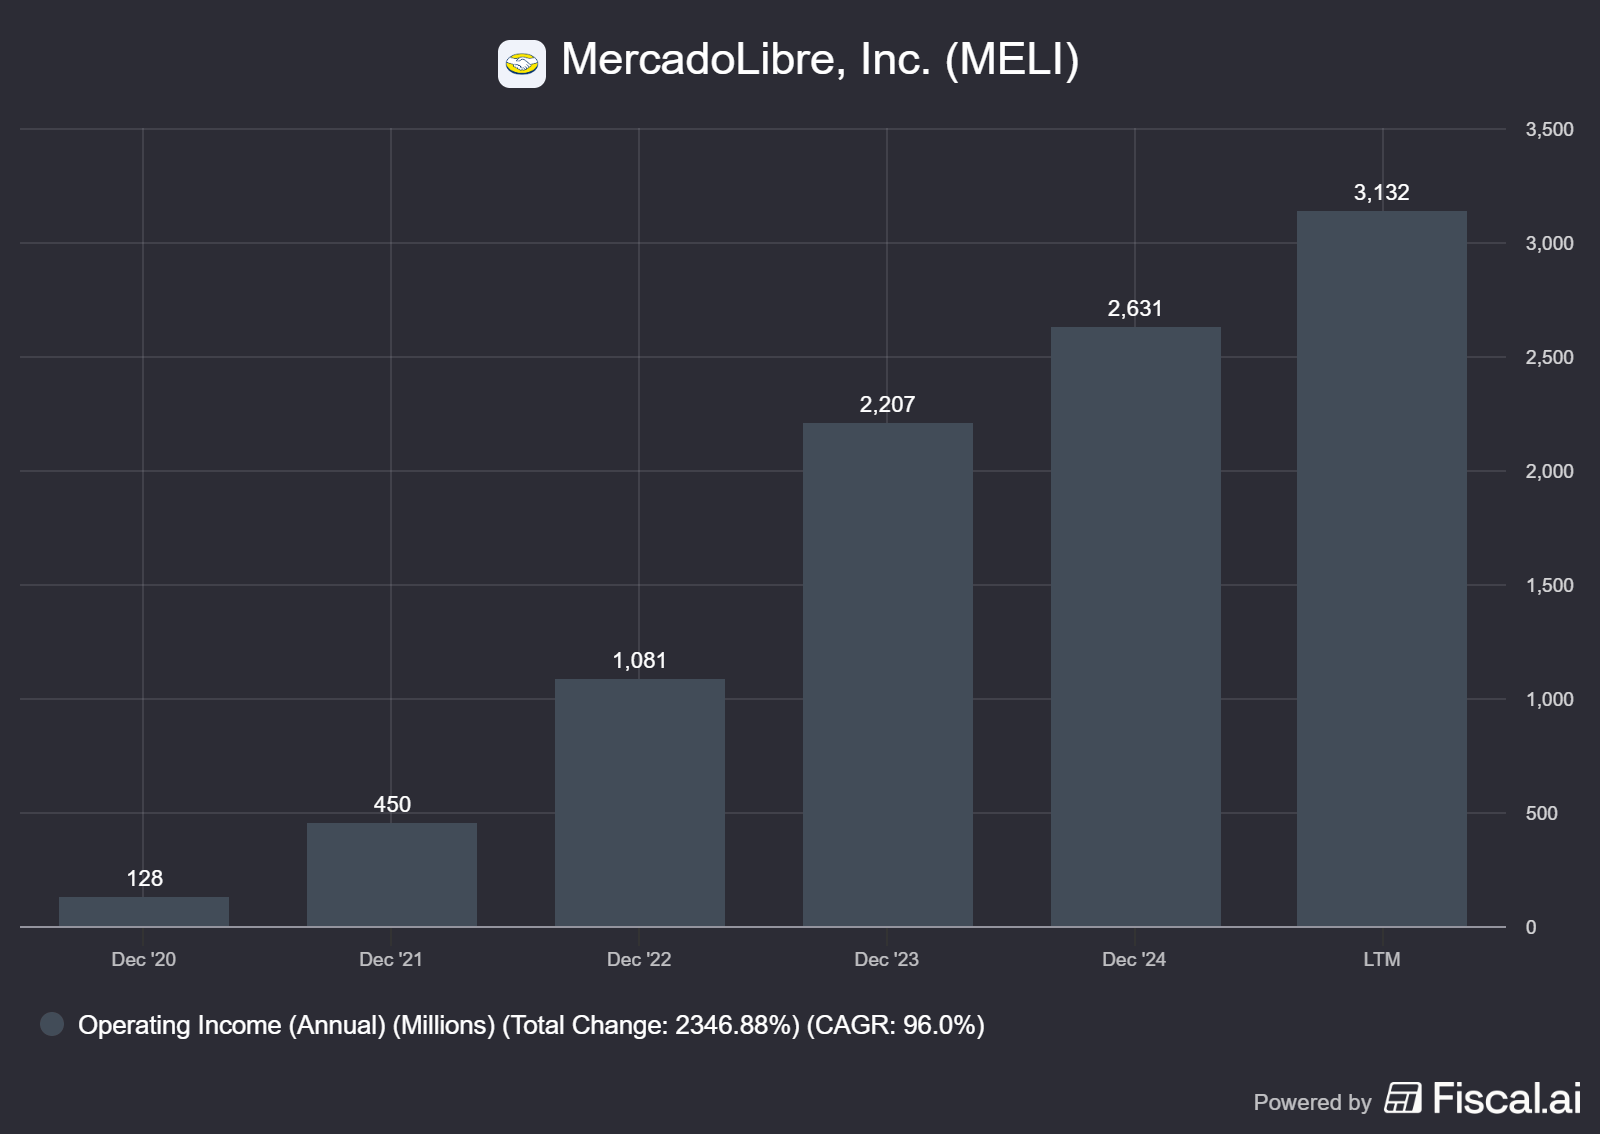
From MercadoLibre’s 2024 10-K, their income from operations (EBIT) reached $2,636 million in 2024, up from $2,207 million in 2023. Here’s the five-year trend:
EBIT has grown at an extraordinary pace—14.5x growth over five years. This captures the value creation far better than FCF because it focuses on operating profitability without getting tangled up in the financing activities that define their business model.
As of November 2025, MercadoLibre trades at a roughly $107 billion enterprise value. Dividing by 2024 EBIT of $2.636 billion gives us an EV/EBIT multiple of approximately 40.6x.
That’s expensive, but at least it measures the right thing: how much investors pay for each dollar of operating profit, regardless of whether that profit is reinvested in loans or returned to shareholders.
Remember, the bottom line remains that financial services businesses require different analytical tools. Using FCF to value a company that takes deposits and originates loans is like using a measuring tape to weigh ingredients—you’ve got the wrong tool for the job.
Amazon: Lumpy CapEx Distorts the Picture
Now let’s look at a completely different problem with FCF: capital expenditure cycles that create misleading signals about business health.
Amazon provides the perfect case study. Using data from their 2024 10-K filed with the SEC in February 2025, we can see how massive infrastructure investments created years of depressed or negative free cash flow despite spectacular operating performance.
The CapEx Rollercoaster
Here’s Amazon’s cash flow picture from their SEC filings:
Let’s pause here. Did you catch that?
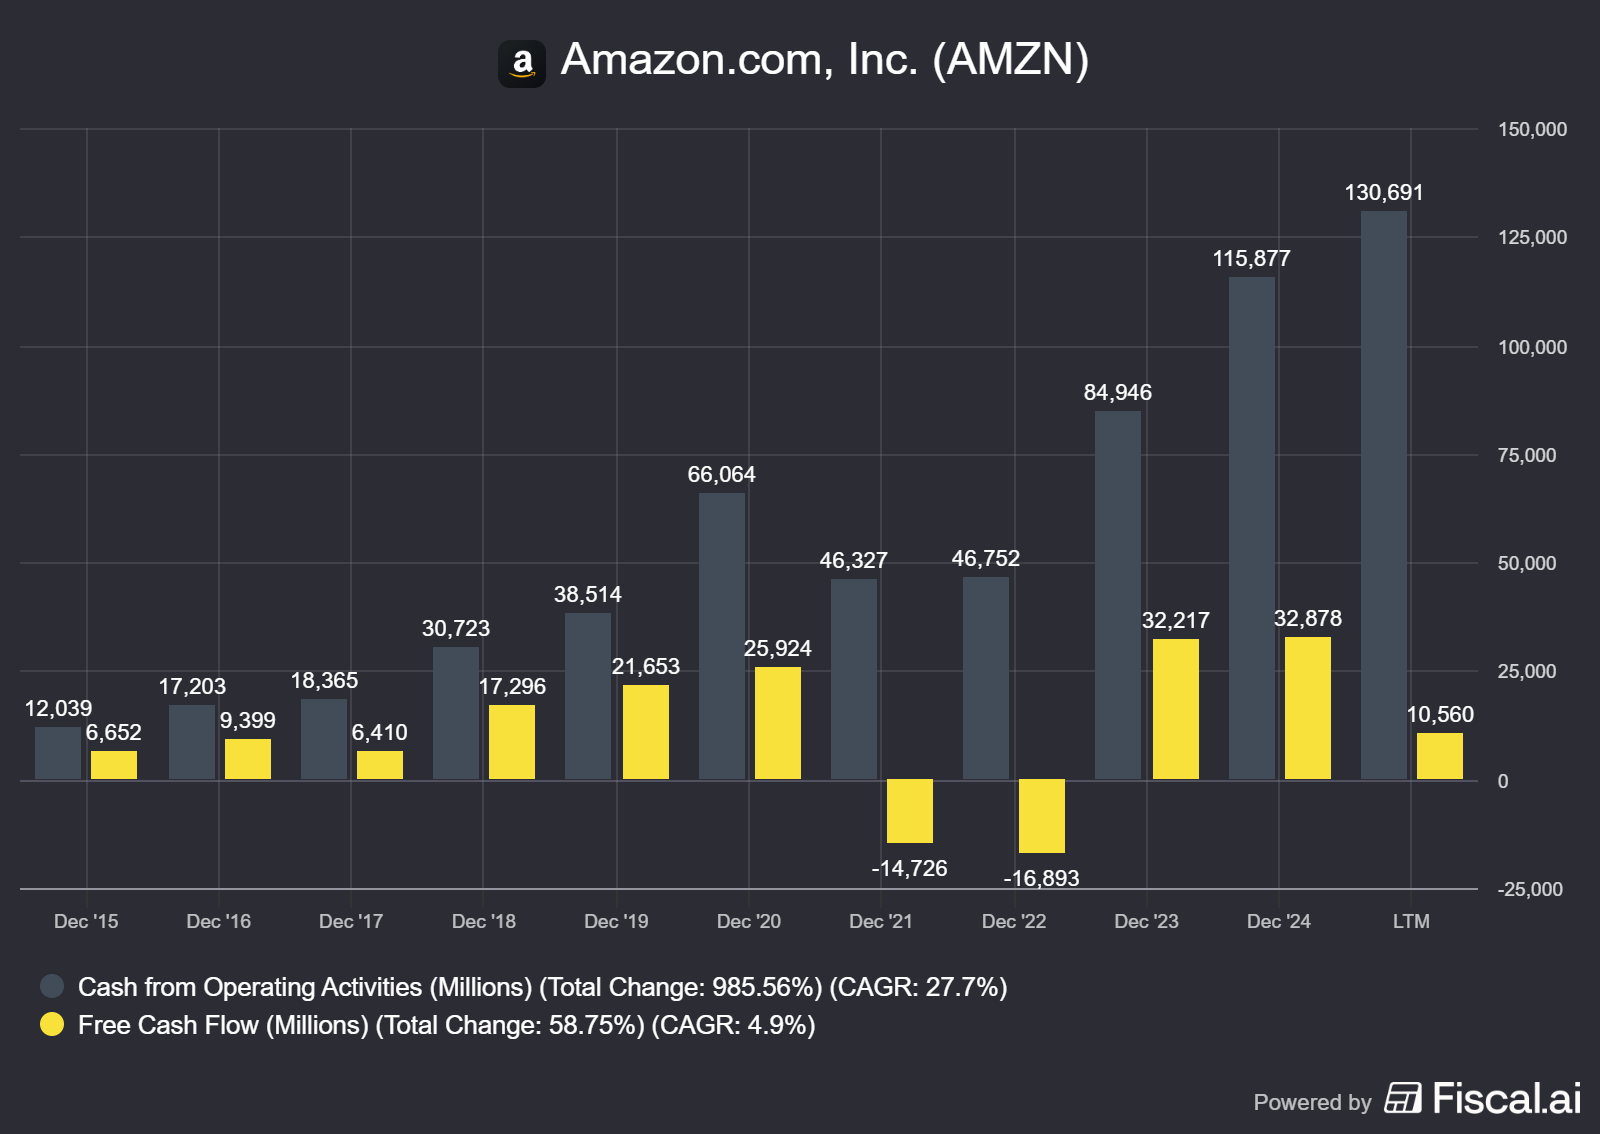
In 2021 and 2022, Amazon generated negative free cash flow.
That’s right, one of the world’s most successful companies, at the peak of its dominance, was burning through cash on an FCF basis.
Should investors have panicked and sold? Absolutely not.
What happened?
The AWS Infrastructure Buildout
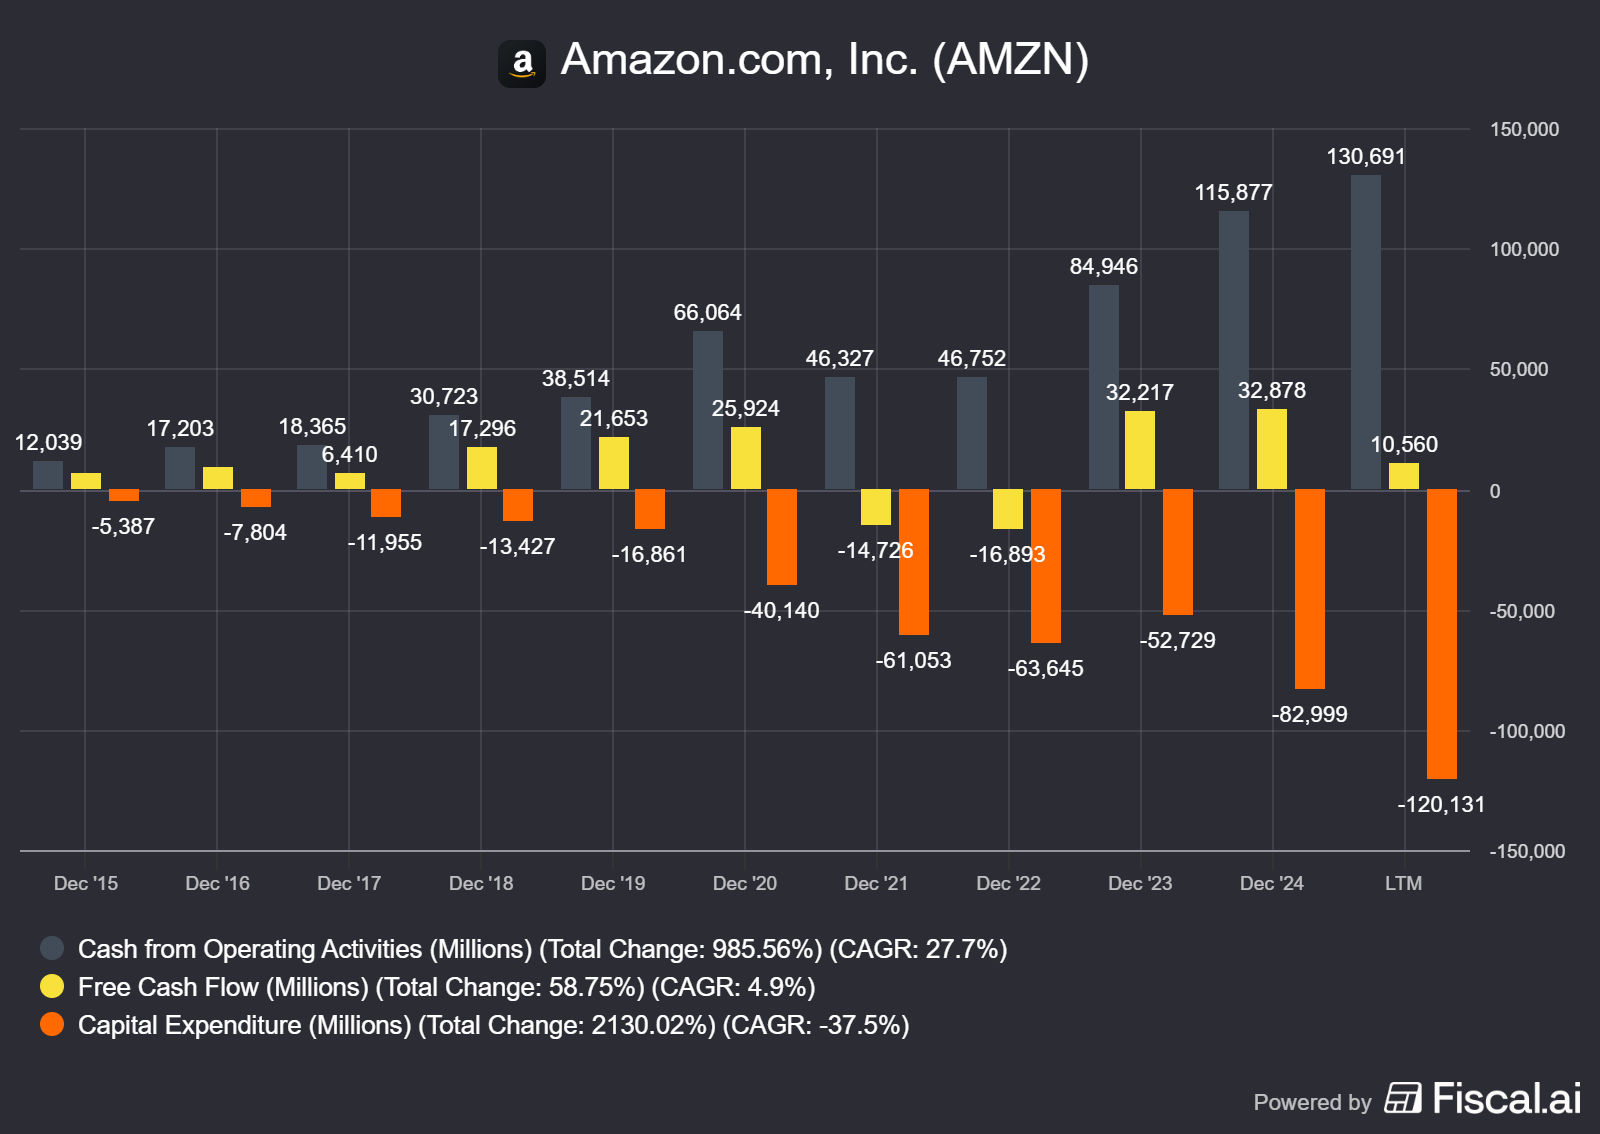
Amazon was in the middle of an unprecedented buildout of AWS data center infrastructure. Cloud computing infrastructure doesn’t come cheap—servers, cooling systems, backup power, networking equipment, and real estate all require massive upfront investment. CapEx jumped from roughly $61 billion in 2021 to $64 billion in 2022, remaining elevated at $53 billion in 2023 before hitting $83 billion in 2024.
During this period, operating cash flow actually improved dramatically, from $46 billion in 2021 to $116 billion in 2024. The business remained spectacularly healthy. The core operations generated ever-increasing cash. But because Amazon chose to reinvest aggressively in infrastructure to support future growth, FCF looked terrible.
This is the lumpy CapEx problem. Some years require enormous infrastructure investment. Other years require less. Free cash flow swings wildly based on management’s timing of capital deployment, not on the underlying health of the business.
Looking Forward: The 2025 CapEx Surge
Here’s where it gets really interesting. Amazon guided for capital expenditures of over $100 billion in 2025, primarily focused on AWS infrastructure and AI capabilities.
If we assume operating cash flow grows modestly to $120 billion (a reasonable assumption given the trajectory), FCF in 2025 would be approximately $20 billion, down from $33 billion in 2024.
Does that mean Amazon is getting worse?
Not at all.
It means management sees massive opportunities in AI and cloud infrastructure, and they’re willing to deploy capital today to capture those opportunities tomorrow. Amazon’s 2024 return on invested capital (ROIC) improved to 20.96%, up from 13.9% the prior year, suggesting that previous investments are generating excellent returns.
A Better Metric: Price-to-Operating Cash Flow (P/OCF)
For capital-intensive businesses with lumpy CapEx cycles, looking at operating cash flow before capital expenditures provides a clearer picture of underlying business health.
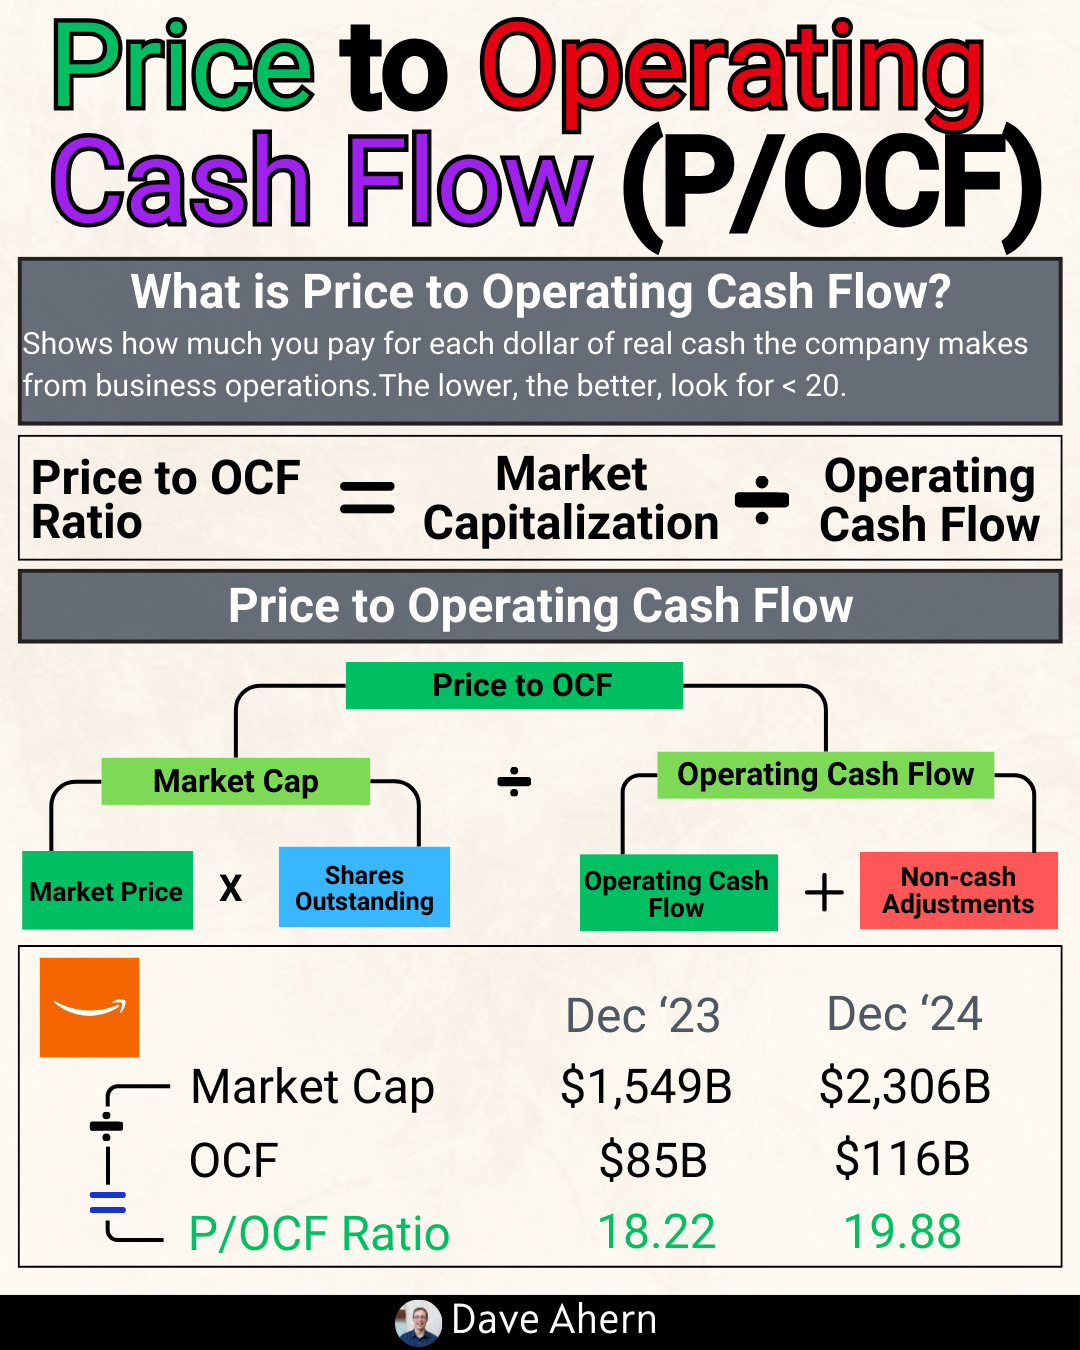
Amazon’s operating cash flow reached $115.9 billion in 2024. With a market capitalization of approximately $2.36 trillion as of November 2025, this gives us a P/OCF ratio of roughly 20.4x.
Think about what this tells us: ignoring the timing of capital investments, investors pay about 20 times the cash Amazon generates from its core operations. This metric focuses on the business’s ability to convert revenue into cash, regardless of how much management chooses to reinvest in any given year.
This approach works particularly well for Amazon because:
CapEx timing is discretionary - Management can accelerate or delay certain infrastructure projects without damaging the business
Historical CapEx has generated strong returns - Previous investments in fulfillment centers and AWS infrastructure drove massive growth
Operating leverage is improving - Operating cash flow grew 36.5% year-over-year in 2024, showing the business generates more cash from each incremental dollar of revenue
When you judge Amazon on operating cash flow rather than free cash flow, the picture becomes much clearer. You’re measuring the engine, not the amount of fuel management chooses to pour back into it.
Wasn’t that pretty simple?
Better Valuation Alternatives
So we’ve seen two major cases where FCF breaks down. What should investors use instead?
For Companies with Financial Services Business Models: EV/EBIT
When a company operates like a bank, taking deposits, originating loans, and earning net interest margin, shift your focus to Enterprise Value divided by EBIT (Earnings Before Interest and Taxes).
Why this works:
Captures operating profitability before financing activities
Treats lending as a core business operation, not capital expenditure
Allows comparison to both traditional financial institutions and fintech peers
Accounts for the entire capital structure through enterprise value
How to calculate:
Find Enterprise Value:
Enterprise Value = Market Cap + Total Debt - Cash
For MercadoLibre: ~$107 billion EV
Find EBIT (Operating Income):
Look for “Income from Operations” on the income statement
For MercadoLibre 2024: $2,636 million
Calculate the ratio:
EV/EBIT = $107,000 million / $2,636 million = 40.6x
This tells us investors pay roughly 41 times MercadoLibre’s operating profit for the entire enterprise. You can compare this to other fintech companies or to traditional banks (which typically trade at much lower multiples, reflecting lower growth expectations).
Other examples:
Sea Limited
Alibaba
Block
PayPal
Affirm
Deere
For Capital-Intensive Businesses: P/OCF
When a company invests heavily in physical infrastructure with lumpy timing, shift your focus to Price-to-Operating Cash Flow.
Why this works:
Measures the cash-generating power of core operations
Removes the distortion of discretionary CapEx timing decisions
Shows underlying business health regardless of investment cycles
Better reflects management’s ability to convert revenue to cash
How to calculate:
Find Operating Cash Flow:
Located in the cash flow statement as “Net cash provided by operating activities”
For Amazon 2024: $115,877 million
Find Market Capitalization:
Current stock price × shares outstanding
For Amazon (Nov 2025): ~$2.36 trillion
Calculate the ratio:
P/OCF = $2,360,000 million / $115,877 million = 20.4x
This tells us investors pay about 20 times Amazon’s operating cash flow. During periods of heavy CapEx investment, this metric remains stable even as FCF swings dramatically.
When FCF Still Works Perfectly
Before you abandon FCF entirely, remember: it remains the gold standard for many businesses. FCF works beautifully for:
Asset-light software companies with predictable, low CapEx needs
Mature businesses with steady maintenance CapEx and limited growth investment
Consumer brands that don’t require significant capital deployment
Professional services firms where human capital matters more than physical assets
Companies like Microsoft, Visa, or Coca-Cola fit the traditional FCF framework perfectly. Their capital needs remain predictable, their CapEx is primarily maintenance rather than transformational growth, and cash after CapEx truly represents cash available to shareholders.
The key is matching your analytical tool to the business model you’re studying.
Investor Takeaway
Free cash flow remains one of the most powerful analytical tools in an investor’s arsenal, but it’s not a universal solution. Understanding when FCF misleads you is just as important as understanding what it measures.
Remember these key points:
1. Know the business model before choosing your metric. If a company operates like a bank, taking deposits, originating loans, earning net interest margin, don’t judge it by FCF. Use EV/EBIT instead, which captures operating profitability without penalizing lending activities that define the business model.
2. Recognize lumpy CapEx cycles. For capital-intensive businesses making massive infrastructure investments, operating cash flow provides a clearer picture than FCF. Amazon’s “negative” FCF years in 2021-2022 didn’t signal trouble; they signaled aggressive investment in future growth. Focus on P/OCF to filter out timing noise.
3. Context always matters. MercadoLibre’s FCF looks great at $7.4 billion in 2024, but that number masks the reality that they’re running a growing financial services business. Amazon’s FCF looks mediocre at $33 billion relative to its $2.4 trillion market cap, but the operating cash flow of $116 billion tells a much stronger story.
4. No single metric tells the whole story. The best investors use multiple lenses to understand a business. Combine FCF with ROIC, operating margins, revenue growth, competitive positioning, and management quality. The goal isn’t finding one perfect number, it’s building a complete picture.
Remember, as Warren Buffett often reminds us, “It is better to be approximately right than precisely wrong.” Don’t get stuck using the wrong tool just because it’s the most popular one. Match your analytical approach to the business you’re studying.
When you spot a company like MercadoLibre or Amazon, take a moment to think about whether traditional FCF truly captures the value creation happening inside the business. More often than you’d think, the answer is no, and recognizing that fact can give you an edge over investors who rely on FCF alone.
With that, we will wrap up our discussion today.
As always, thank you for taking the time to read today’s post, and I hope you find something of value in your investing journey. If I can further assist, please don’t hesitate to reach out.
Until next time, take care and be safe out there,
Dave
I really love your substack a lot. Thanks a lot
Amazing Read...!!