
What ‘Quality’ Really Means in Public Markets

When Warren Buffett talks about buying “wonderful companies at fair prices,” he’s talking about quality.
But what does quality actually mean when you’re analyzing a stock? It’s more than just strong profits. It’s a combination of financial excellence and business characteristics that compound over time.
Most investors focus on growth or valuation. They miss the companies that quietly compound wealth through superior economics.
The credit rating duopoly of Moody’s Corporation and S&P Global provides a masterclass in what true quality looks like in public markets.
The Promise: By the end of this article, you’ll understand the specific financial metrics and business characteristics that define quality companies. You’ll know exactly what to look for when evaluating whether a business deserves a premium valuation and a long-term spot in your portfolio.
What Quality Really Means
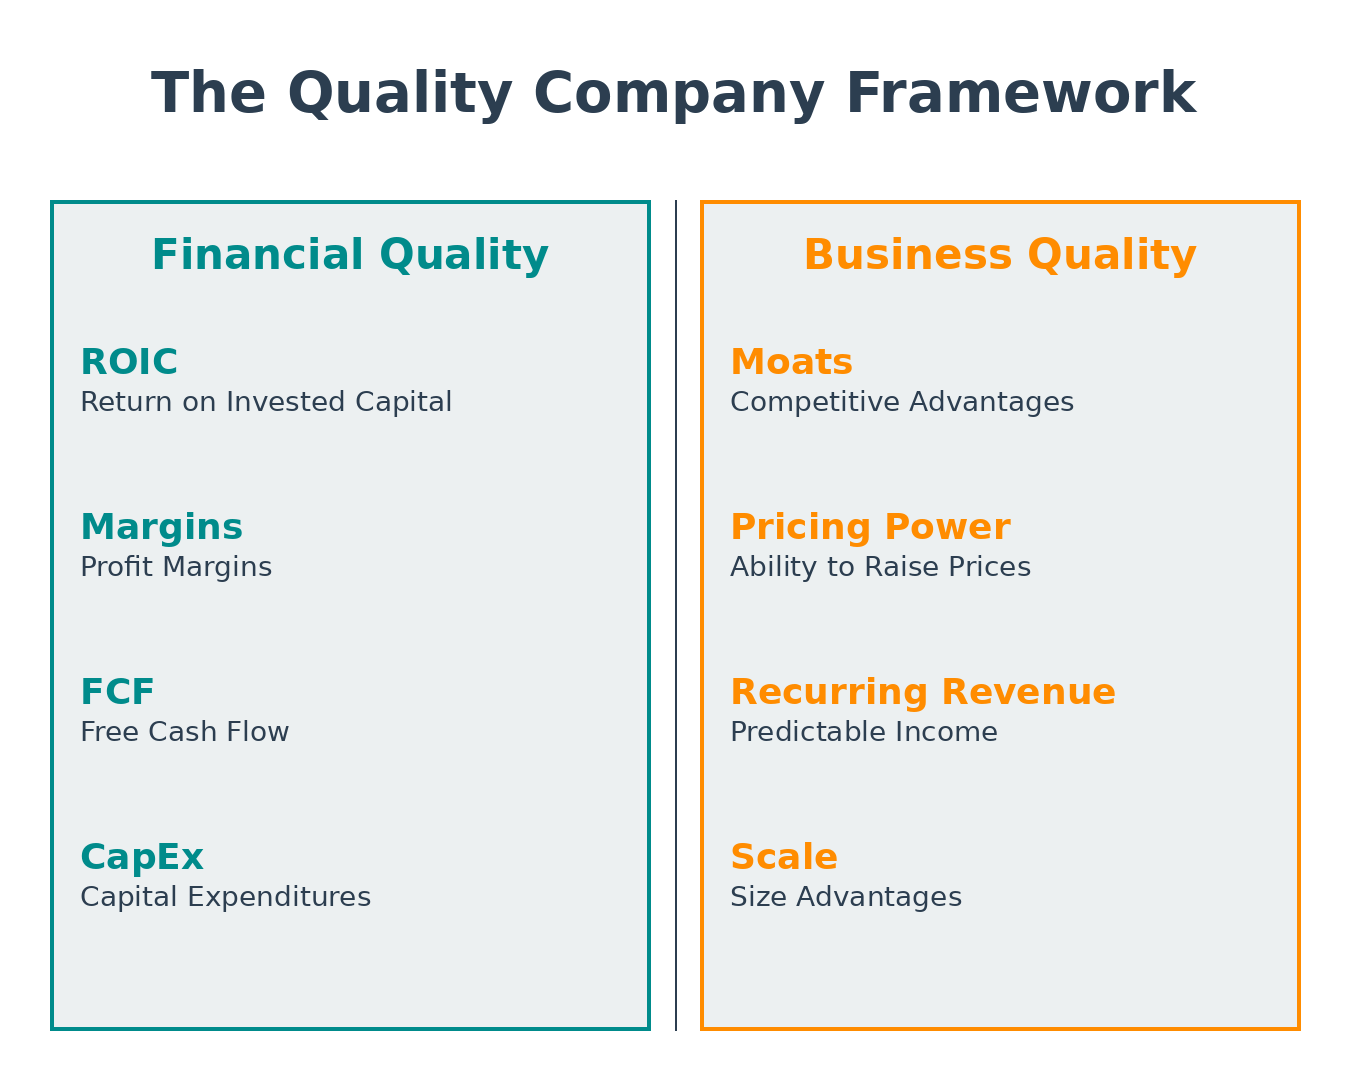
Quality in investing refers to companies with:
Financial characteristics:
High and stable returns on invested capital (ROIC)
Strong and improving operating margins
Excellent cash conversion (turning profits into cash)
Minimal capital requirements to grow
Business characteristics:
Durable competitive advantages (moats)
Pricing power
Recurring revenue streams
High customer switching costs
Quality companies can reinvest at high rates of return for extended periods. This creates a compounding machine that generates wealth over decades, not quarters.
The Duopoly Advantage: Moody’s and S&P Global
Credit ratings represent one of the most powerful duopolies in finance. Moody’s (ticker: MCO) and S&P Global (ticker: SPGI) control roughly 80% of the global credit ratings market. This isn’t by accident. It’s the result of regulatory moats, network effects, and decades of reputation building.
Both companies exhibit textbook-quality characteristics. Let’s examine their financials to understand why.
Financial Quality Indicators
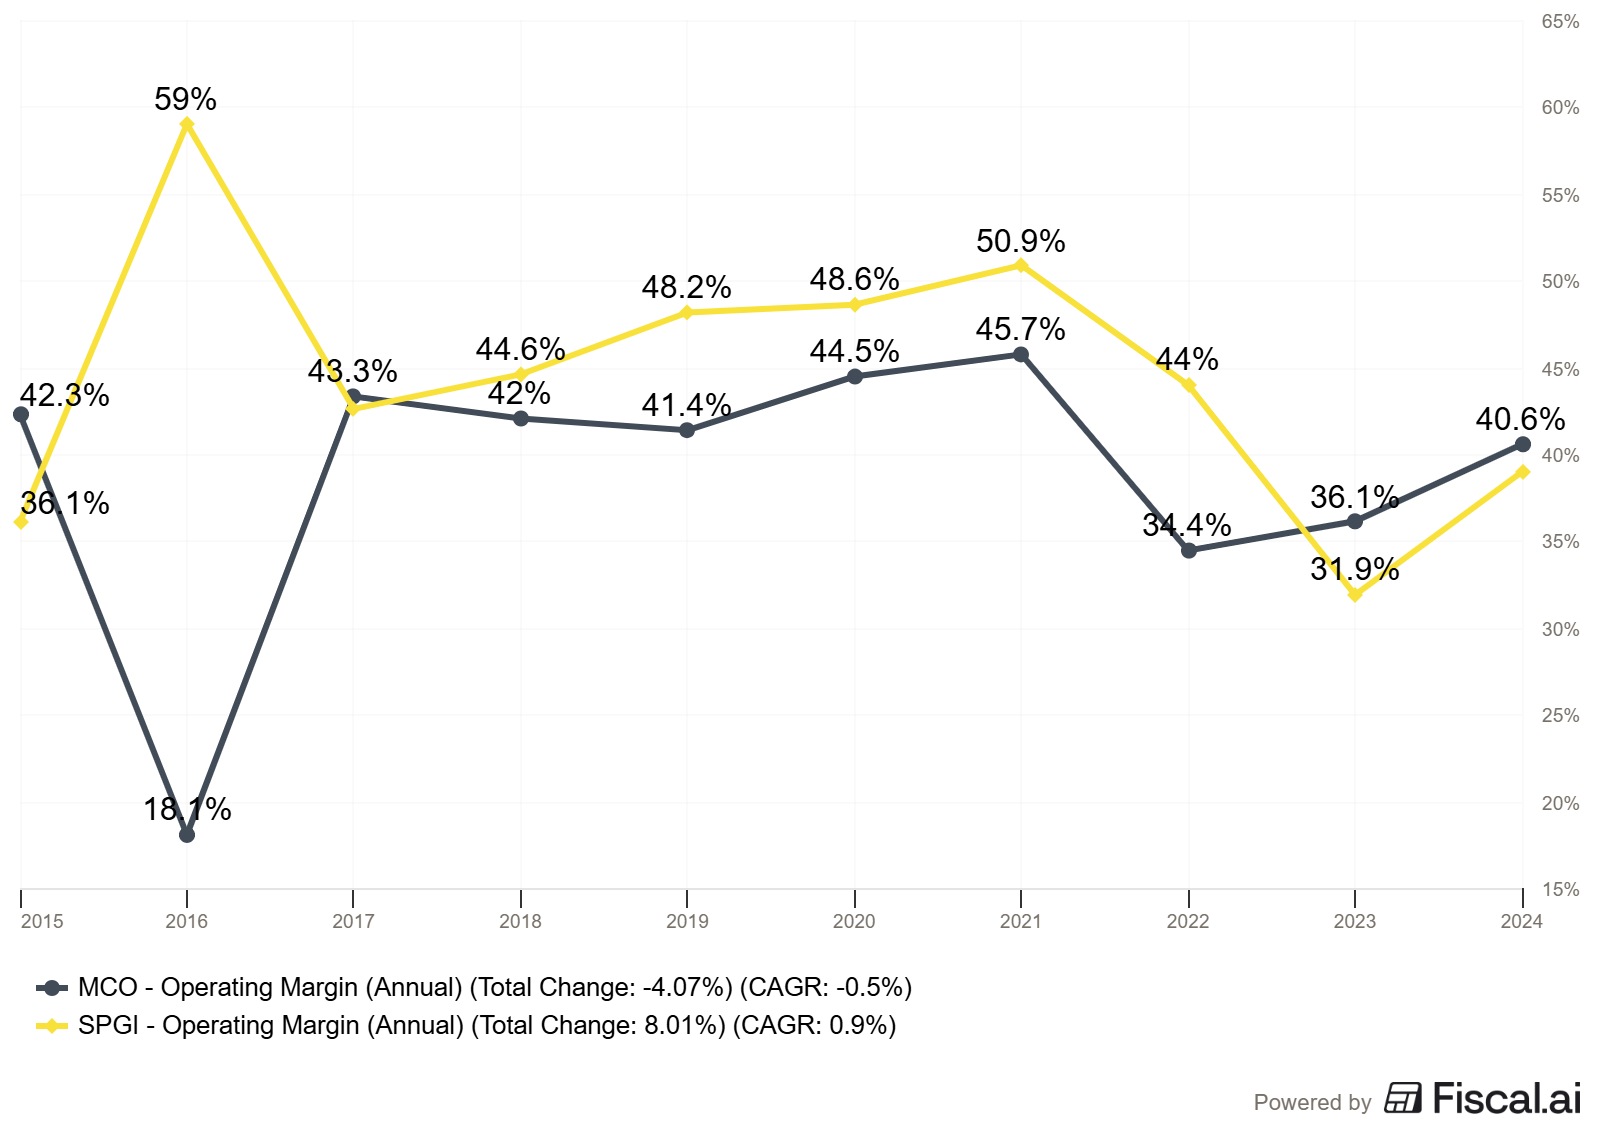
Operating Margins: The Efficiency Test
Operating margin indicates the percentage of each dollar of revenue that is profit. Quality businesses operate with consistently high margins because of pricing power and operating leverage.
According to Moody’s 2024 10-K for the fiscal year ending December 31, 2024, the company achieved remarkable profitability:
Moody’s Investors Service (MIS) segment:
Revenue: $3,986 million
Adjusted Operating Income: $2,394 million
Adjusted Operating Margin: 60.1%
Moody’s Analytics (MA) segment:
Revenue: $3,308 million
Adjusted Operating Income: $1,014 million
Adjusted Operating Margin: 30.7%
The MIS segment’s 60% operating margin is extraordinary. For every dollar of ratings revenue, Moody’s keeps 60 cents as operating profit. Even MA, the less profitable segment, operates at 31% margins.
S&P Global demonstrates similar strength. According to their 2024 10-K (fiscal year ending December 31, 2024):
S&P Global Ratings segment:
Segment Operating Profit: $2,707 million
Operating profit increased 45% year-over-year
S&P Global Market Intelligence segment:
Segment Operating Profit: $875 million
Operating profit increased 23% year-over-year
Compare these margins to most S&P 500 companies, where the median operating margin hovers around 10-12%. When you see businesses consistently running 30-60% operating margins, you’re looking at exceptional business models.
Why margins matter: High margins indicate pricing power. These companies don’t compete primarily on price. Customers pay for the value of the rating itself, the brand reputation, and regulatory acceptance. Both Moody’s and S&P expanded margins in 2024 despite inflationary pressures, demonstrating their ability to outpace cost increases.
Return on Invested Capital: The Gold Standard
ROIC measures how efficiently a company converts capital into profits. Calculate it as:
ROIC = NOPAT (Net Operating Profit After Tax) / Invested Capital
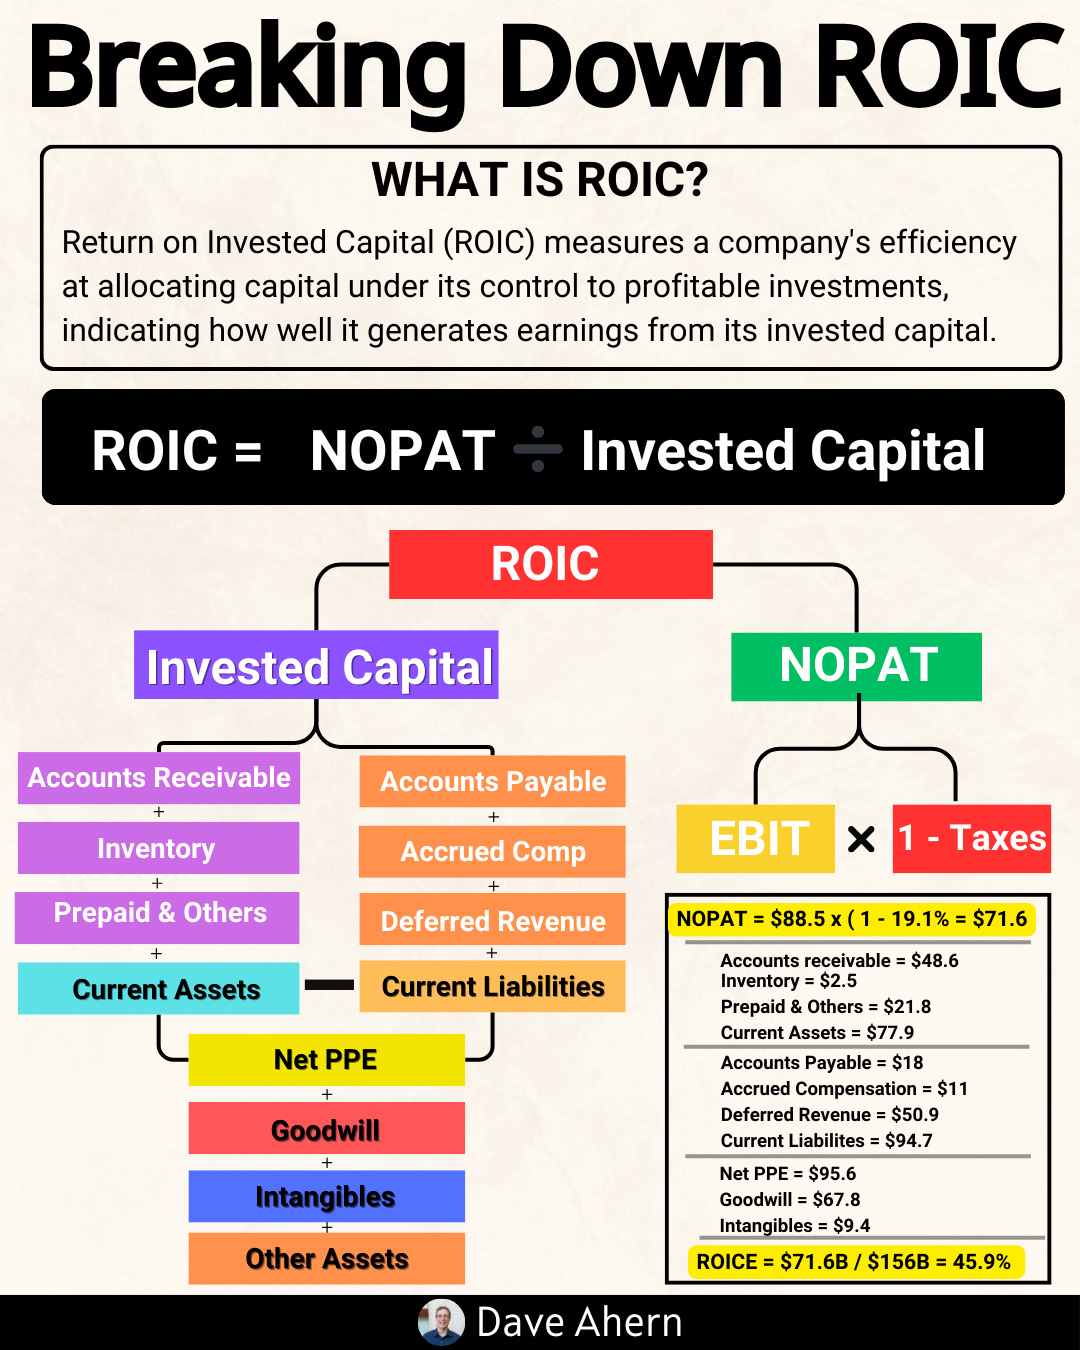
Where:
NOPAT = Operating Income × (1 - Tax Rate)
Invested Capital = Total Assets - Current Liabilities - Cash
For fiscal year 2024, Moody’s reported:
Operating Income: $2,875 million
Effective Tax Rate: 23.7%
NOPAT = $2,875 million × (1 - 0.237) = $2,194 million
According to Moody’s 2024 10-K balance sheet as of December 31, 2024:
Total Assets: $15,505 million
Current Liabilities: $5,290 million
Cash and short-term investments: $2,974 million
Invested Capital = $15,505 - $5,290 - $2,974 = $7,241 million
Moody’s ROIC = $2,194M / $7,241M = 30.3%
This is exceptional. A 30% ROIC means Moody’s generates 30 cents of after-tax profit for every dollar invested in the business.
S&P Global shows similar strength. From their 2024 10-K:
Operating Profit: $5,580 million
Effective Tax Rate: approximately 23%
NOPAT = $5,580 million × (1 - 0.23) = $4,297 million
[Note: Calculate exact invested capital using balance sheet data - Total Assets minus Current Liabilities minus Cash from S&P Global 2024 10-K to determine precise ROIC]
Why 20%+ ROIC matters: A company earning 30% ROIC that can reinvest even half its earnings at that rate will compound intrinsic value at 15% annually before any multiple expansion. That’s wealth creation. Most companies struggle to exceed their cost of capital (typically 8-10%). These rating agencies earn 3-4 times their cost of capital.
Cash Conversion: Profits You Can Bank
Accounting profits don’t always turn into cash. Quality businesses convert earnings into free cash flow consistently.
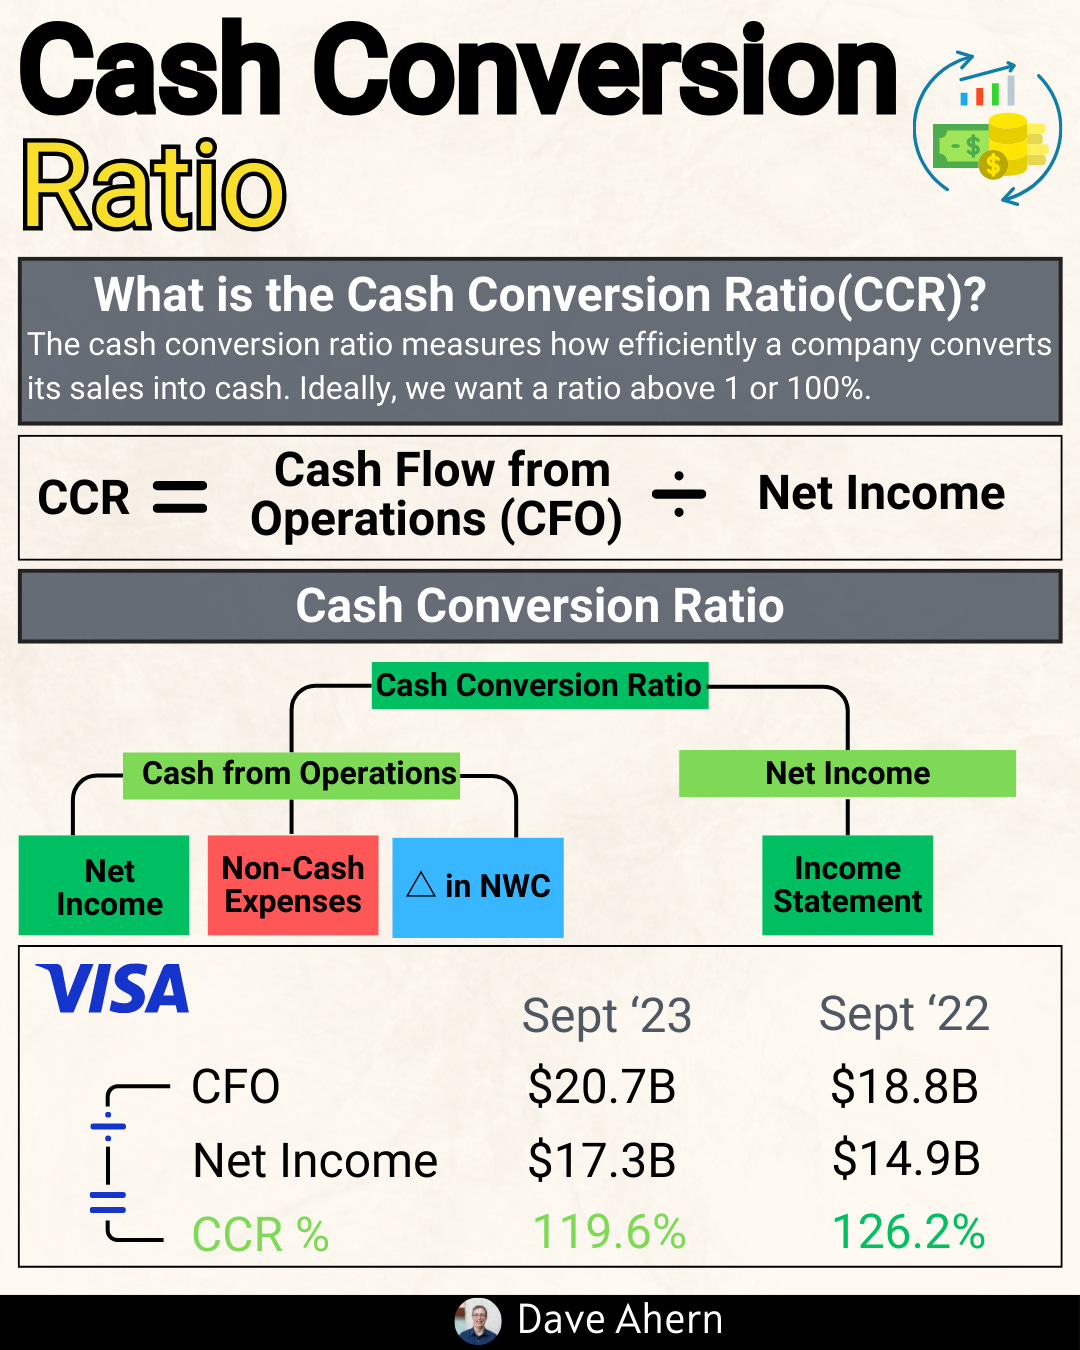
Free Cash Flow = Operating Cash Flow - Capital Expenditures
According to Moody’s 2024 10-K Cash Flow Statement for fiscal year 2024:
Operating Cash Flow: $2,838 million
Capital Additions: $317 million
Free Cash Flow: $2,521 million
Net Income: $2,059 million
FCF Conversion Rate: 122%
Moody’s generated more cash than accounting profits. This 122% conversion rate indicates negative working capital dynamics and non-cash charges exceeding capital needs.
For comparison, in 2023:
Operating Cash Flow: $2,151 million
Capital Additions: $271 million
Free Cash Flow: $1,880 million
FCF Conversion Rate: 117%
S&P Global demonstrates comparable cash-generating capacity. From their 2024 10-K:
Operating Cash Flow: [Verify from 2024 10-K Cash Flow Statement]
Capital Expenditures: [Verify from 2024 10-K]
Free Cash Flow: [Calculate]
What to look for: FCF conversion rates above 90% of net income signal businesses that don’t need to constantly reinvest in working capital or fixed assets. The rating agencies collect cash upfront or shortly after providing the service. Customers often prepay annual surveillance fees, creating favorable working capital dynamics.
Capital Requirements: Compounding Without Friction
Perhaps the most underappreciated quality indicator is how little capital a business requires to grow.
Moody’s capital intensity is remarkably low. From the 2024 10-K:
Revenue: $7,088 million
Capital Additions: $317 million
CapEx as % of Revenue: 4.5%
This $317 million primarily funds technology infrastructure and software development for Moody’s Analytics SaaS solutions. The MIS ratings business itself requires minimal capital. Most expenses are people (analysts) and technology.
For context, industrial businesses typically spend 4-8% of revenue on CapEx, retail 2-3%, and capital-intensive industries like utilities or manufacturing 8-15%. At 4.5%, Moody’s sits at the low end.
Low capital intensity means:
More cash available for dividends and buybacks
Ability to grow without dilution
Less reinvestment risk
Higher sustainable growth rates
Compounding works faster
From Moody’s 2024 10-K: “The Company is currently financing its operations, capital expenditures, acquisitions and share repurchases from operating and financing cash flows.” In other words, they’re self-funding growth while returning billions to shareholders.
Business Quality Characteristics
Financial metrics tell only half the story. The best businesses possess structural advantages that protect and extend their economic moats.
The Regulatory Moat
Credit ratings benefit from one of the strongest regulatory moats in finance. The Nationally Recognized Statistical Rating Organization (NRSRO) designation creates a sanctioned oligopoly.
From S&P Global’s 2024 10-K: “Ratings is subject to extensive regulation in the U.S. (including by state and local authorities), EU and in other countries... MIS is registered with the SEC as an NRSRO and is subject to the SEC’s oversight and examination authority.”
Moody’s 2024 10-K states: “MIS, certain of the Company’s credit rating affiliates, and many of the issuers and/or securities that MIS and the affiliates rate, are subject to extensive regulation in the U.S. (including by state and local authorities), EU, and in other countries.”
Regulations requiring certain institutional investors to hold only investment-grade bonds create embedded demand. Banks, insurance companies, and pension funds must hold rated securities to comply with capital requirements. This isn’t an optional demand—it’s structural.
The regulatory environment creates high barriers:
Registration Requirements: Becoming an NRSRO requires extensive SEC review
Track Record: New entrants need years of rating history
Scale Requirements: Global reach and analyst coverage are expensive
Reputational Barriers: Institutions won’t switch to unproven raters
Network Effects and Brand Value
A rating’s value increases with the number of market participants who use it. When every bond investor looks at Moody’s and S&P ratings, issuers must obtain those ratings to access capital markets efficiently.
This creates a virtuous cycle:
More issuers seek ratings to access investors
More investor attention reinforces rating importance
Higher barriers for new entrants
Sustained pricing power
From Moody’s 2024 10-K: “The key constituents Ratings serves are investors, corporations, governments, municipalities, commercial and investment banks, insurance companies, asset managers, and other debt issuers... Credit ratings are one of several tools investors can use when making decisions about purchasing bonds and other fixed income investments.”
The document describes Moody’s as having “played a leading role for over 150 years in providing investors with information and independent benchmarks.” This 150-year history creates brand value that can’t be replicated quickly.
Pricing Power: The Ultimate Quality Signal
Both companies demonstrated pricing power in 2024 despite challenging markets.
Moody’s MIS segment grew revenue 33% year-over-year, according to the 2024 10-K:
2024 MIS External Revenue: $3,793 million
2023 MIS External Revenue: $2,860 million
Growth: 33%
While part of this reflects higher issuance volumes, Moody’s maintained and expanded margins simultaneously, indicating that it raised effective prices alongside volume growth.
S&P Global Ratings segment showed similar strength:
2024 Ratings Operating Profit: $2,707 million
2023 Ratings Operating Profit: $1,864 million
Growth: 45%
Ask yourself: Could Moody’s or S&P raise surveillance fees 5% tomorrow? Almost certainly yes, with minimal customer defection. That’s pricing power. Companies don’t drop ratings because of modest price increases; the cost of being unrated far exceeds rating fees.
Compare this to most businesses, which face constant pricing pressure from competitors or powerful customers. Industries with true pricing power are rare.
Recurring Revenue Creates Stability
According to Moody’s 2024 10-K, recurring revenue provides stable cash flows:
“Transaction revenue primarily includes fees associated with ratings related to new issuance of corporate and government debt instruments, as well as structured finance debt instruments; and bank loan ratings.
Non-transaction revenue primarily includes fees for surveillance of a credit rating, annual fees for customer relationship-based pricing programs, fees for entity credit ratings and global research and analytics.”
The 10-K further states: “A substantial portion of MIS’s revenue is dependent upon the dollar-equivalent volume and number of ratable debt securities issued in the global capital markets. However, annual fee arrangements with frequent debt issuers, annual debt monitoring fees and annual fees from commercial paper and medium-term note programs, bank deposit ratings, insurance company financial strength ratings, mutual fund ratings, and other areas partially mitigate MIS’s dependence on the volume or number of new debt securities issued in the global fixed-income markets.”
For 2024, Moody’s recognized surveillance fees on approximately $74 trillion of outstanding rated debt (per 10-K). Even if new issuance stops, surveillance fees continue.
S&P Global has further diversified through Market Intelligence, Commodity Insights, Mobility, and Indices, creating multiple recurring revenue streams beyond ratings.
You now understand the financial metrics that define quality and the structural business advantages that protect it. Below the paywall, I'll show you the specific step-by-step quality checklist I use to evaluate any company, reveal the common mistakes that trap even experienced investors, and explain what quality metrics cannot tell you about risks.
