

Every month since June, our 5 Best Buys Now issue has named the five Universe names I’d buy that month.
A reader asked me a fair question over the summer. What would happen if someone bought every single one?
So we tracked it. Every pick, every month, bought at the closing price and held. We call it the Dividend Universe Portfolio, and today we look at the first five months.
In today’s post, we will discuss:
The rules
What the portfolio pays today
How fast the paycheck is growing
The scoreboard we keep
What happens on November 2
Okay, let’s dive in and look at five months of buying every Best Buy.
The rules
Writing the plan down before I need it is one habit that has kept me on track as an investor. So the portfolio got its rules before the first buy:
$500 a month, split evenly: $100 into each of that month’s five Best Buys
Bought the day after the issue goes out, at that day’s closing price, so the picks are public before the portfolio buys them
Every dividend reinvested
Held as if in a Roth IRA, so no taxes on the dividends (different for MLPs, if and when they get recommended)
No company with a Dividend Safety Score below 3.0 out of 5
One big caveat up front. This is a hypothetical portfolio. No real money changes hands.
My own money is a different story. I personally own 11 of the 16 companies.
What keeps it honest is that every buy is dated and priced at the close, and we don't sell or swap anything after the fact. The picks we got wrong stay in, right next to the ones we got right.
What the portfolio pays today
Five $500 buys put $2,500 to work. Those 25 picks landed in 16 companies, because a few names made the list more than once.
Here’s where we stand as of the October 20 close:
Invested: $2,500
Forward annual income: $79.95
Yield on cost: 3.20%
Dividends collected so far: $13.05 from 15 payments, all reinvested
How does that compare?
If we had put the same $500 into the S&P 500 (VOO) on the same five dates, that money would pay $26.79 a year, a 1.07% yield.
Scale it up to $10,000, and the gap is easier to see:
Dividend Universe Portfolio: $320 a year
S&P 500: $107 a year
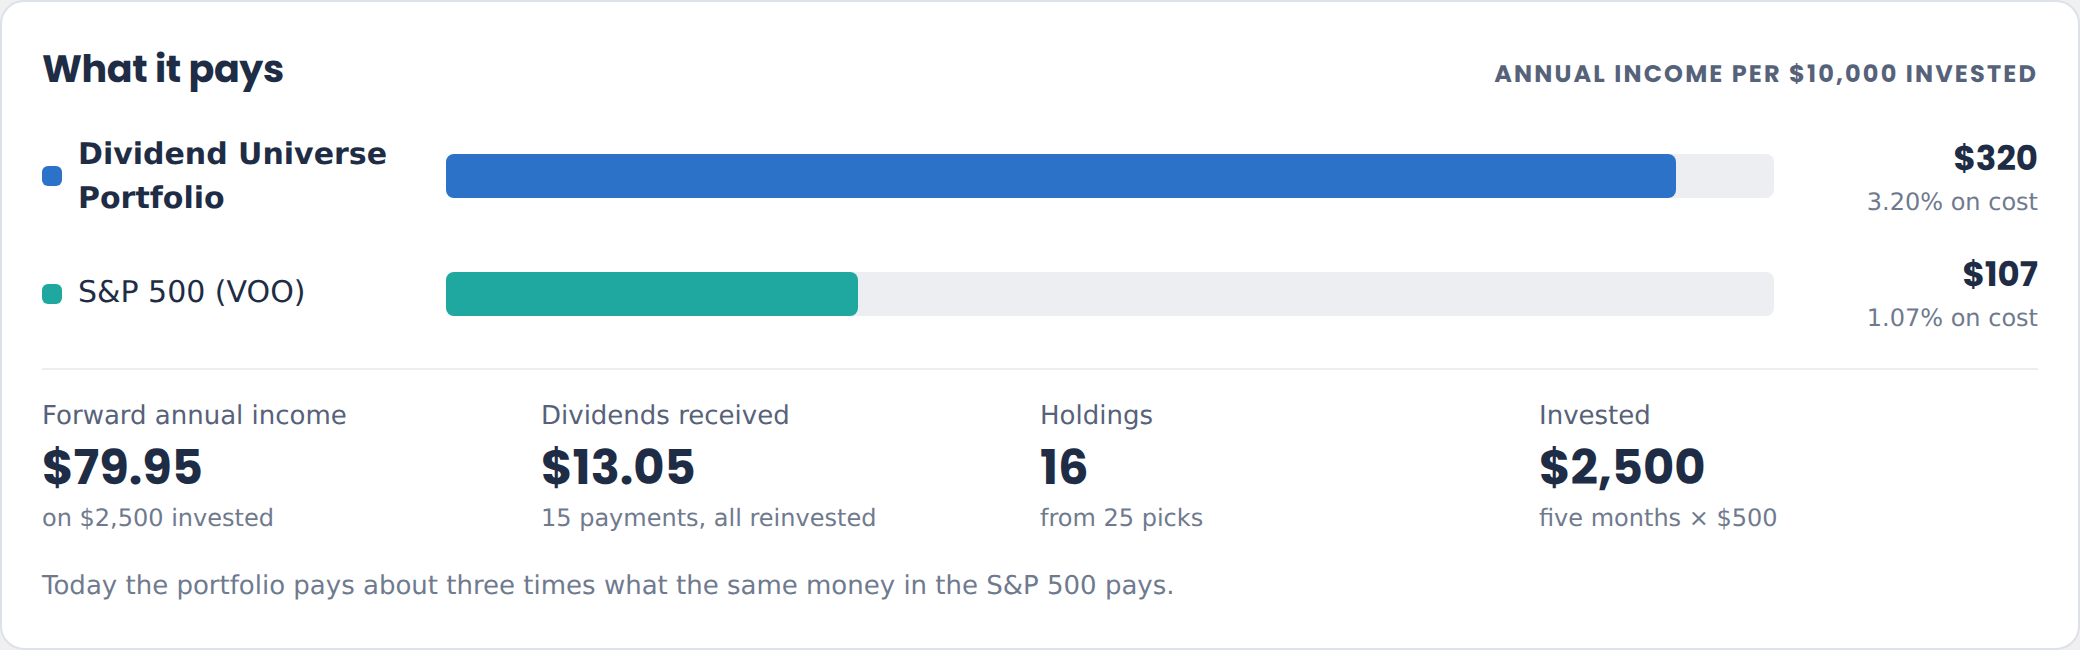
Three times the paycheck on the same money. That’s why we own dividend stocks.
Is 3.2% a big yield?
No, not by high-yield standards, and that’s on purpose. We aren’t chasing the biggest check today. We want a check that grows faster than prices, and that brings us to the next number.
How fast the paycheck is growing
A paycheck that doesn’t grow loses ground to prices every single year.
Over the last 12 months:
Our portfolio’s dividends grew 5.7%
The S&P 500’s dividends grew 5.6%
Inflation ran 3.7%
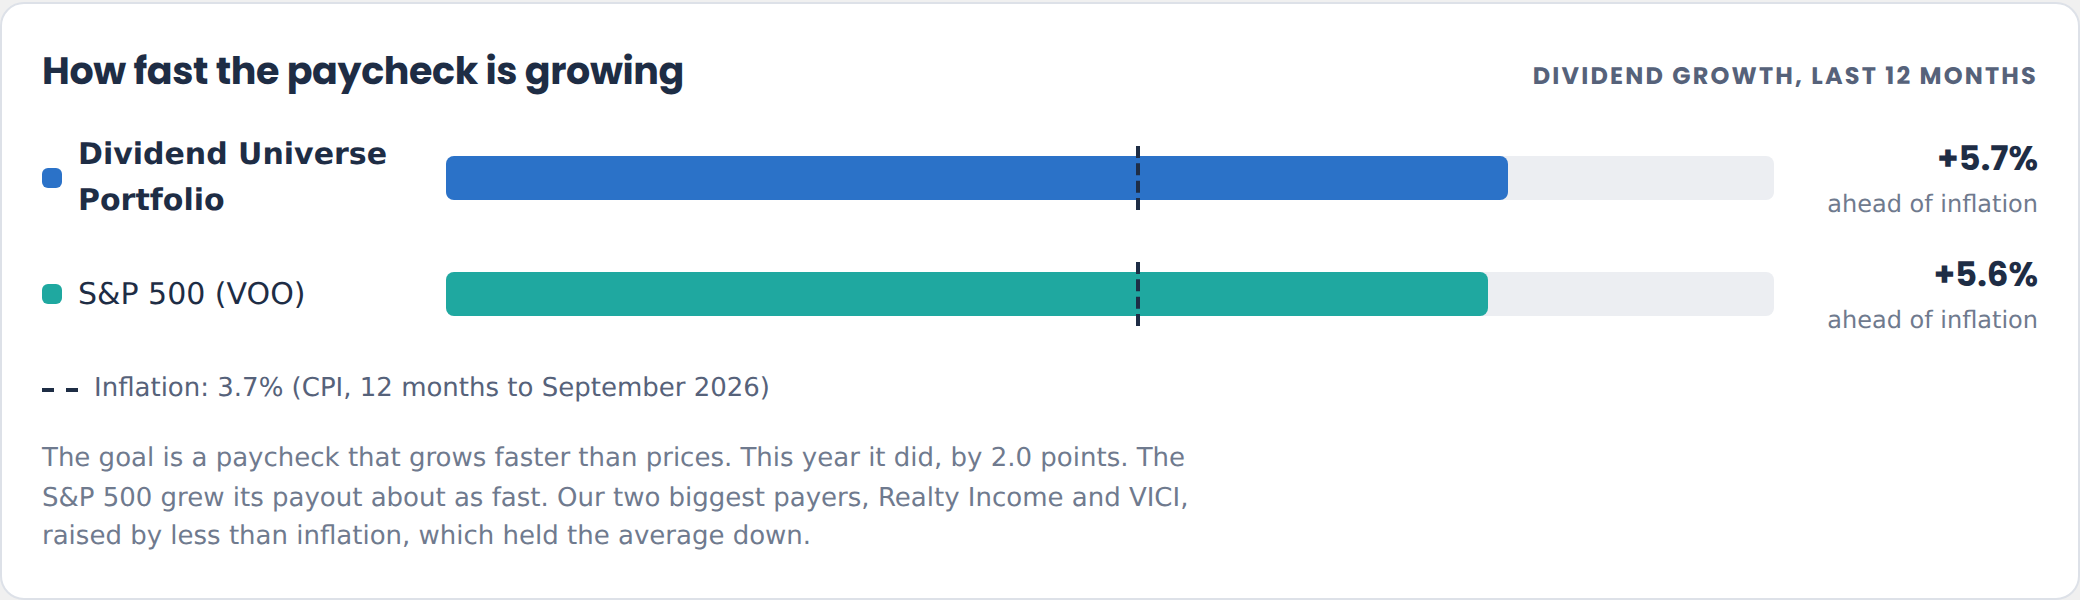
So the paycheck beat inflation by 2 points. Good, not great.
Why only about even with the S&P 500?
Our two biggest payers, Realty Income and VICI, raised by less than inflation this year, and because they pay the most, they pull the average down the most. Big yields with slow raises. Both are still doing their job: paying us every month and every quarter like clockwork.
The longer view is where the companies we own stand out. Over the last five years, they grew their dividends 11.2% a year, against 6.2% for the S&P 500. One year of slower raises from our two REITs doesn’t change that.
The scoreboard we keep
We run a different scoreboard here. It tracks the paycheck first:
15 of our 16 companies raised their dividend in the last 12 months
4 raises since we bought: Realty Income (twice), VICI, and Accenture
0 payments lower than the same payment a year earlier
Average Dividend Safety Score: 4.25 out of 5, with all 16 above our 3.0 floor
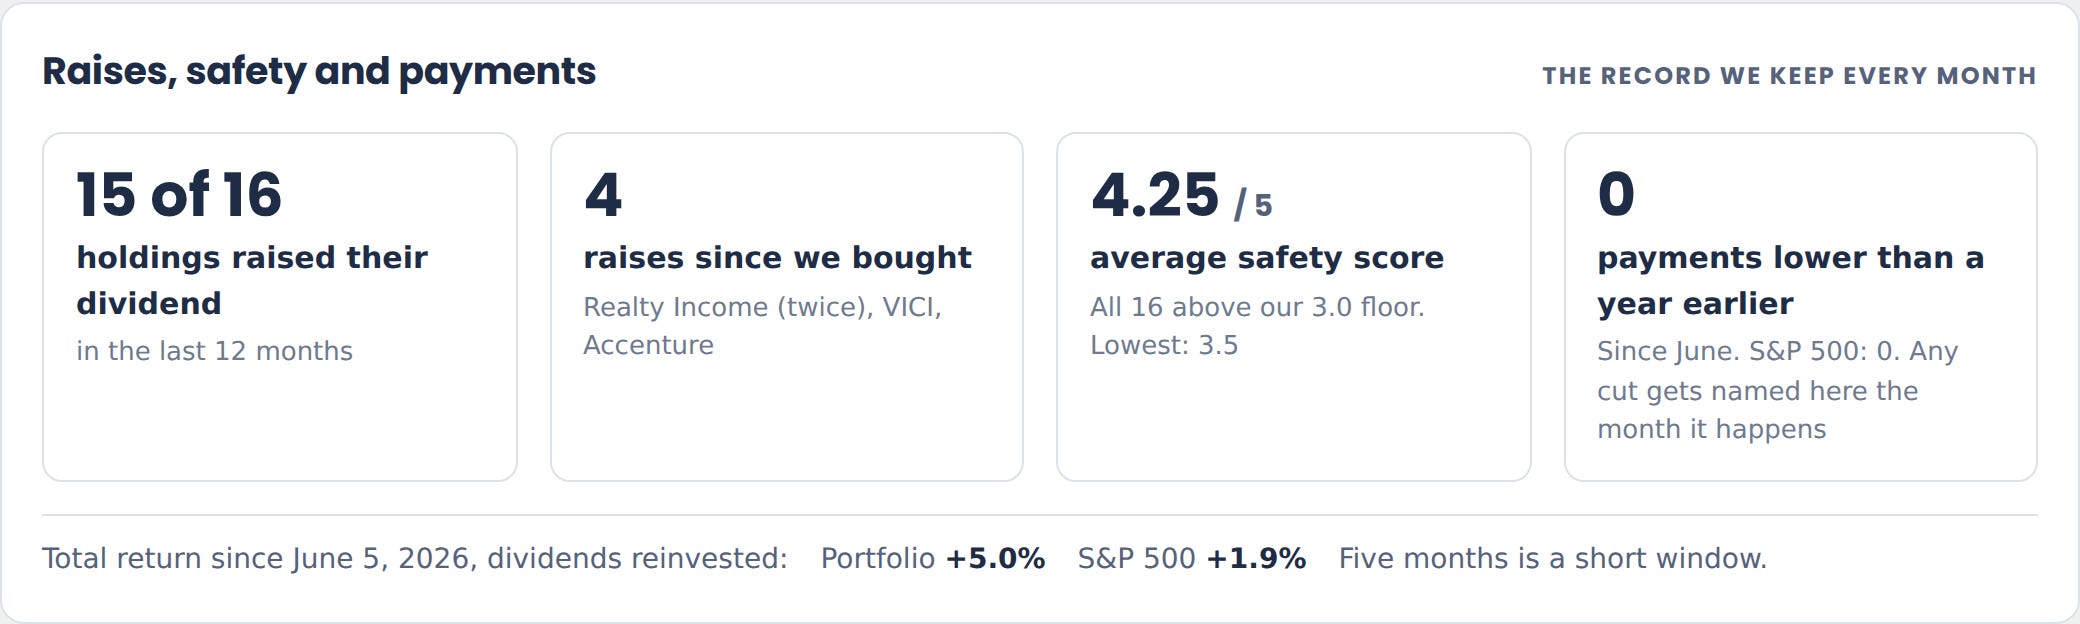
Zero cuts in five months is a short record. Any cut gets named on the scoreboard the month it happens, no matter which company it is.
And yes, the price.
The price matters when you buy, but it is not the metric we are judging ourselves on. We are not trying to beat the S&P; that’s not the game. The game is growing our income so we can enjoy our life. Understanding the game you are trying to play and measuring by that yardstick matters more.
We run the numbers on everything and always try to buy each company at the best price, sometimes with bigger margins of safety than others. Some companies offer safer growth and valuations, and some are more sensitive to rate changes (looking at your REITs) and other economic forces.
The process helps us find strong, safe, reliable companies that pay a growing dividend and have a long runway for continued growth. That is the ballgame.
What happens on November 2
The Dividend Universe Portfolio goes live on Monday, November 2.
From then on:
Every buy gets posted, dated, and priced at the close, the day after each Best Buys issue
The scoreboard updates every month, raises, cuts, and all
Everyone can see the summary page: dividend-universe-portfolio.vercel.app
Dividend School Pro members see every holding, every trade, and every dividend we collect
Next week I’ll walk through how it’s run and what the full version shows.
What would you want to see tracked that isn’t on the scoreboard yet? Hit reply and tell me.
If you have questions or want me to cover something in particular, please don’t hesitate to reach out.
Until next time, take care and be safe out there,
Dave
P.S. - Paid subscribers will get this automatically. You can find this in the Dividend Universe tab (after November 2nd), with links to the portfolio page so you can follow along.
The Dividend Universe Portfolio is hypothetical. No real money is invested, and none of this is investment advice. Figures as of the October 20, 2026 close. I personally own 11 of the portfolio’s 16 companies, including Realty Income, VICI, and Accenture.