
What are Base Rates and Why Do They Matter?

Finding reliable investment patterns remains one of the most challenging aspects of building wealth. We humans are terrible at predicting the future, yet we understand that historical probabilities, what we call base rates, can give us a significant edge in making better investment decisions.
Base rates tell us what typically happens, not what will happen. Think of them as the historical odds that help us calibrate our expectations. When a company claims it will grow revenue at 25% annually for the next decade, base rates help us understand just how rare that achievement would be.
In today’s post, we will learn:
What Are Base Rates and Why They Matter to Investors
How to Find and Use Base Rate Data
Real Company Examples: Microsoft, Amazon, and Netflix
The Growth Rate Reality Check
Building a Base Rate Framework for Your Investing
Common Base Rate Mistakes to Avoid
Investor Takeaway
Okay, let’s dive in and learn more about using base rates to become better investors.
What Are Base Rates and Why Do They Matter to Investors
According to behavioral economist Daniel Kahneman, “base rate neglect” remains one of the most common cognitive biases that lead to poor decision-making. In investing terms, base rates represent the historical frequency of specific outcomes—essentially, what percentage of companies achieve certain results over time.
Think of it this way: if someone tells you their startup will become the next Amazon, the base rate suggests that only about 0.1% of startups reach a billion-dollar valuation. Not impossible, but the odds remain heavily stacked against that outcome.
Base rates matter because they:
Anchor our expectations in reality
Help us spot overly optimistic projections
Provide context for evaluating management guidance
Allow us to assess the probability of various scenarios
I know it sounds complicated, but it isn’t. Base rates simply give us the historical scoreboard for what companies actually achieve versus what they claim they’ll achieve.
How to Find and Use Base Rate Data
The first step is to identify what metric you’re evaluating. Common base rates investors should know include:
Revenue growth rates by company size and industry
Profit margin sustainability
Success rates of turnarounds
Acquisition success rates
New product launch success rates
Where to find this data:
SEC filings for historical company performance
Academic research (particularly from business schools)
Industry reports from consulting firms
Historical market data from financial databases
The formula for calculating a base rate looks like this:
Base Rate = (Number of Successes / Total Attempts) × 100
Where:
Number of Successes = Companies that achieved the outcome
Total Attempts = All companies that tried
Not too hard, was it?
Real Company Examples: Microsoft, Amazon, and Netflix
Let’s use Microsoft, Amazon, and Netflix as our guinea pigs to understand how base rates apply to real companies.
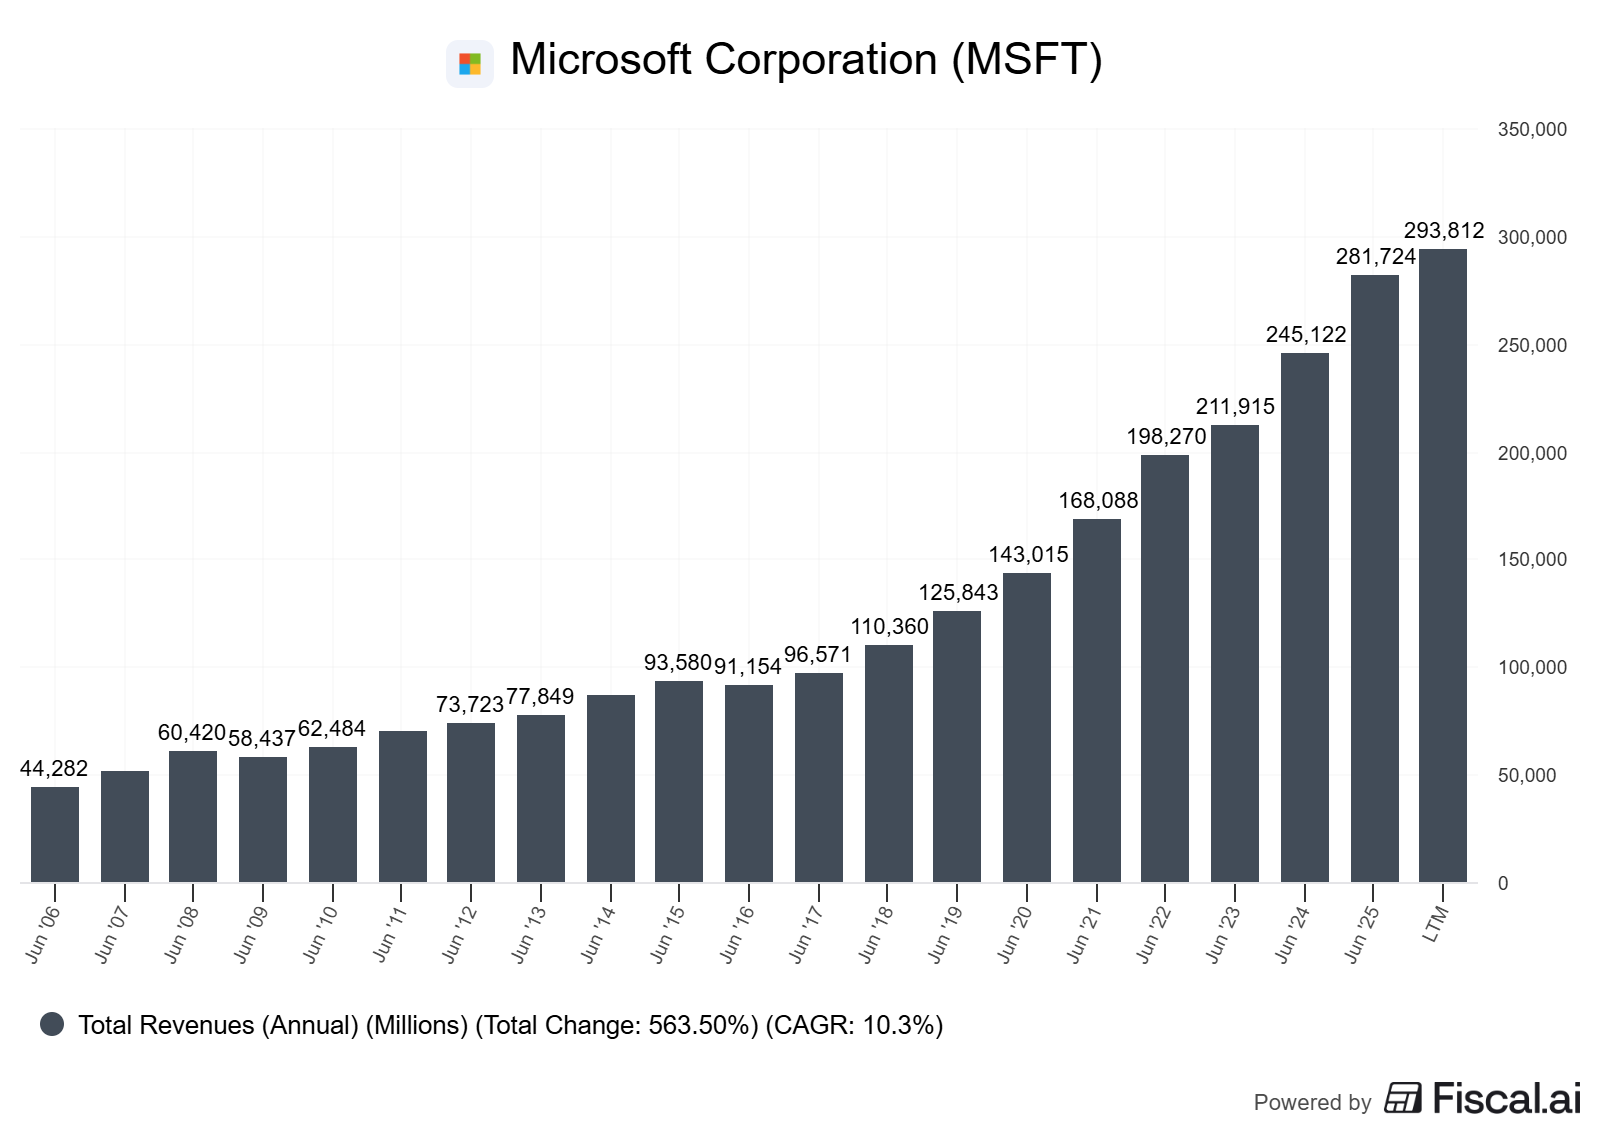
Microsoft (MSFT)
Using Microsoft’s 2024 10-K filing from sec.gov:
Current Market Cap: $3.67 trillion
FY 2024 Revenue: $245.1 billion
Revenue Growth Rate: 16%
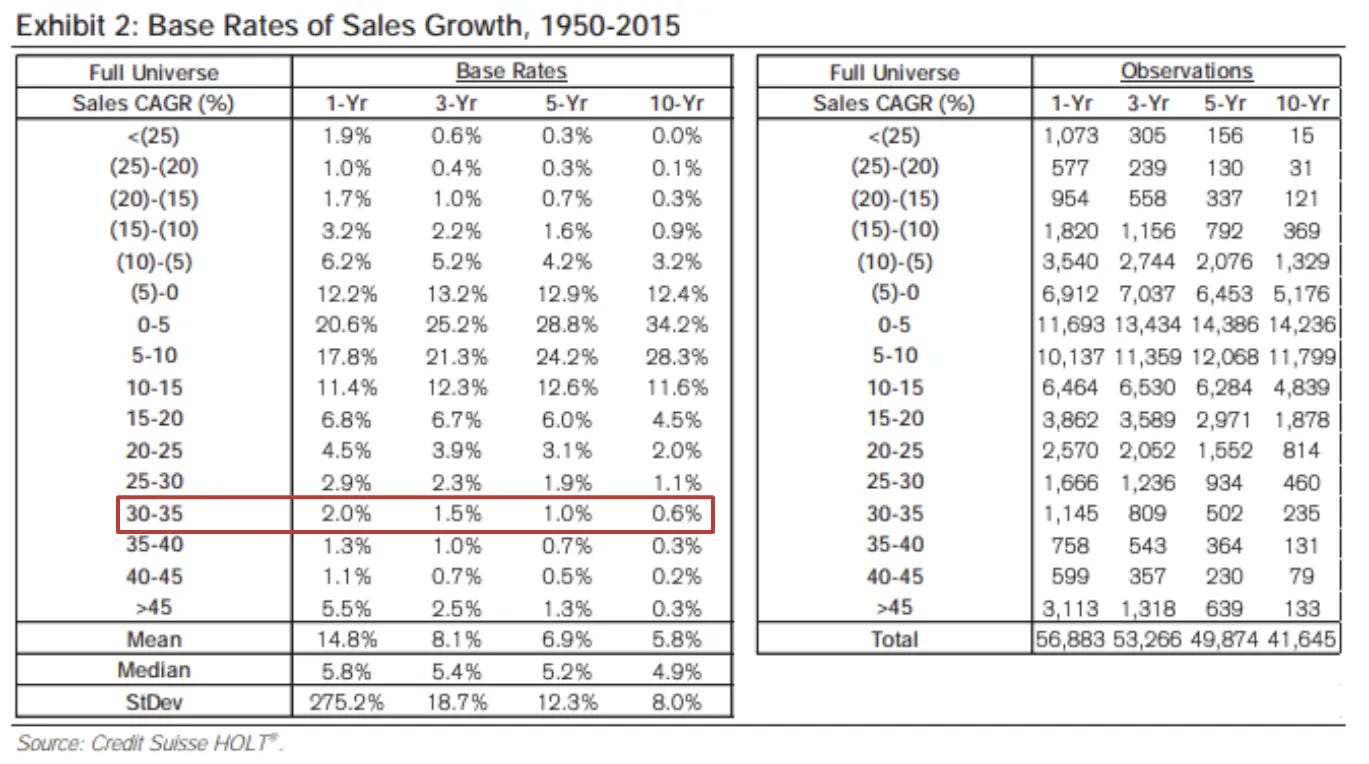
Microsoft’s 16% revenue growth in 2024 remains impressive for a company of its size. According to McKinsey research, only one in eight companies recorded growth rates of more than 10% per year McKinsey & Company. This puts Microsoft in the top 12.5% of all companies for growth.
But here’s where base rates become crucial: only one in three companies that were in the top quartile of growth between 2009 and 2014 managed to maintain that rate in the subsequent five-year period McKinsey & Company. This means Microsoft has about a 33% chance of maintaining this exceptional growth rate over the next five years.
Amazon (AMZN)
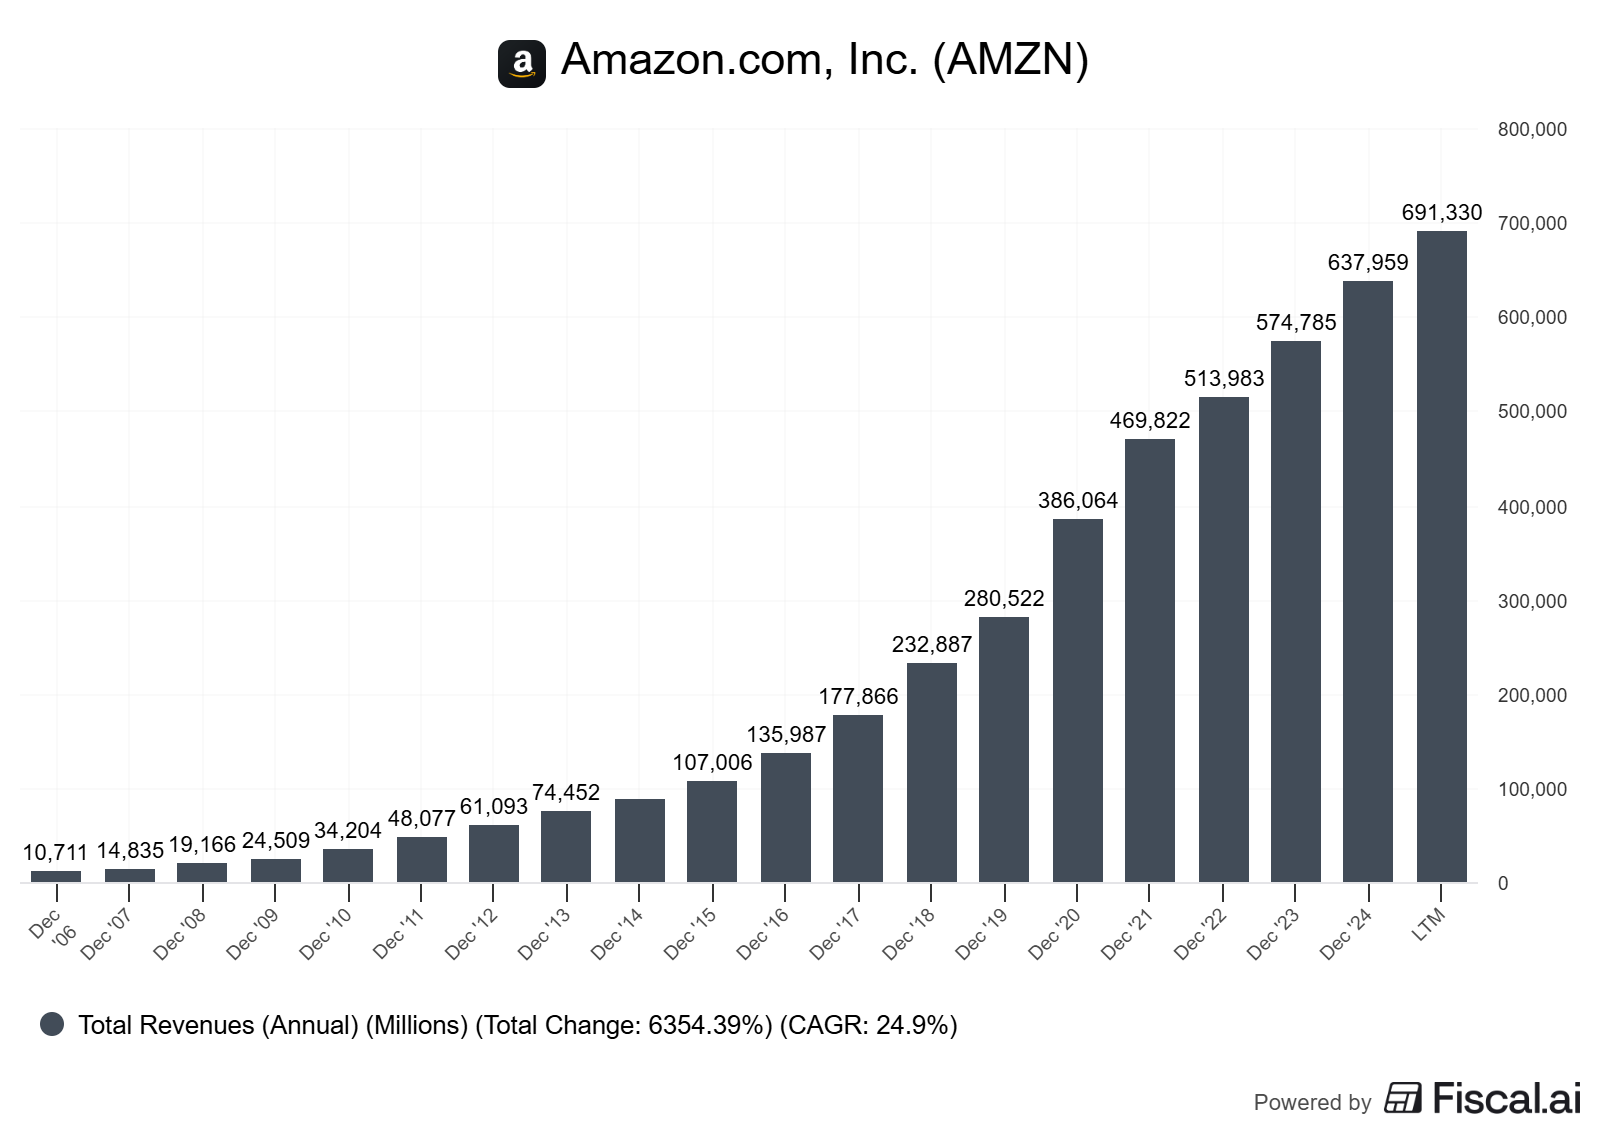
From Amazon’s 2024 10-K filing:
Current Market Cap: $2.38 trillion
2024 Revenue: $638.0 billion
Revenue Growth Rate: 11%
Amazon’s 11% growth rate also exceeds the base rate for large companies. The S&P 500’s average revenue growth currently sits at approximately 4-5%, with a 5-year average revenue growth rate of 6.9% FactSet. Amazon grows at roughly double the market average.
For context, Amazon Web Services (AWS) segment grew 19% year-over-year, while the retail segments grew around 10%. This demonstrates how different business segments can have vastly different base rates.
Netflix (NFLX)
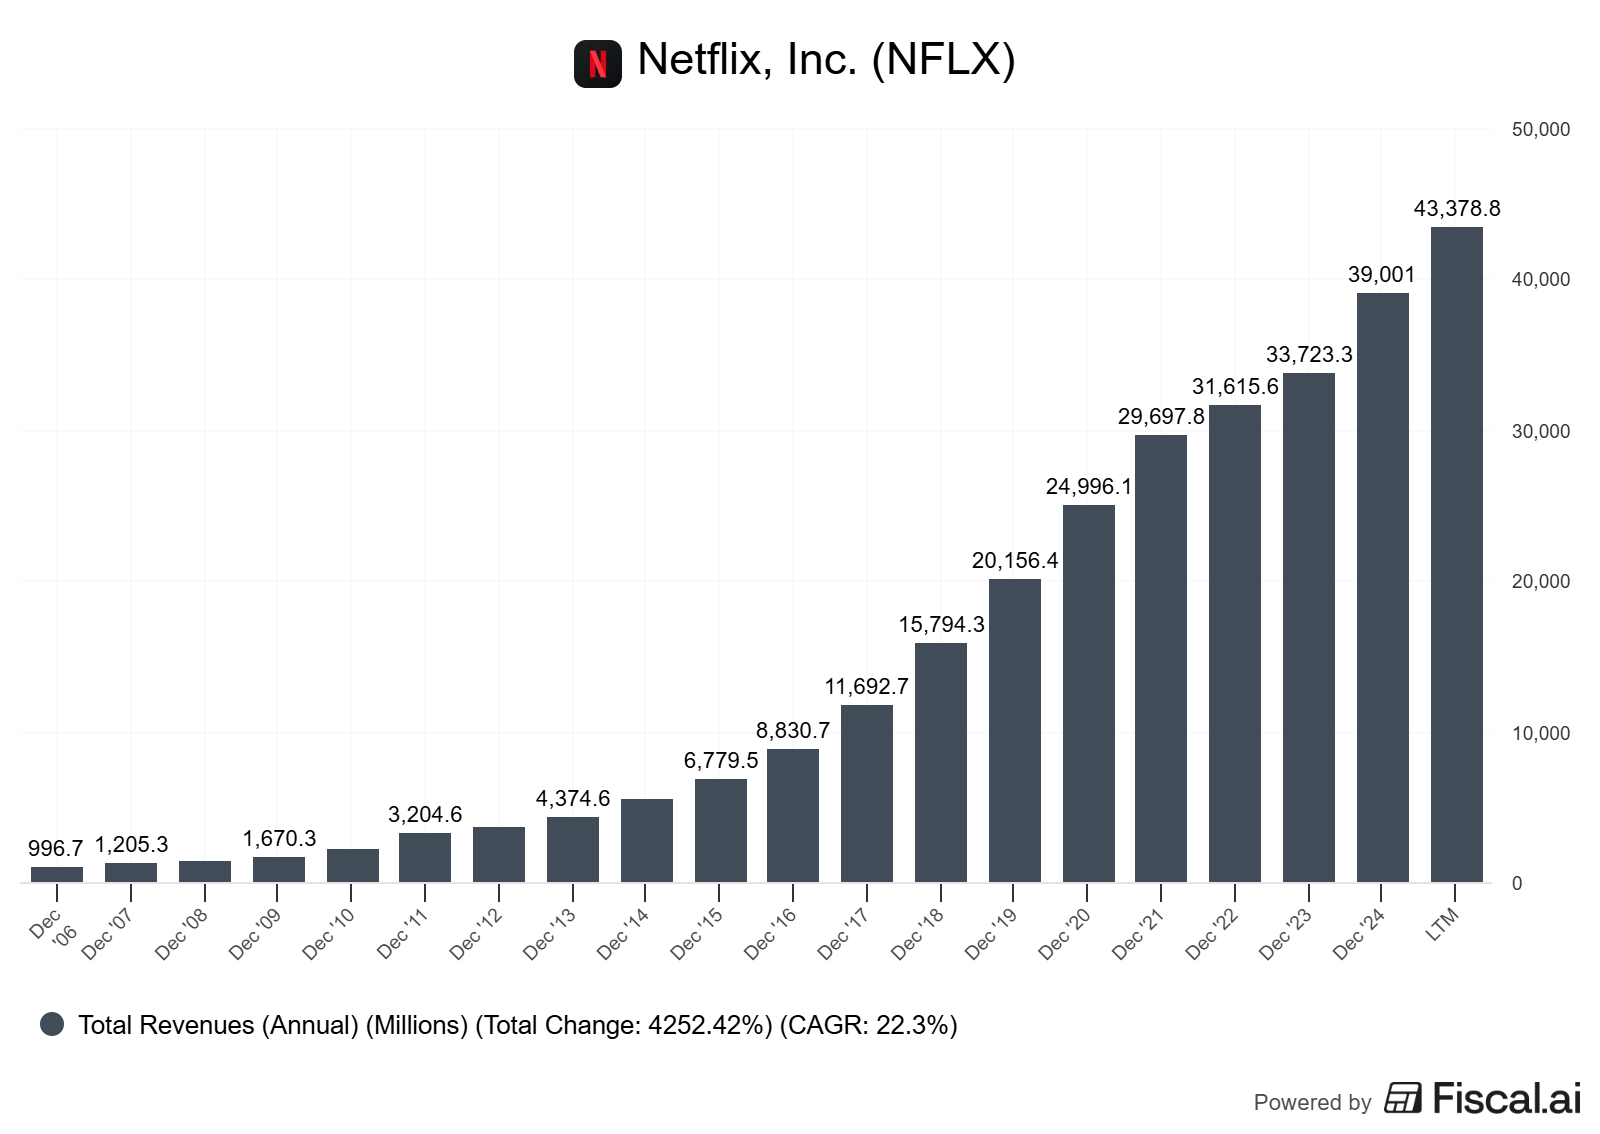
From Netflix’s 2024 10-K:
Current Market Cap: $484 billion
2024 Revenue: $39.0 billion
Revenue Growth Rate: 16%
Netflix’s 16% growth rate remains exceptional, but the streaming industry has different base rates than mature industries. For SaaS and subscription businesses, average revenue growth ranges from 15% to 45% year to year CloudZero, depending on company size.
Netflix, as a mature subscription business, sits at the lower end of this range—exactly where base rates suggest it should be for a company generating nearly $40 billion in revenue.
The Growth Rate Reality Check
Now that we understand individual company performance, let’s examine what base rates tell us about sustaining growth:
The Decay Rate Reality: Research from Bessemer Venture Partners found that revenue growth typically decays at 30% per year Mostly metrics. In other words, if a company grows 30% this year, expect 21% next year (70% of 30%), then 14.7% the following year.
Let’s apply this to our examples:
Microsoft at 16% growth:
Year 2 projection: 11.2%
Year 3 projection: 7.8%
Year 5 projection: 3.8%
Amazon at 11% growth:
Year 2 projection: 7.7%
Year 3 projection: 5.4%
Year 5 projection: 2.6%
Netflix at 16% growth:
Year 2 projection: 11.2%
Year 3 projection: 7.8%
Year 5 projection: 3.8%
These projections don’t mean these companies will definitely slow down—they might beat the base rates. But history suggests most companies follow this pattern.
Building a Base Rate Framework for Your Investing
Here’s how to incorporate base rates into your investment process:
Step 1: Identify the Key Metrics
For the company you’re analyzing, determine which metrics matter most:
Revenue growth
Margin expansion
Return on invested capital
Free cash flow growth
Step 2: Find Historical Base Rates
Research what percentage of companies in that industry and size category achieve various levels of performance. The S&P 500 provides good baseline data.
Step 3: Compare Management Projections to Base Rates
If management projects 20% annual growth for five years, but the base rate shows only 5% of similar companies achieve this, adjust your expectations accordingly.
Step 4: Assign Probabilities
Instead of binary thinking (will succeed/won’t succeed), use base rates to assign probabilities:
60% chance of 5-10% growth (base case)
30% chance of 10-15% growth (optimistic case)
10% chance of 15%+ growth (best case)
Step 5: Value Using Multiple Scenarios
Calculate valuations under each scenario, weighted by probability. This gives you a more realistic range of outcomes.
Common Base Rate Mistakes to Avoid
Mistake 1: Ignoring Company-Specific Factors
Base rates provide context, but some companies genuinely are exceptional. Warren Buffett calls these companies with “economic moats.” Microsoft’s dominance in enterprise software, for instance, might allow it to beat typical base rates.
Mistake 2: Using Wrong Comparison Groups
Comparing Netflix’s growth rate to utility companies makes no sense. Always use appropriate peer groups—similar size, industry, and business model.
Mistake 3: Assuming Base Rates Never Change
Technology can shift base rates. The internet enabled growth rates previously impossible. AI might do the same. But be careful, every generation thinks “this time is different,” and usually it isn’t.
Mistake 4: Over-Precision
Base rates give us general probabilities, not precise predictions. Think in ranges and scenarios, not exact numbers.
Investor Takeaway
Understanding base rates remains one of the most powerful tools for avoiding investment mistakes. They don’t tell us what will happen, but they tell us what typically happens—and that knowledge helps us make better decisions.
When evaluating any investment, always ask: “What do base rates tell me about the probability of this outcome?” Companies that beat base rates consistently, like Microsoft growing at 16% despite its massive size, deserve premium valuations. Companies projecting growth far above base rates without compelling evidence should be viewed skeptically.
Remember that base rates are guides, not guarantees. Some companies will beat them, but most won’t. As Charlie Munger says, “It is remarkable how much long-term advantage people like us have gotten by trying to be consistently not stupid, instead of trying to be very intelligent.”
Using base rates helps us be “consistently not stupid” by anchoring our expectations in historical reality rather than hopeful projections.
The bottom line remains that successful investing requires balancing optimism with realism. Base rates provide that reality check, helping us distinguish between probable outcomes and wishful thinking. They won’t make you rich overnight, but they will help you avoid the costly mistakes that come from believing every growth story you hear.
If you want to dig deeper into this topic, the gold standard is Michael Mauboussin’s Base Rate book. I highly recommend you give it a read at least twice.
With that, we will wrap up our discussion today.
As always, thank you for taking the time to read today’s post, and I hope you find something of value in your investing journey.
If I can further assist, please don’t hesitate to reach out.
Until next time, take care and be safe out there,
Dave
learned something new!