
Want a Dividend Check Every Month? Here's the 5-Step Ladder I'd Build.
Most US companies pay quarterly. Here's how to combine 9 of them into 12 monthly checks.

Most US companies pay dividends quarterly, but your bills arrive monthly. That gap creates a real planning problem for income investors, especially retirees who use dividends to fund living expenses.
A dividend ladder fixes the timing mismatch. Build it right, and you can turn a portfolio of quality businesses into a paycheck that lands in your account every month of the year.
In today’s post, we will discuss:
What a dividend ladder actually is
The two ways to build one
A five-step framework you can use this weekend
Position sizing math for level monthly income
The mistakes that wreck most dividend ladders
Okay, let’s dive in and build the ladder.
What a dividend ladder actually is
A dividend ladder is a portfolio structured so dividend payments arrive in every month of the year. Nothing more complicated than that.
The mechanism is simple. Most US companies pay quarterly, but they don’t all pay in the same months. By combining stocks with offset payment schedules, or by adding monthly-paying REITs and BDCs to the mix, you can smooth quarterly lumps into a monthly stream.
Why does this matter?
Three reasons. First, it lets your portfolio income mirror the cadence of your expenses. Second, it gives you cash to reinvest more often, compounding faster through DRIP programs. Third, it forces sector diversification across payment cycles, which is healthy discipline.
The ladder is a structure. Quality of the underlying businesses is still what matters most.
A monthly income stream built from five terrible companies is still terrible income.
US dividend payment cycles
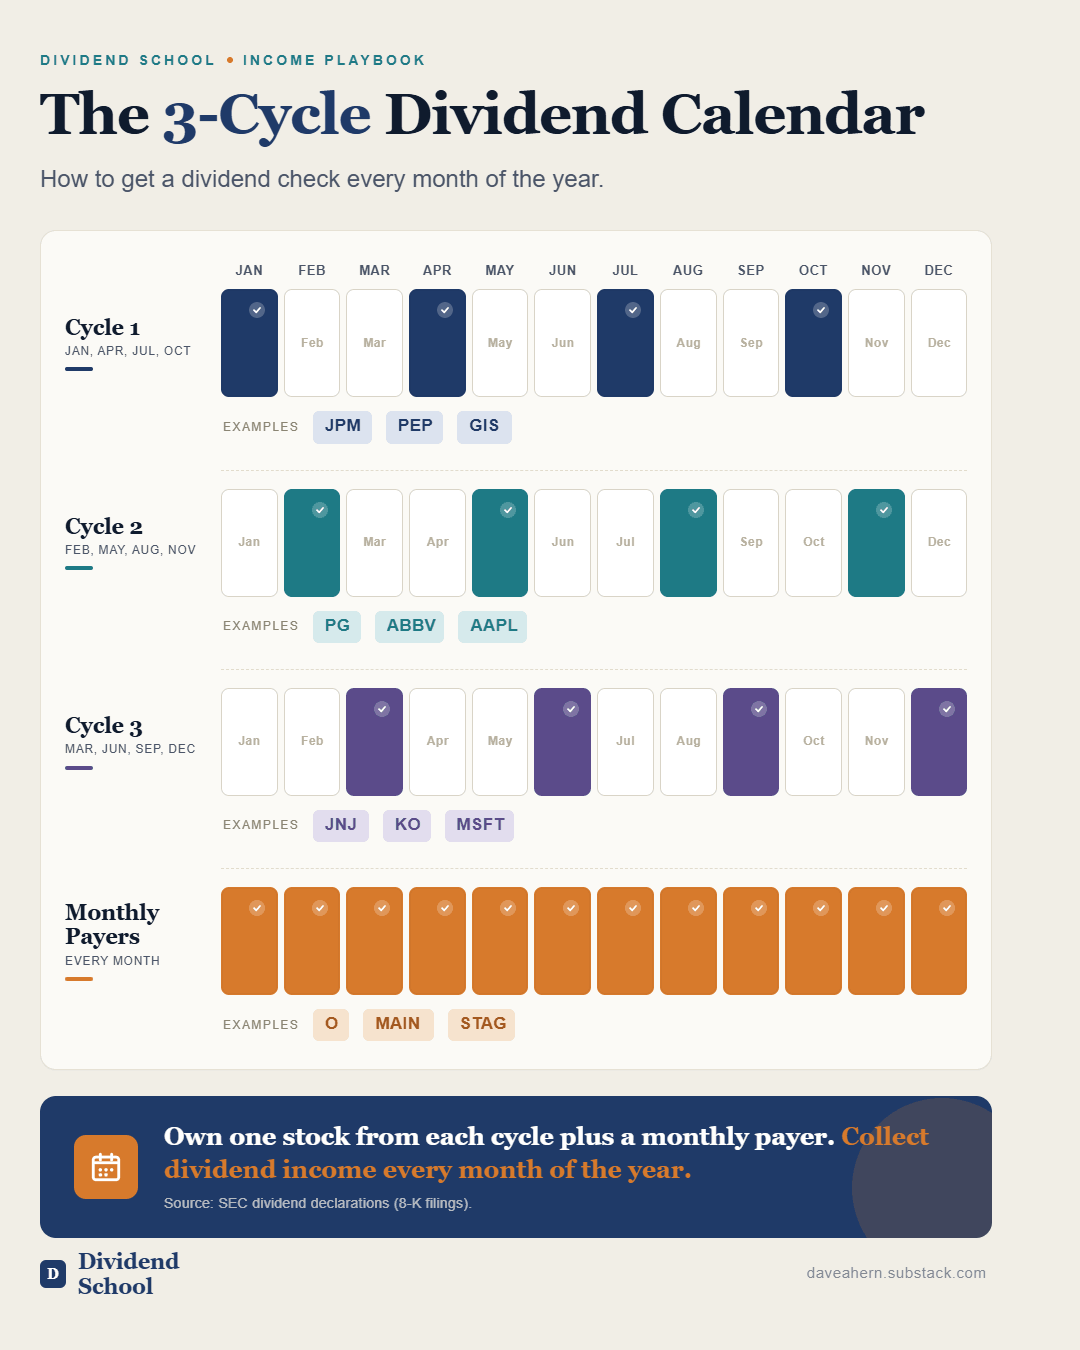
Most US companies fall into one of three quarterly payment cycles. Knowing the cycles is the foundation of the whole approach.
The three cycles look like this:
Cycle 1: January, April, July, October
Cycle 2: February, May, August, November
Cycle 3: March, June, September, December
Familiar names in each cycle:
Cycle 1: JPMorgan Chase (JPM), General Mills (GIS), PepsiCo (PEP)
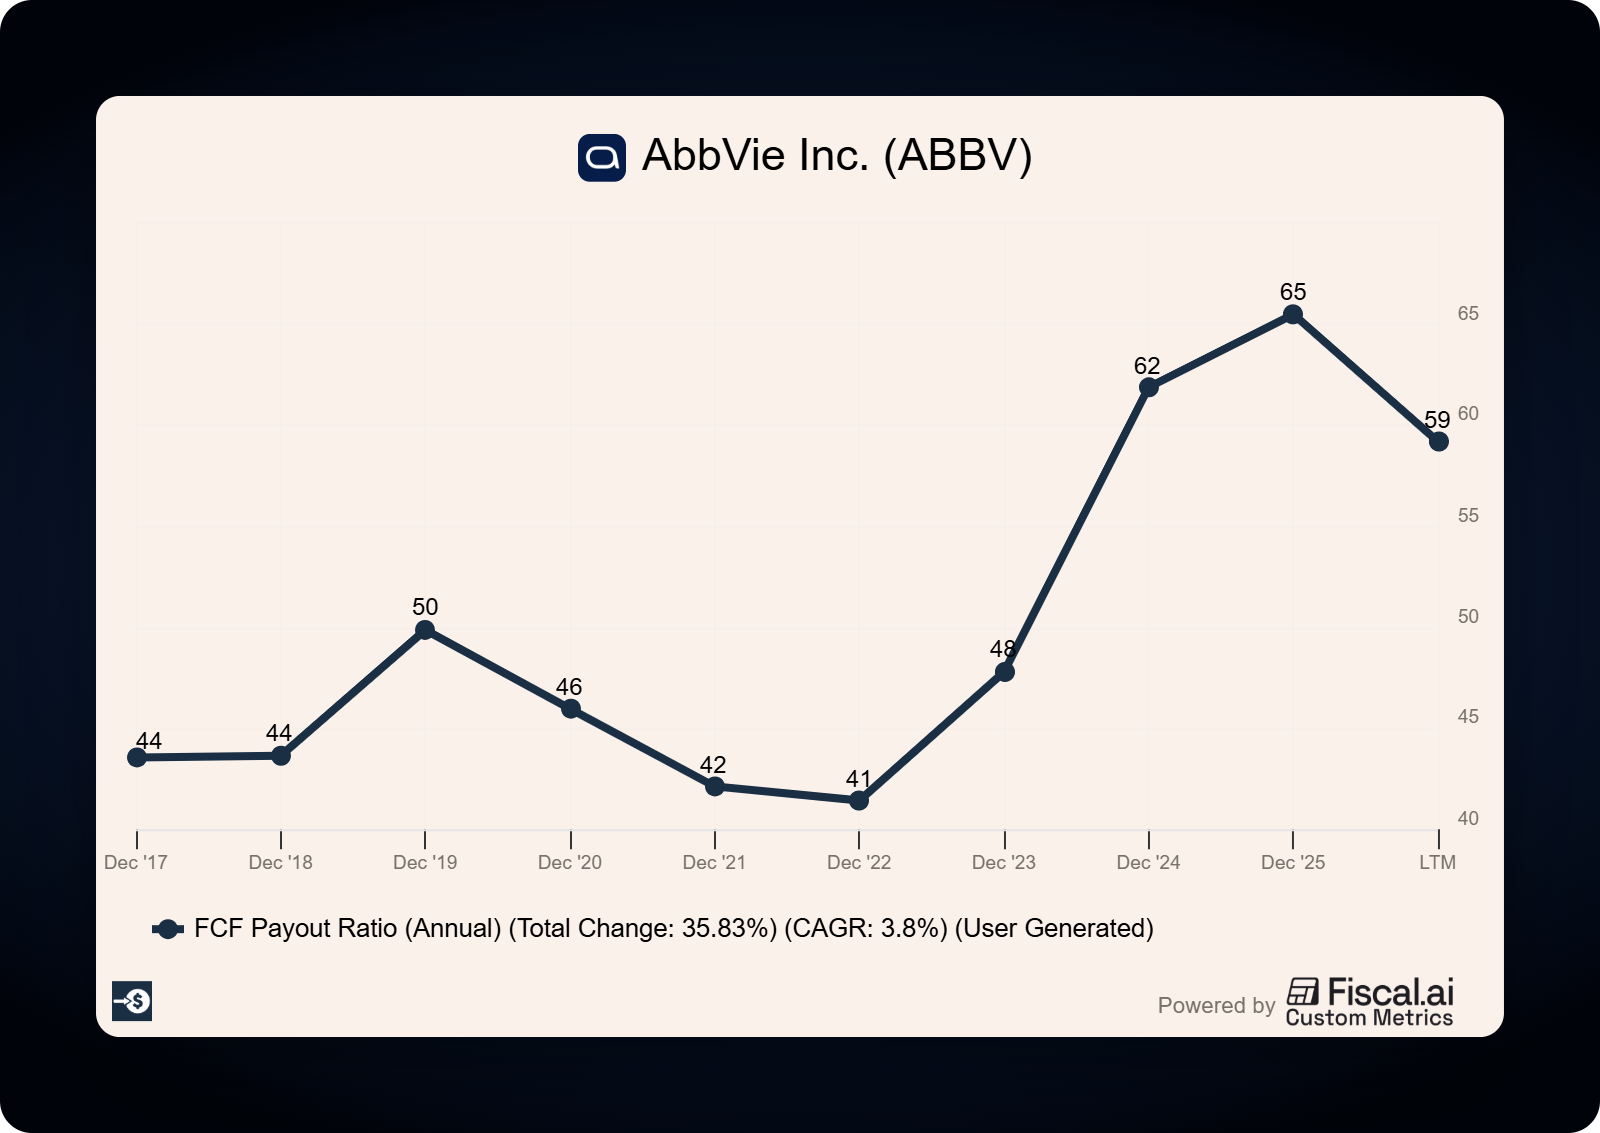
Cycle 2: Procter & Gamble (PG), AbbVie (ABBV), Apple (AAPL)
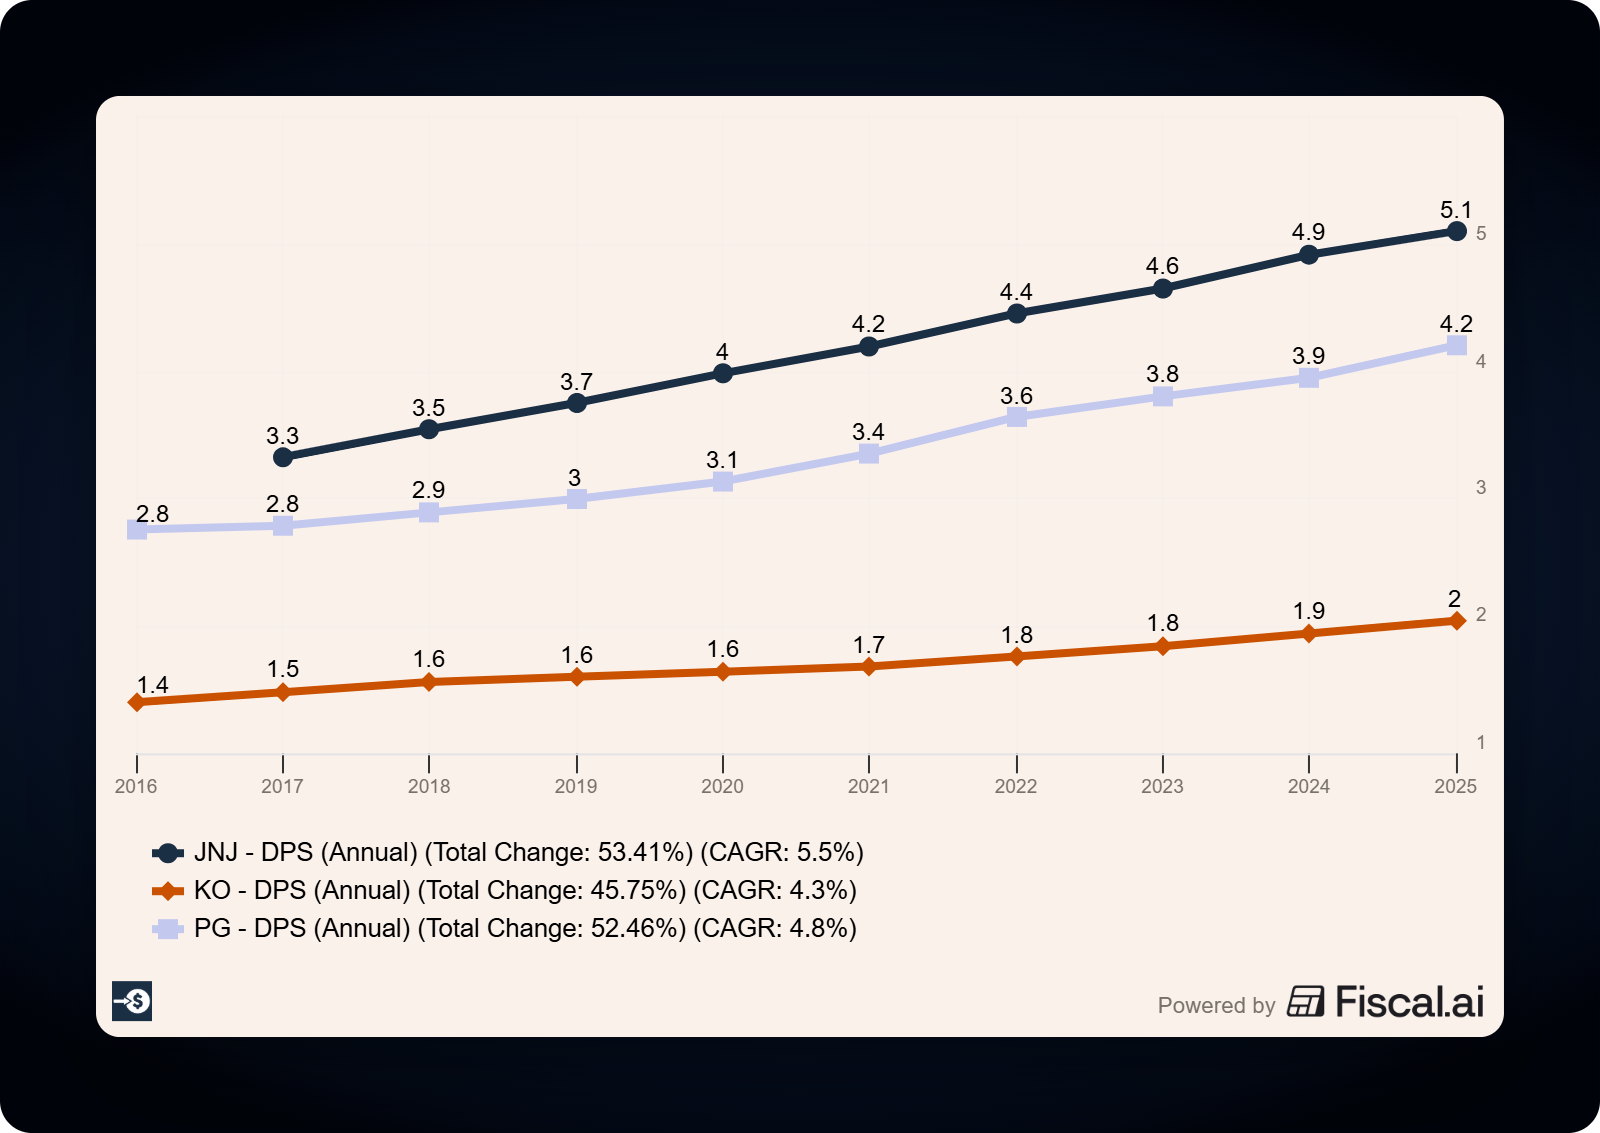
Cycle 3: Johnson & Johnson (JNJ), Coca-Cola (KO), Microsoft (MSFT)
A few companies break the mold. Realty Income (O) pays monthly, as do several other REITs and BDCs. Some ADRs pay semi-annually. The three cycles above still cover the vast majority of dividend-paying US companies.
If you own one stock from each cycle, you collect a dividend every single month of the year. That is the basic ladder.
The two ways to build a dividend ladder
There are two paths to monthly income, and most investors use a blend of both.
Path one: offset quarterly payers. Hold three or more dividend stocks across the three cycles. The simplest version is one stock per cycle, but a real ladder usually holds two or three per cycle for diversification and safety. This is the path most retail investors take because it lets them own the high-quality dividend names they already want to own.
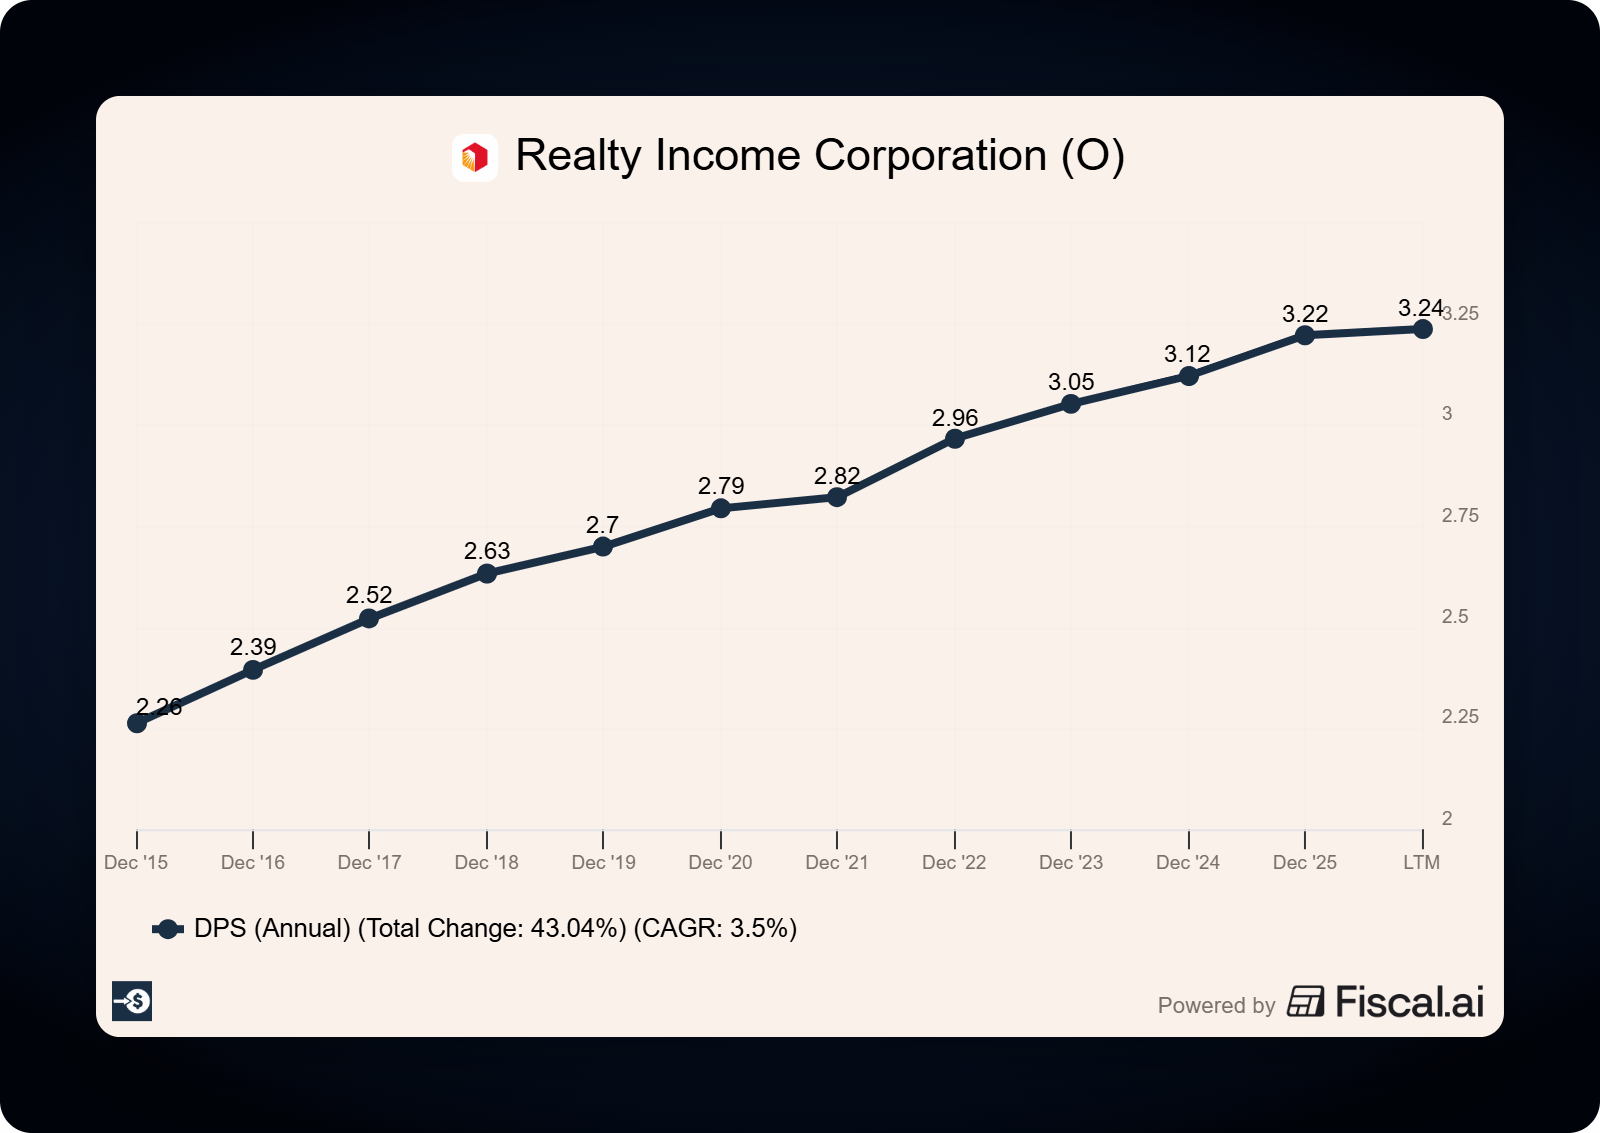
Path two: monthly payers. Hold REITs and BDCs that pay monthly by structure. Realty Income (O) is the textbook example, with [109 consecutive quarterly dividend increases as of December 2024, verify current count from latest Realty Income 8-K] and a monthly payment cadence baked into its brand identity. STAG Industrial (STAG), Main Street Capital (MAIN), and Pembina Pipeline (PBA) also pay monthly.
The blended approach is what I prefer. Two or three quality monthly payers anchor the base, then six to nine quarterly payers across the three cycles fill in the rest. You get the smoothing benefit of monthly payers and the deeper bench of quality names from the quarterly group.
If the 3-cycle calendar above is the kind of thinking you want more of, the free newsletter sends one a week. Other patient dividend investors are already there.
The five-step framework
Here is the framework I use to build a dividend ladder from scratch. Five steps, applied in order.
Step 1: Map your income target to dividend yield
Start with the dollar number you want each month. Multiply by 12 for the annual target.
Now divide that annual target by the average yield of your candidate portfolio to find the capital required.
A worked example:
Monthly income target: $1,000
Annual income target: $12,000
Average portfolio yield: 4.0%
Capital required: $12,000 / 0.04 = $300,000
That math is the reality check. Most investors underestimate how much capital it takes to generate meaningful monthly income at safe yields. A 4% yield is realistic for a quality dividend portfolio. A 7% or 8% yield usually signals either yield traps or higher-risk securities.
Step 2: Screen for dividend quality, not yield
This is the step most investors skip, and it is the reason most dividend ladders blow up over time.
The quality screen looks at five things:
Payout ratio (free cash flow basis): ideally under 75% for most sectors, under 85% AFFO basis for REITs
Dividend growth track record: at least 5 consecutive years of increases for non-REITs
Free cash flow coverage: FCF covers the dividend by at least 1.3x
Debt: net debt to EBITDA under 3.5x for most sectors, under 6x for REITs
Earnings stability: revenue and earnings consistent over the last 5 years
A stock yielding 9% with a payout ratio above 100% is not a high-yield gem. It is a dividend cut waiting to happen.
I look at the payout ratio first. If a company is paying out more in dividends than it generates in free cash flow, the gap is funded by debt or asset sales. Neither is sustainable.
Step 3: Pick two to three names per cycle
Once your candidate list is filtered for quality, distribute it across the three payment cycles.
A starter ladder looks something like this:
Cycle 1 (Jan/Apr/Jul/Oct): one staples name plus one financial
Cycle 2 (Feb/May/Aug/Nov): one tech name plus one healthcare
Cycle 3 (Mar/Jun/Sep/Dec): one healthcare plus one consumer
Monthly payers: one or two REITs or BDCs
The goal of two or three names per cycle is sector diversification. If your Cycle 3 names are all consumer staples, a sector downturn hits a third of your income at once.
Step 4: Size positions for level monthly income
This step is the difference between an amateur dividend ladder and a real one.
The naive approach is equal dollar weighting. Buy $30,000 of each of ten stocks. The problem is that yields differ widely, so equal dollar weights produce uneven monthly income.
The better approach is equal income weighting. Size each position so each stock contributes roughly the same dollar amount per cycle.
Worked example, targeting $250 quarterly per position:
Stock A yields 3.0%: requires $33,333 ($250 / 0.0075 quarterly rate)
Stock B yields 5.0%: requires $20,000 ($250 / 0.0125 quarterly rate)
The same target income requires very different capital allocations. Position size to the income you want, not to the share count or dollar amount that feels balanced.
A practical limit is to cap any single position at 5% to 7% of the portfolio. Going above that concentrates risk too tightly on one company. Even the best dividend payers can stumble. AT&T (T) cut its dividend by roughly 47% in 2022 after the WarnerMedia spinoff [verify exact reduction from AT&T 2022 10-K], and that move blew up income for anyone who had over-concentrated in the name.
Step 5: Verify the calendar before you buy
The last step is the one that catches most new dividend investors by surprise.
Ex-dividend date and payment date are different things. If you buy a stock after its ex-dividend date, you do not collect that quarter’s payment.
Always check three dates on each candidate:
Ex-dividend date: must own shares before this date to collect the next payment
Record date: the day the company confirms ownership for the dividend
Payment date: when the cash hits your account
Each company publishes these dates in 8-K filings when they declare a dividend. Investor relations pages list them in plain English.
I keep a simple spreadsheet with the ex-dividend dates for each holding. It takes 10 minutes a quarter to update and saves the occasional missed payment.
A sample 9-stock ladder
Here is what a starter ladder looks like in practice. Yields are placeholders to be verified from the latest declarations on sec.gov.
Cycle 1 (pays Jan/Apr/Jul/Oct):
JPMorgan Chase (JPM): [Insert current yield from latest dividend 8-K]
PepsiCo (PEP): [Insert current yield]
Cycle 2 (pays Feb/May/Aug/Nov):
Procter & Gamble (PG): [Insert current yield]
AbbVie (ABBV): [Insert current yield]
Cycle 3 (pays Mar/Jun/Sep/Dec):
Johnson & Johnson (JNJ): [Insert current yield]
Microsoft (MSFT): [Insert current yield]
Coca-Cola (KO): [Insert current yield]
Monthly payers:
Realty Income (O): [Insert current yield]
Main Street Capital (MAIN): [Insert current yield]
That mix gives you nine income streams across eight sectors, hitting your account every single month.
Common mistakes that wreck dividend ladders
Three mistakes show up over and over in dividend ladder portfolios. Watch for them.
Chasing yield. A 9% yield is rarely a gift. More often it signals the market expects a cut, or the underlying business is in trouble. Annaly Capital Management (NLY), an mREIT, has cut its dividend multiple times over the past decade despite a long history of high reported yields [verify cut history from NLY 10-K filings]. Yield is the reward for risk. Always check the risk first.
Ignoring the right payout ratio. Net income payout ratios are easy to find but often misleading. For REITs, you want AFFO payout ratios. For regular companies, free cash flow payout ratios. Net income includes non-cash items that distort the picture. A 60% net income payout might be 110% on a free cash flow basis if capex is high.
Treating monthly income as the goal. Monthly income is the structure. Quality compounding is the goal. A ladder of average businesses delivering monthly checks will underperform a ladder of great businesses delivering quarterly checks every time. Sequence and timing matter less than the durability of the underlying dividends.
A quick checklist before you build
Save this and run through it before every buy:
Annual income target identified, capital required calculated
Average portfolio yield is realistic (3% to 5% for quality, not 8%+)
Each candidate passes the 5-point quality screen
Position sizes set for level income, not equal dollar weights
Sector diversification across the three cycles
Ex-dividend dates and payment dates verified for each holding
No single position above 5% to 7% of portfolio
Final thoughts
A dividend ladder is a tool. The strategy is owning quality businesses that grow their dividends over time. The ladder is the structure that makes the income arrive when you need it.
Built with the five-step framework above, a ladder turns the lumpy quarterly cadence of US dividend culture into something that matches the monthly cadence of real life. That makes the income easier to use, easier to reinvest, and easier to live on.
That is going to wrap up our discussion for today.
As always, thank you for taking the time to read this post, and I hope you find something of value on your investing journey.
If I can further assist, please don’t hesitate to reach out.
Until next time, take care and be safe out there,
Dave
P.S. Before Dividend School opens on June 1, I am going live to show you what is inside and answer every question you have. I will walk through how I would build a dividend portfolio from scratch, in real time. June 4th @ 11 am EDT
Excellent !
Clear, concise, step by step, yet with enough detail and examples.
Thank You !!!