
Visa's Dividend Machine: Can 15% Growth Keep Running?

“The single most important decision in evaluating a business is pricing power. If you’ve got the power to raise prices without losing business to a competitor, you’ve got a very good business.” — Warren Buffett
Visa just raised its quarterly dividend 14% to $0.67 per share. That marks 17 consecutive years of dividend increases since the company’s 2008 IPO. Over the past five years, Visa has grown its dividend at roughly 15% to 16% annually, turning a modest yield into a powerful compounding engine.
But can that pace continue?
A sub-1% yield doesn’t excite most dividend investors. And that’s exactly why Visa gets overlooked by income-focused portfolios chasing higher starting yields. The real story, however, lives in the growth rate. An investor who bought Visa five years ago is already earning a yield on cost that dwarfs many “high yield” stocks, and the trajectory keeps climbing.
In today’s post, we will cover:
Visa’s Dividend Track Record and What Drives It
The Financial Engine Behind the Dividend
Three Tests for Sustainable 15%+ Growth
Where the Risks Live
What This Means for Your Investing Process
Let’s dig in.
Visa’s Dividend Track Record
Visa has increased its dividend every year since going public, building one of the most consistent growth records in the market. Let’s look at the recent trajectory using Visa’s fiscal year (which ends September 30).
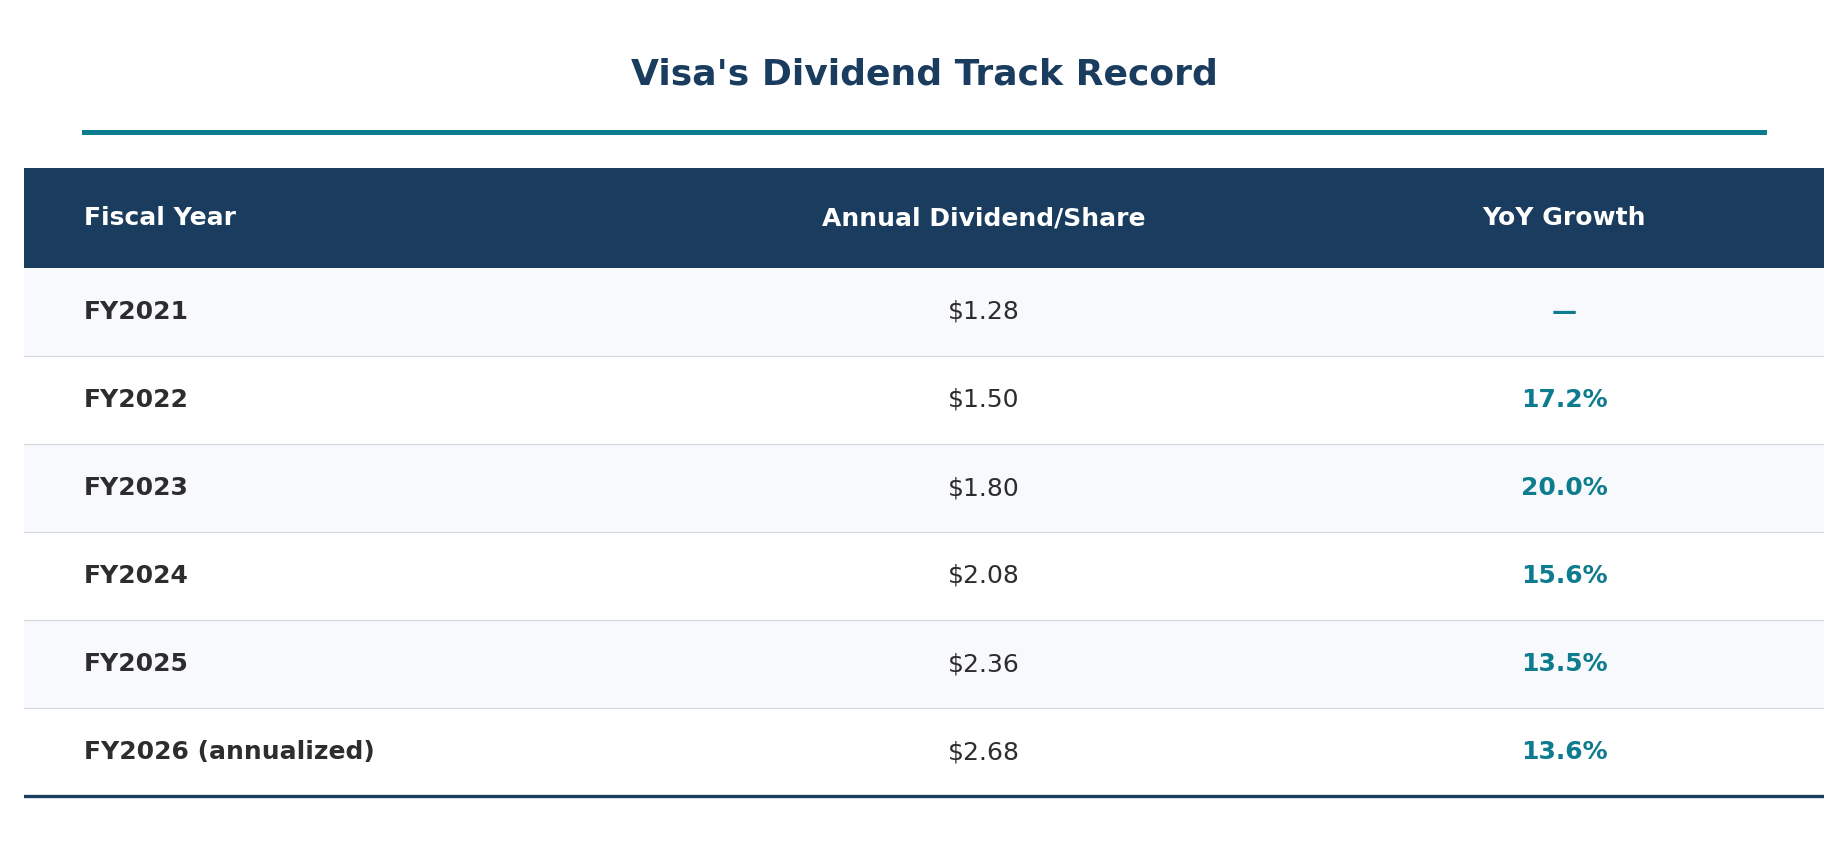
Source: Visa quarterly dividend declarations per Visa Investor Relations and SEC filings (8-K filings for each dividend declaration).
Over the last five years, the compound annual growth rate has been approximately 15.9%. The most recent increase of 14% (from $0.59 to $0.67 quarterly) landed right in the historical range, though it sits at the lower end of the five-year trend.
Here’s what makes that growth rate remarkable. Most companies growing dividends at 15%+ are doing so from a high payout ratio, essentially borrowing from future flexibility. Visa is doing the opposite. Its payout ratio has remained stubbornly low, hovering around 23%. That means Visa is growing its dividend at 15% while paying out less than a quarter of its earnings.
This is the financial equivalent of a runner who hasn’t broken a sweat yet.
Knowing the concepts is one thing. Being able to sit down with a real dividend stock and actually analyze it is another. Paid membership gives you the tools to bridge that gap:
📊 1. Stock Analysis Infographic Library: 180+ visual references covering financial statements, valuation multiples, and dividend metrics, your cheat sheet for analyzing any company
🤖 2. AI Prompt Library: 10 purpose-built prompts that turn AI into a research partner, stress-test your thesis, dig into financials faster, and catch risks you’d otherwise miss
🔧 3. Investing Tools Suite: 4 analytical tools that take the friction out of the numbers so you can focus on understanding the business, not wrestling with spreadsheets
🎓 4. Skill Workshop: Practical working sessions walking through real company analysis start to finish, not theory, not lectures, actual practice
📈 5. Dividend Analysis Course (Coming Soon): A complete step-by-step course on analyzing dividend stocks using Buffett-inspired fundamental analysis
🔓 6. Everything Added Going Forward: Every new resource, tool, and prompts added automatically, no extra charge, ever
The Financial Engine Behind the Dividend
To understand whether Visa can sustain this pace, we need to examine the sources of the dividend: earnings growth, free cash flow generation, and the capital-light business model.
Revenue and Earnings Growth
According to Visa’s fiscal 2025 earnings release (filed October 28, 2025, as an 8-K with the SEC), the company delivered the following full-year results for fiscal 2025 (ended September 30, 2025):
Net revenue: $40.0 billion, up 11% year over year
GAAP net income: $20.1 billion, up 2% (impacted by $2.5 billion litigation provision)
Non-GAAP net income: $22.5 billion, up 11%
GAAP diluted EPS: $10.20, up 5%
Non-GAAP diluted EPS: $11.47, up 14%
The GAAP numbers look slower because of large litigation charges related to the interchange multidistrict litigation (MDL). The non-GAAP figures strip out those one-time legal costs and better represent the underlying business performance. That 14% non-GAAP EPS growth lines up almost perfectly with the dividend growth rate, which is no coincidence. Management is calibrating dividend increases to match the earnings trajectory.
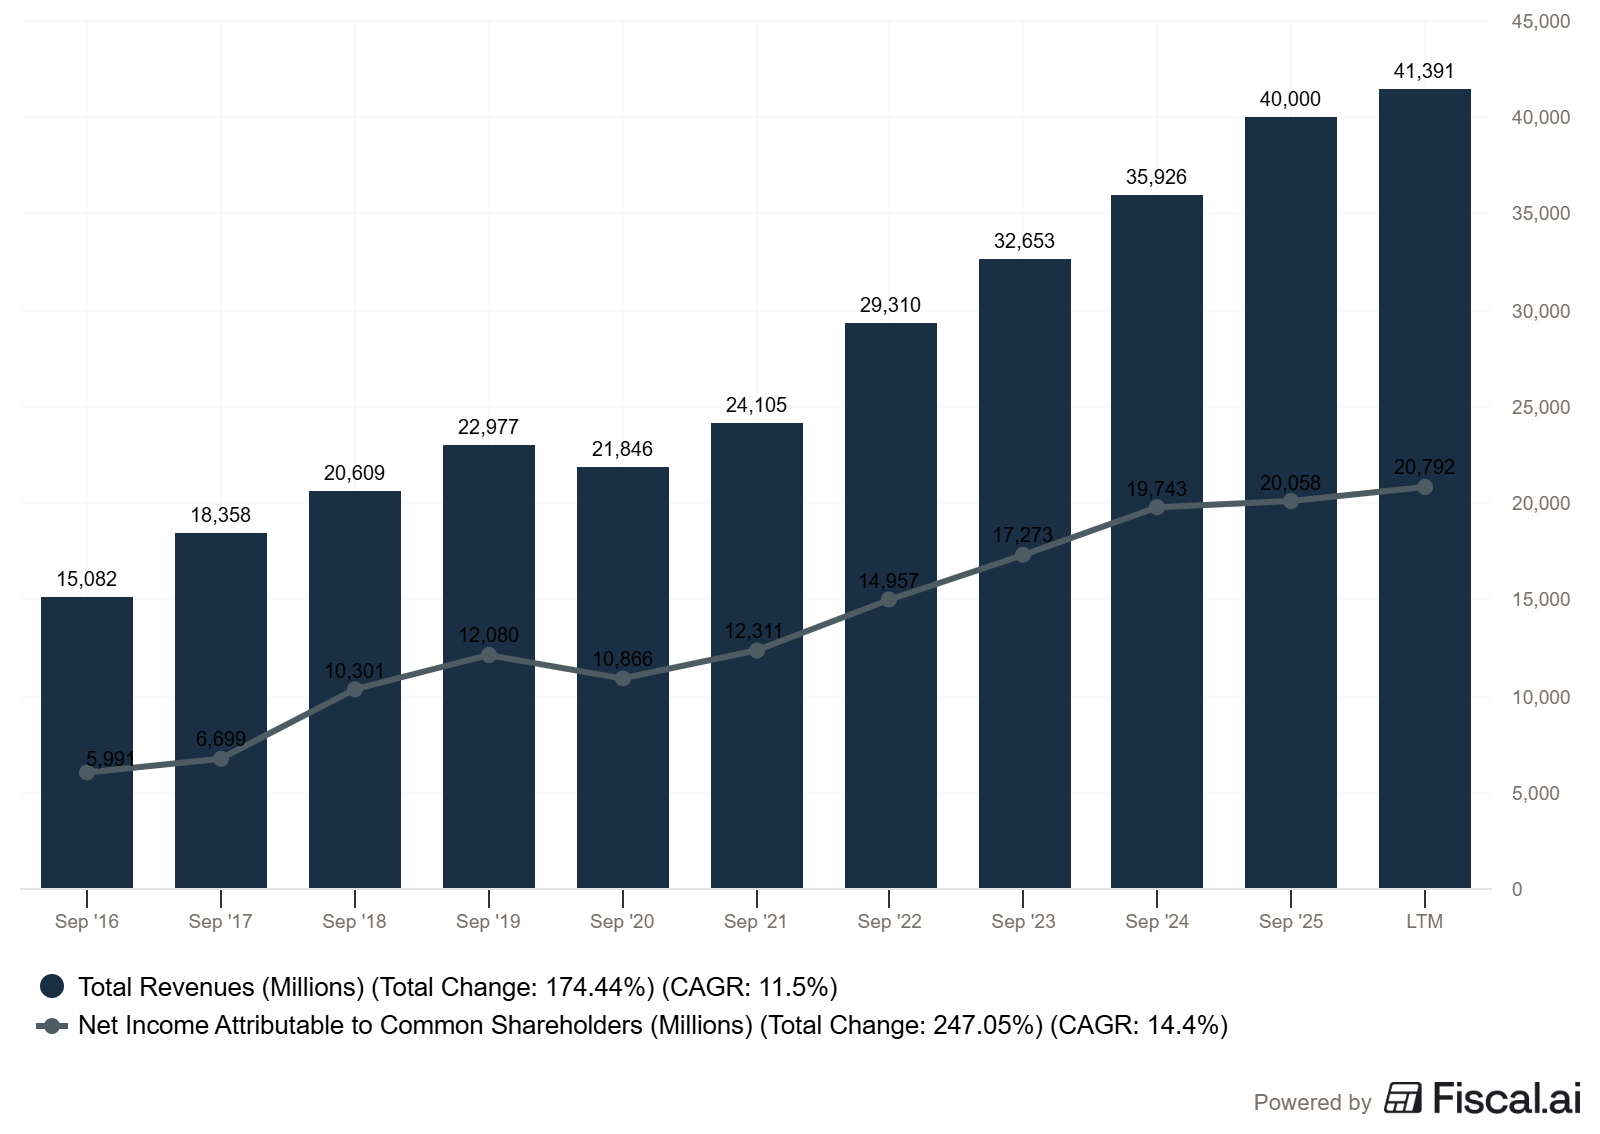
For context, here’s the revenue progression over the last four fiscal years:
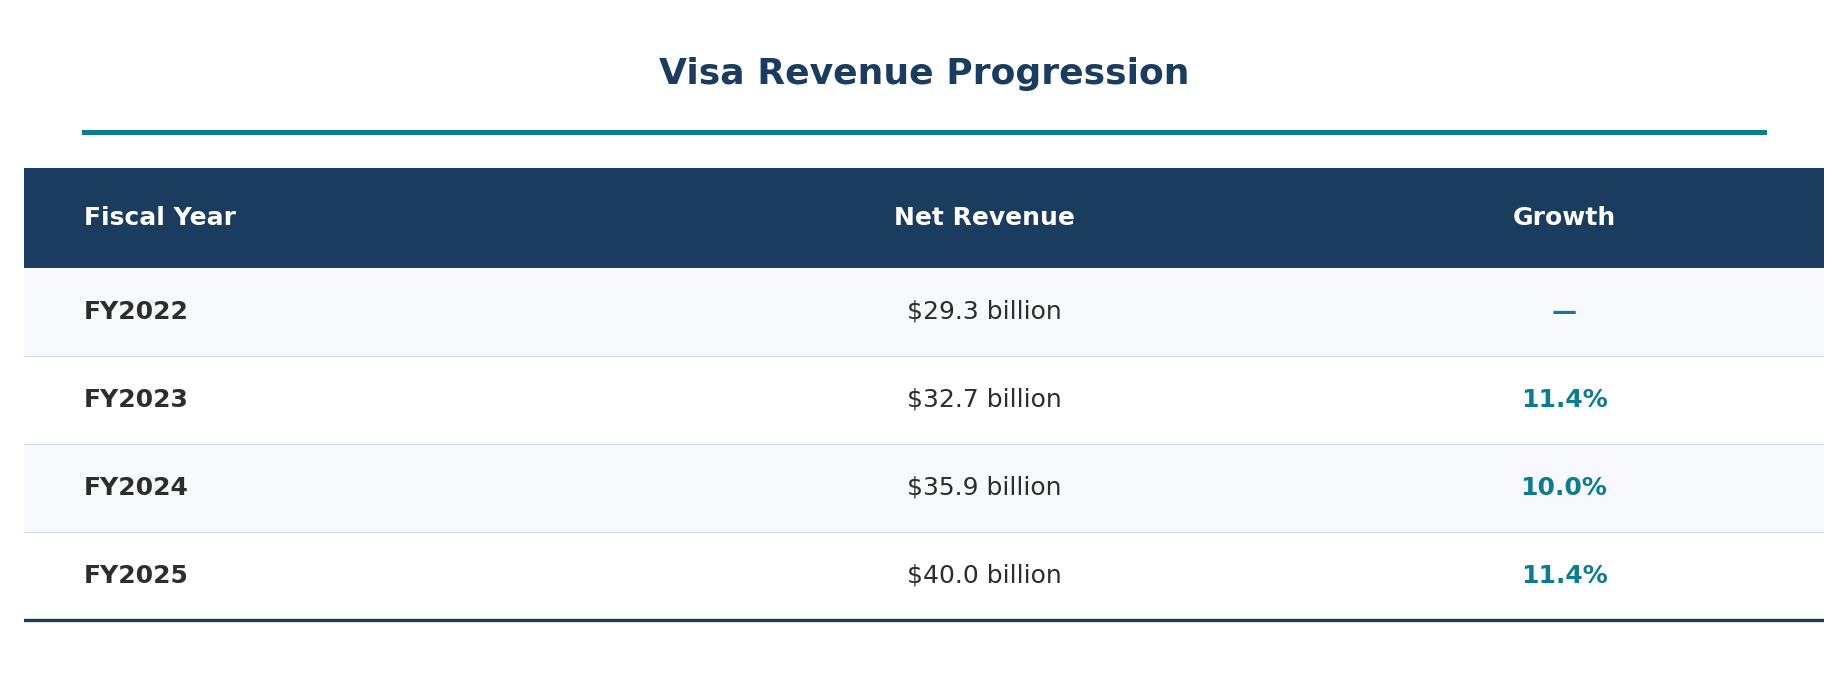
Source: Visa Annual Reports and fiscal year earnings releases filed with the SEC.
Revenue has grown at a remarkably steady 10% to 11% clip. That consistency matters because it signals durable demand, not a one-time spike.
Free Cash Flow Generation
Visa’s cash flow statement from the FY2025 earnings release tells the real dividend story:
Cash from operations: $23.1 billion
Capital expenditures: $1.48 billion
Free cash flow: approximately $21.6 billion
Now compare that free cash flow to what Visa actually paid out in dividends: $4.63 billion. That’s a free cash flow payout ratio of just 21.4%. Visa could more than quadruple its dividend and still have cash left over.
Of course, Visa doesn’t hoard the rest. In fiscal 2025, the company returned $22.8 billion to shareholders through a combination of dividends ($4.63 billion) and share repurchases ($18.2 billion). The buybacks retired approximately 54 million shares at an average price of $335.44 per share, steadily shrinking the share count and boosting per-share earnings.
The Capital-Light Advantage
This is where Visa connects directly to the Warren Buffett playbook we’ve discussed in previous articles on ROIC and See’s Candies.
Visa spent $1.48 billion on capital expenditures in fiscal 2025 while generating $40 billion in revenue. That’s a capex-to-revenue ratio of just 3.7%. Compare that to a capital-intensive business like AT&T, which must invest tens of billions into network infrastructure to generate its revenue.
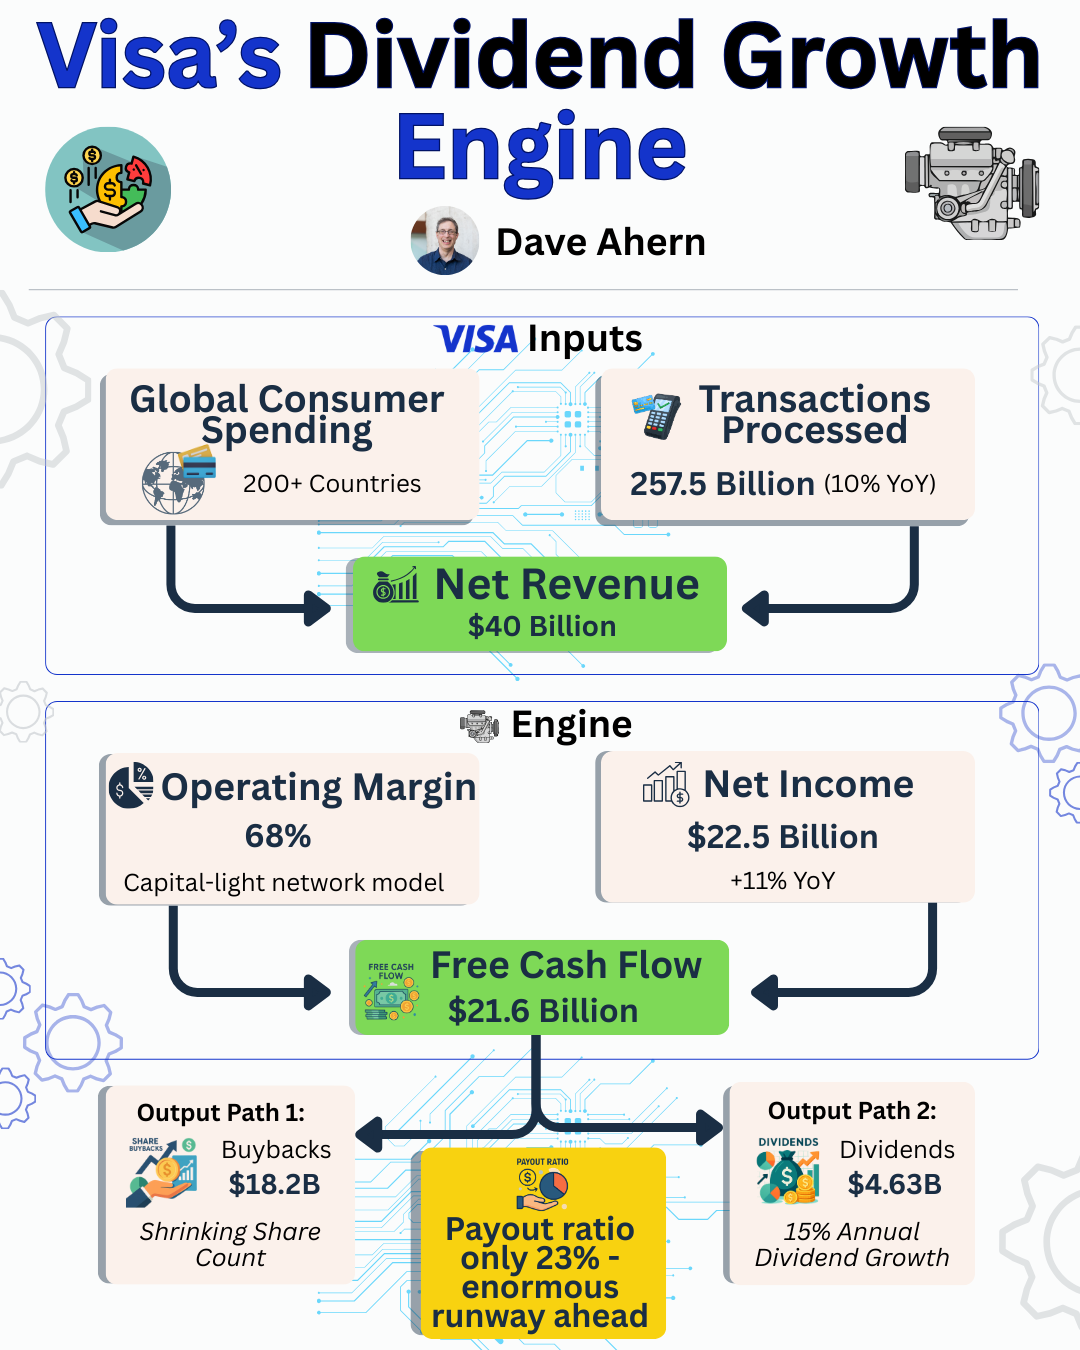
Visa operates the rails on which payments travel. It doesn’t lend money, take credit risk, or carry inventory. Every time someone taps a card at a store or clicks “pay” online, Visa collects a small fee for facilitating the transaction. In fiscal 2025, Visa’s network processed 257.5 billion transactions, up 10% year over year.
As Buffett described in his 2007 shareholder letter, when discussing See’s Candies, the dream business is one that “can employ large amounts of incremental capital over an extended period at very high rates of return.” Visa takes that a step further. It generates enormous returns with little incremental capital. Visa’s non-GAAP operating margin runs near 68%, meaning it keeps roughly 68 cents of operating profit for every dollar of revenue.
That capital efficiency is the engine that makes 15%+ dividend growth possible year after year.
Three Tests for Sustainable 15%+ Growth
I look at three factors when evaluating whether a company can sustain aggressive dividend growth: earnings growth runway, payout ratio headroom, and management’s capital allocation priorities.
Test 1: Can Earnings Keep Growing at 10%+ Annually?
Visa’s earnings growth comes from two sources: organic revenue growth and share repurchases.
On the revenue side, Visa benefits from a massive secular tailwind. The global shift from cash to digital payments continues to accelerate. In fiscal 2025, payment volume grew 8% on a constant-dollar basis, and processed transactions rose 10%. Cross-border volume (excluding intra-Europe), which drives higher-margin international transaction revenue, jumped 13%.
The opportunity remains enormous. Cash still accounts for a significant portion of global transactions, and emerging markets represent billions of potential new cardholders. Visa ended fiscal 2024 with 4.6 billion payment credentials active at over 150 million merchant locations worldwide. Those numbers keep climbing.
On the buyback side, Visa repurchased $18.2 billion in shares during fiscal 2025 alone and had $24.9 billion remaining in its buyback authorization as of September 30, 2025. The consistent reduction in share count has been adding roughly 2 to 3 percentage points to annual EPS growth beyond what revenue growth delivers.
Combining 10% to 12% revenue growth with 2% to 3% from buybacks and some operating leverage, sustained non-GAAP EPS growth of 12% to 15% looks achievable for the foreseeable future.
Test 2: Does the Payout Ratio Leave Room?
This is where Visa truly shines for dividend growth investors.
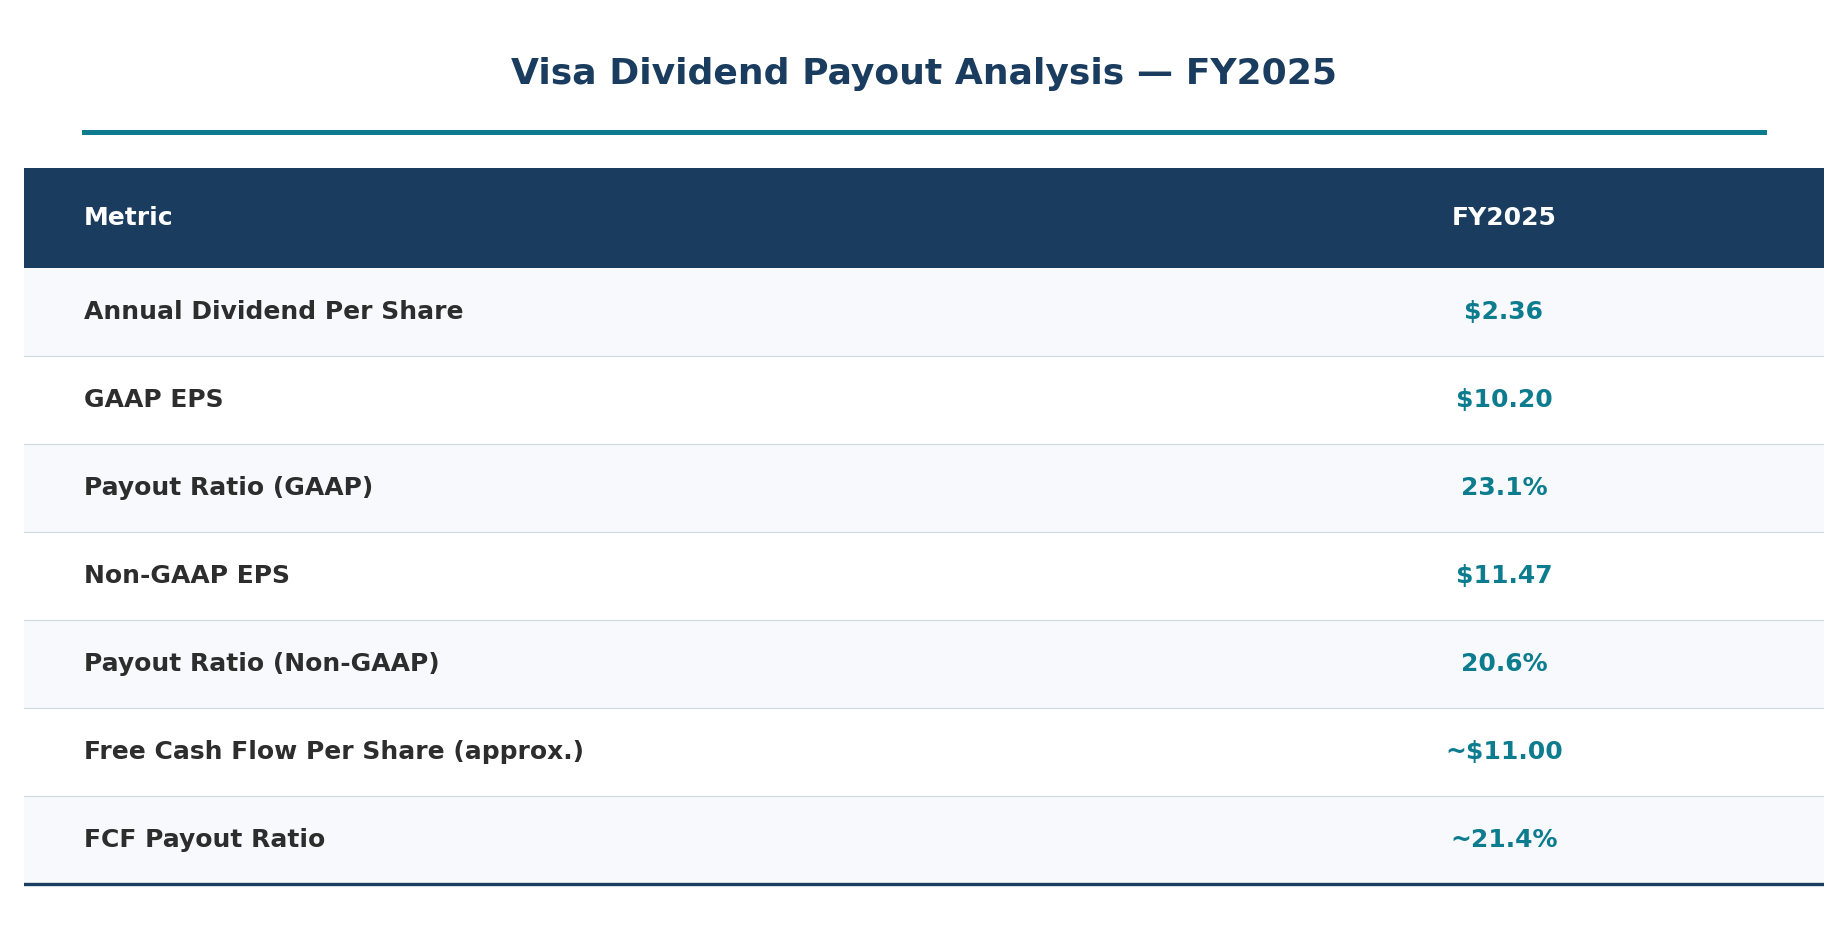
Calculated using data from Visa’s FY2025 earnings release filed with the SEC.
A payout ratio of around 20% to 23% is extraordinarily low. Most mature dividend growers operate at payout ratios of 40% to 60%. Even if Visa’s earnings growth slowed meaningfully (say, to 8% annually), the company could still grow the dividend at 15% for years simply by allowing the payout ratio to gradually rise toward 30% or 35%.
This is the margin of safety that dividend growth investors should care about most. Visa has a dual engine: earnings growth AND payout ratio expansion. As long as either one is working, the dividend growth story holds.
Test 3: Does Management Prioritize the Dividend?
Management’s actions speak clearly. Visa has raised its dividend every single year since the IPO, and the board has consistently delivered double-digit percentage increases. In October 2025, the board raised the dividend 14%, demonstrating continued commitment even with billions in litigation provisions weighing on GAAP results.
The total shareholder return framework is straightforward: Visa generates massive free cash flow, returns a modest portion as dividends, and deploys the rest into share repurchases. This approach keeps the yield low (attracting growth investors) while delivering strong total returns. Management has shown no indication of changing this playbook.
Where the Risks Live
No analysis is complete without addressing what could go wrong. Visa faces several headwinds that could slow dividend growth below 15%.
Regulatory and Legal Pressure
The most immediate risk is regulatory. The Department of Justice filed an antitrust suit against Visa in September 2024, alleging the company maintains an illegal monopoly in the debit card market. The interchange MDL litigation has already cost Visa $2.5 billion in provisions during fiscal 2025 alone.
Higher regulatory costs, potential changes to interchange fee structures, or mandated routing alternatives could pressure margins. If operating margins are compressed by several percentage points over time, it would reduce the earnings growth rate and potentially force management to choose between dividend growth and buyback levels.
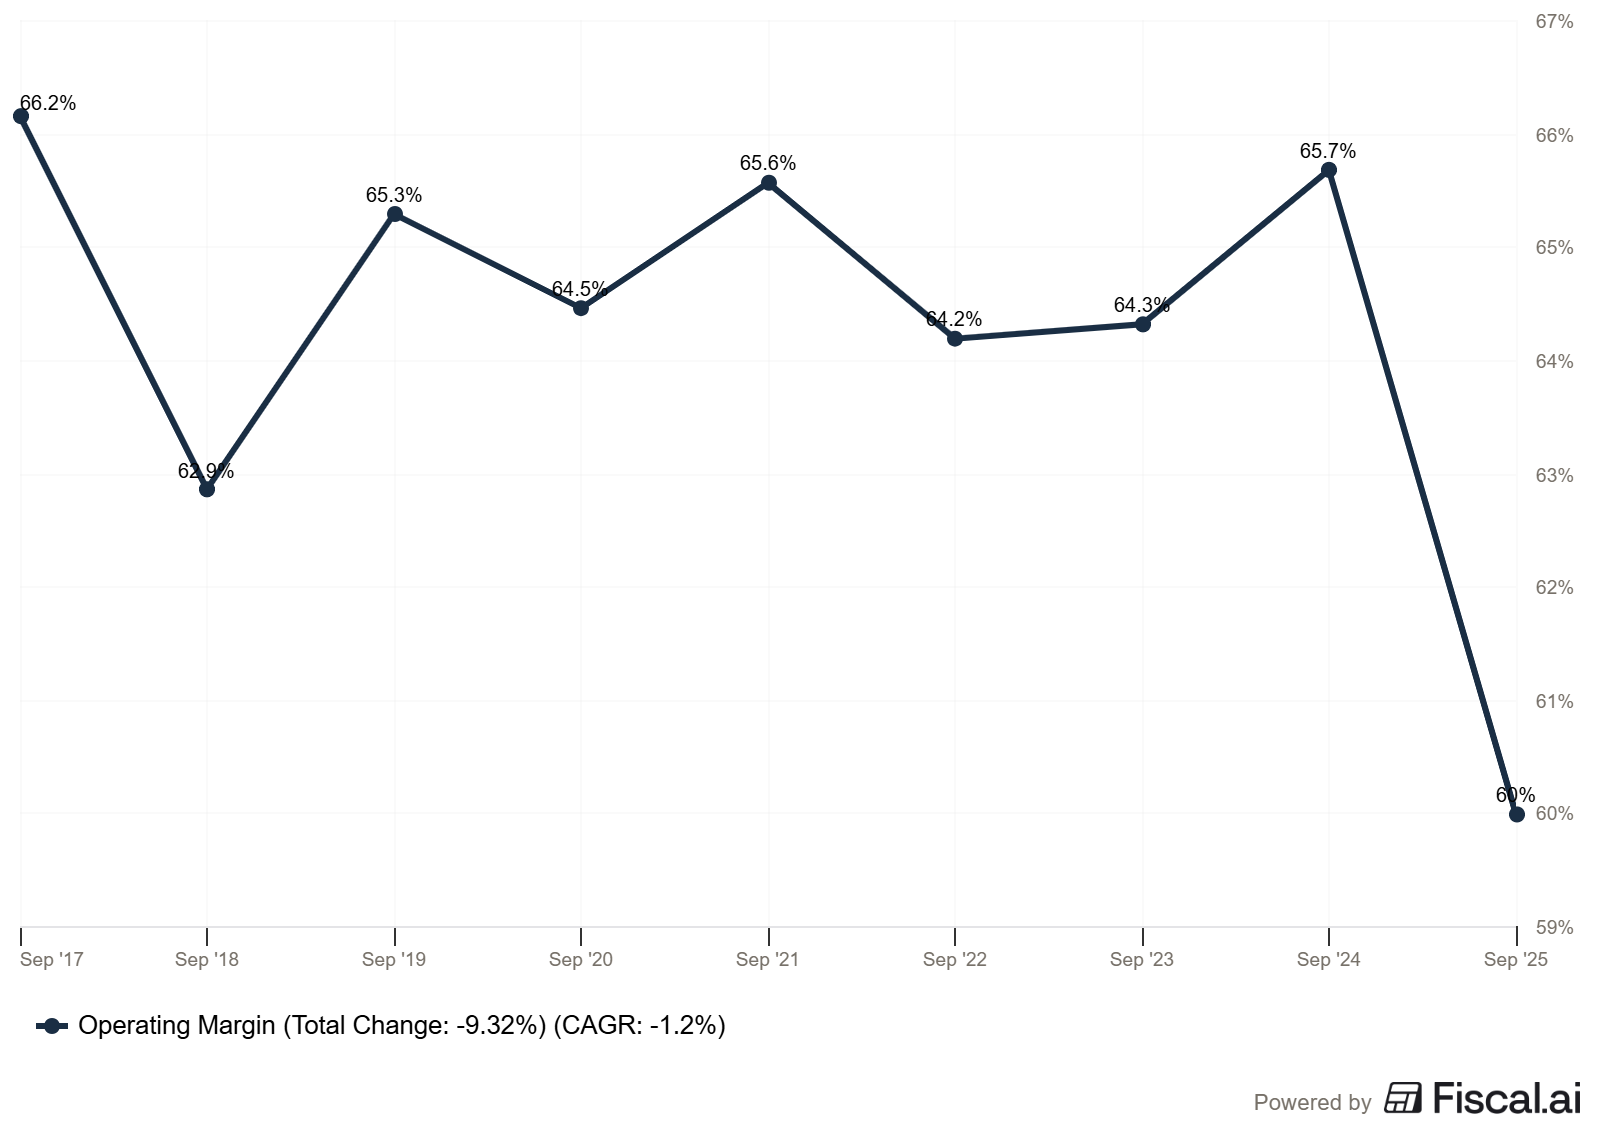
That said, Visa’s margin profile is so strong (68% non-GAAP operating margin) that it can absorb meaningful regulatory costs without threatening the dividend itself. A few percentage points of margin compression would slow earnings growth, but wouldn’t create a payout ratio crisis.
Slowing Consumer Spending
Visa’s revenue is ultimately tied to consumer and business spending. A recession or prolonged economic slowdown would reduce payment volume growth, which directly impacts revenue. During the pandemic-driven downturn in 2020, Visa’s revenue dipped 5% before snapping back strongly.
The company’s global diversification helps here. Weakness in one region can be offset by strength in others, and the secular shift from cash to digital payments provides a structural floor under growth even during downturns.
Competition from Fintechs and Alternative Payment Methods
Real-time payment systems, cryptocurrency, “buy now, pay later” services, and account-to-account transfers all represent potential threats to Visa’s transaction volumes. However, Visa has been proactive about integrating with these technologies rather than competing against them. Visa Direct, the company’s real-time push payment platform, processes transactions across more than 195 countries. The company also continues investing in tokenization, AI-driven fraud detection, and stablecoin infrastructure.
The competitive moat of a network processing 257.5 billion transactions annually across 200+ countries and territories is extraordinarily difficult to replicate, which is the core of Visa’s pricing power.
What Could Actually Break the 15% Growth Streak?
The most realistic scenario for dividend growth falling below 15% is a sustained slowdown in EPS growth to single-digit levels. If revenue growth decelerated to 6% to 7% and buybacks couldn’t fully compensate, dividend growth would likely moderate to 10% to 12% rather than collapse entirely. Given the low payout ratio, even that scenario would take years to play out.
The bottom line: a permanent impairment of the dividend growth trajectory would require a fundamental disruption to the payment network model itself, and that’s not on the horizon today.
Your Yield on Cost: The Hidden Power of Dividend Growth
This is where the math gets interesting for long-term investors.
Let’s say you buy Visa today at roughly $327 per share (near recent prices). Your starting yield is approximately 0.82% ($2.68 annualized dividend / $327 price). That looks terrible compared to a 4% Treasury yield.
But watch what happens if Visa grows its dividend at different rates over the next decade:
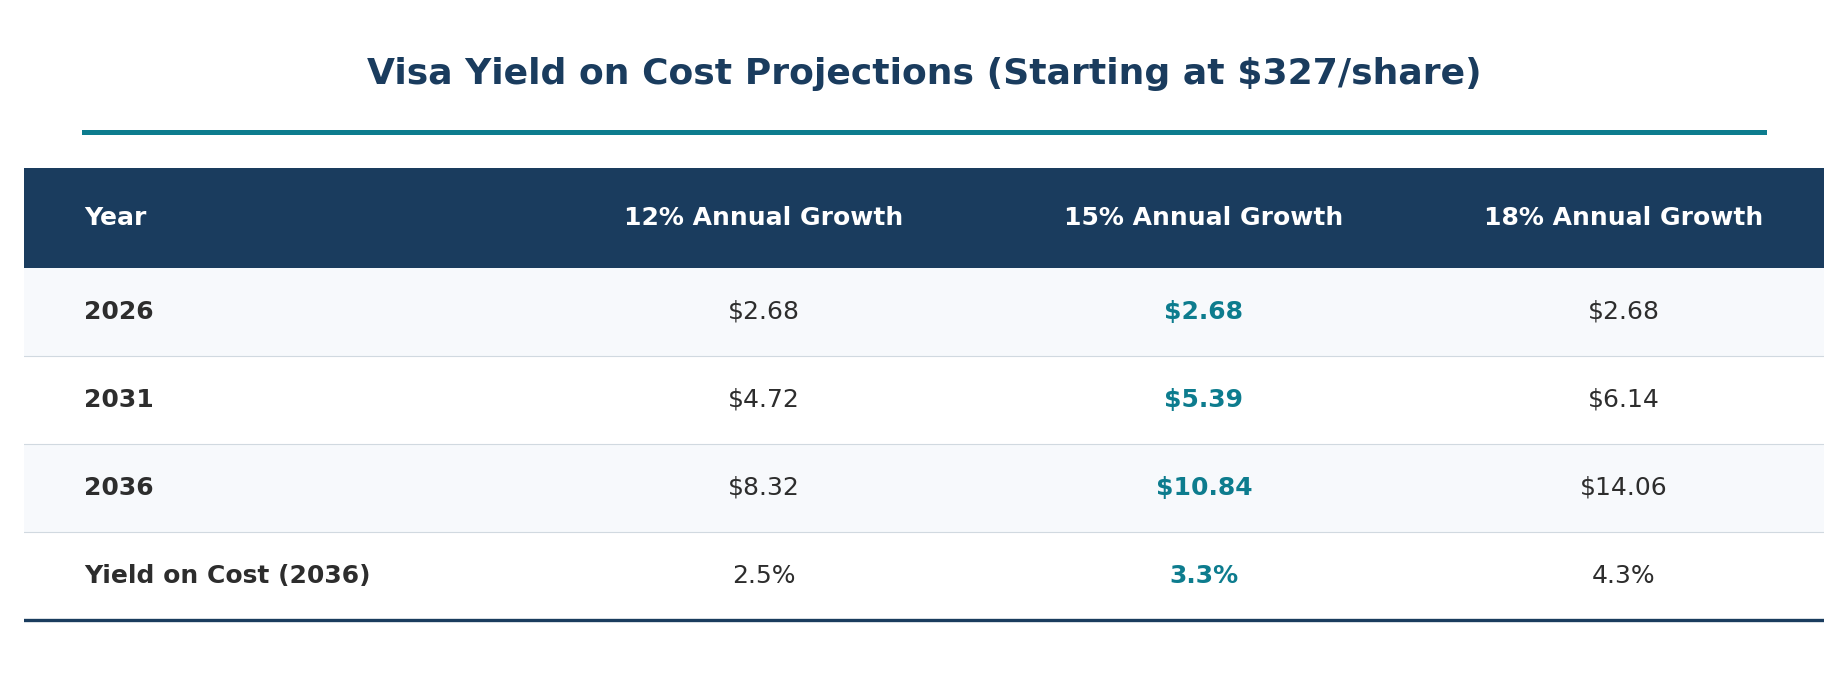
At 15% growth, your yield on cost crosses 3% within a decade, all while the share price has likely appreciated significantly alongside earnings. At 12% growth (a conservative scenario), you’re still earning a 2.5% yield on your original investment, on a stock that has potentially doubled in price.
This is the power of dividend growth investing. The starting yield is irrelevant. What matters is the growth rate and its sustainability.
Key Metrics to Watch Going Forward
Here’s the framework I use to monitor whether Visa’s dividend growth engine remains healthy:
Payment volume growth: This is the lifeblood. As long as payment volume grows at 7%+ on a constant-dollar basis, the revenue story is intact. Fiscal 2025 delivered 8%.
Non-GAAP EPS growth: This is the North Star for dividend increases. If it stays above 12%, expect dividend increases of 12% to 15%+. If it drops below 10% for multiple years, dividend growth will moderate.
Payout ratio trajectory: Currently at 23%, this gives enormous flexibility. If it rises above 35%, it signals that management is stretching to maintain dividend growth. A dividend yield below 30% means the dividend has room to run faster than earnings.
Free cash flow generation: Visa generated $21.6 billion in free cash flow in fiscal 2025. As long as free cash flow continues to grow and the FCF payout ratio stays below 30%, the dividend is rock-solid.
Share count reduction: Buybacks are a meaningful contributor to per-share growth. Watch for sustained repurchase activity. Visa retired 54 million shares in fiscal 2025 and has $24.9 billion remaining in authorizations.
Investor Takeaway
Visa’s dividend growth story is one of the most compelling in the market. Seventeen consecutive years of increases, a payout ratio under 25%, and a capital-light business model generating over $21 billion in annual free cash flow create a powerful foundation for continued growth.
Will Visa sustain exactly 15%+ growth forever? Probably not. Eventually, the law of large numbers catches up with every company. But the combination of steady double-digit revenue growth, consistent share buybacks, and an extremely low payout ratio suggests Visa can deliver dividend increases of 12% to 15% annually for years to come. Even in a slower-growth environment, the payout ratio provides a substantial cushion.
For investors willing to accept a low starting yield in exchange for elite compounding, Visa remains one of the strongest dividend growth stories in the market.
As always, thank you for taking the time to read this post, and I hope you find something of value on your investing journey. If I can further assist, please don’t hesitate to reach out.
Until next time, take care and be safe out there,
Dave
Knowing the concepts is one thing. Being able to sit down with a real dividend stock and actually analyze it is another. Paid membership gives you the tools to bridge that gap:
📊 1. Stock Analysis Infographic Library: 180+ visual references covering financial statements, valuation multiples, and dividend metrics, your cheat sheet for analyzing any company
🤖 2. AI Prompt Library: 10 purpose-built prompts that turn AI into a research partner, stress-test your thesis, dig into financials faster, and catch risks you’d otherwise miss
🔧 3. Investing Tools Suite: 4 analytical tools that take the friction out of the numbers so you can focus on understanding the business, not wrestling with spreadsheets
🎓 4. Skill Workshop: Practical working sessions walking through real company analysis start to finish, not theory, not lectures, actual practice
📈 5. Dividend Analysis Course (Coming Soon): A complete step-by-step course on analyzing dividend stocks using Buffett-inspired fundamental analysis
🔓 6. Everything Added Going Forward: Every new resource, tool, and prompts added automatically, no extra charge, ever