
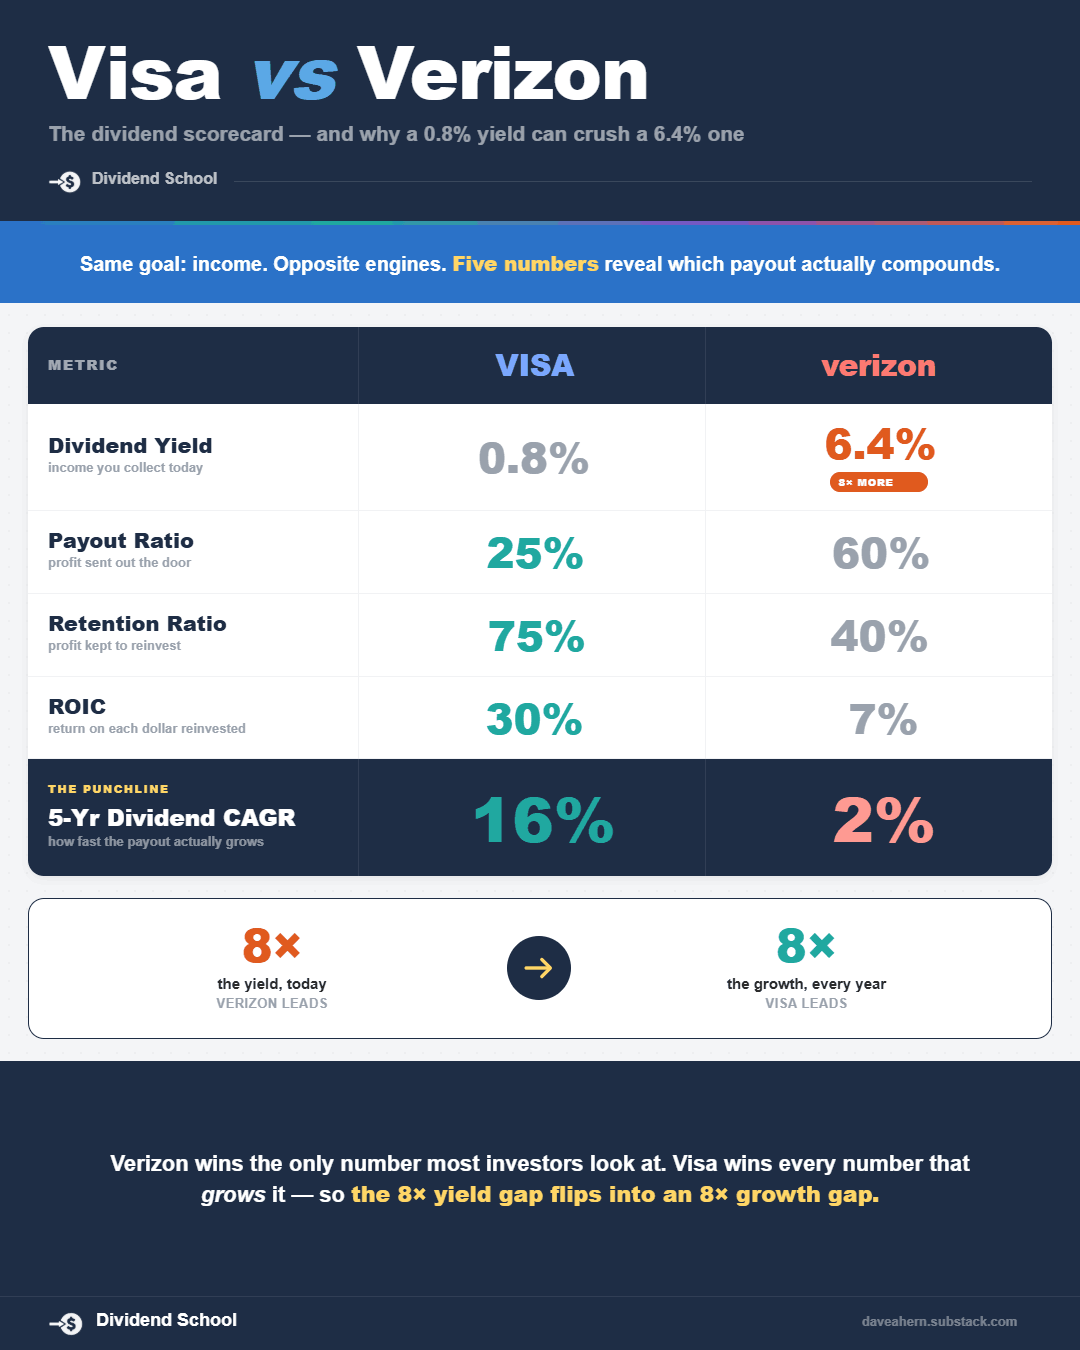
Visa vs Verizon: Why a 0.7% Yield Beats a 6% Yield Over Time
Hint: the fat yield loses. The math is on the side of the high-ROIC compounder.

Most dividend investors start with the yield. They scan for the biggest number, buy it, and hope the checks keep coming.
There is a better first question. How fast can this dividend actually grow, and for how long?
The answer lies in one metric we have discussed before: return on invested capital. ROIC does not just tell you how good a business is. It quietly sets the speed limit on every future dividend raise.
In today’s post, we will discuss:
What ROIC, payout, and retention actually mean
The simple formula that predicts a dividend’s growth ceiling
A full breakdown of Visa, a high-ROIC dividend machine
Verizon is the mirror image, same math, very different result
How to run this check on any dividend stock you own
Okay, let’s dive in and learn how ROIC predicts dividend growth.
The one number behind every dividend raise
A dividend is a slice of profit handed back to you. Simple enough.
The part most investors skip is where the next raise comes from. A company can only grow its dividend over time if it grows its earnings over time. And earnings grow when a company reinvests money into the business at a good rate of return.
That rate of return is ROIC.
Return on invested capital (ROIC) measures how much profit a company squeezes out of every dollar of capital put to work in the business. The formula is net operating profit after tax divided by invested capital (the debt and equity funding operations). A 30% ROIC means the company turns one dollar of capital into thirty cents of yearly operating profit.
Two more terms before the trick.
Payout ratio is the share of earnings paid out as dividends. Pay $2 in dividends on $10 of earnings, and the payout ratio is 20%.
Retention ratio is the flip side, the share of earnings the company keeps to reinvest. In that same example, the company keeps $8 of every $10, an 80% retention ratio.
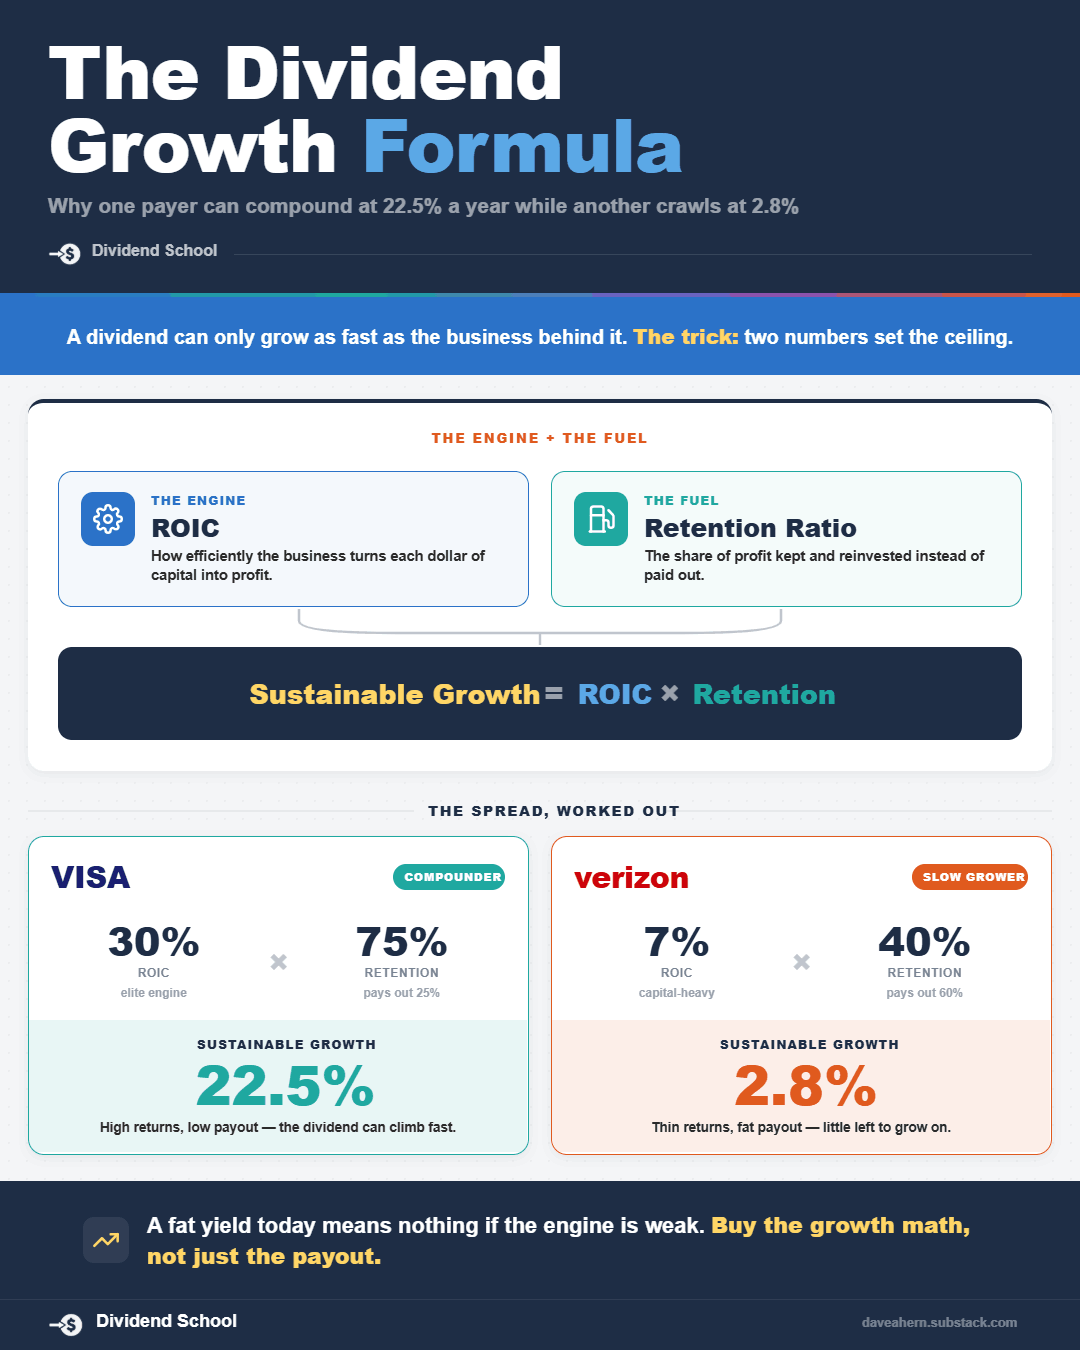
Here is why those two matter together. The money a company keeps is the fuel for growth. The rate it earns on that money is the engine. ROIC is the engine, retention is the fuel.
The trick: ROIC times what a company keeps
Put the engine and the fuel together, and you get a company’s sustainable growth rate:
Sustainable growth = ROIC × retention ratio
That single line predicts how fast a business can grow its earnings, and therefore its dividend, using only its own internal cash. No new stock. No new debt.
Let’s run two quick examples to see the spread.
Company A earns a 30% ROIC and keeps 75% of its profit:
0.30 × 0.75 = 22.5% sustainable growth
Company B earns a 7% ROIC and keeps 40% of its profit:
0.07 × 0.40 = 2.8% sustainable growth
Same idea, wildly different ceilings. Company A can compound its dividend in the high teens for years while still paying out a quarter of its profit. Company B is stuck near 3% even though it pays out far more than it earns.
Notice the twist. Company A pays out less of its profit, yet its dividend can grow faster. High ROIC is what makes that possible. When the engine is strong enough, a company funds big growth on a small slice of retained earnings and ships the rest to you.
That is the trick. Find a high ROIC paired with room to reinvest, and you have found a dividend that can climb over the long term.
Want to spot a dividend's growth ceiling before the raises arrive? Want the full math instead of the headline yield? Want a new deep dive every month? That is what the paid tier is for.
Visa: a high-ROIC dividend machine
Let’s look at Visa (V) as our guinea pig.
Here is Visa’s fiscal 2025 scorecard, taken from its October 28, 2025, earnings release filed on Form 8-K (fiscal year ended September 30, 2025):
Net revenue: $40.0B (up 11%)
GAAP net income: $20.1B
Diluted EPS: $10.20
Full-year dividends declared: about $2.36 per share
Payout ratio: roughly 23% ($2.36 / $10.20)
So Visa keeps about 77 cents of every dollar in profit. Now the engine.
Visa runs on a payment network it already built. Each new transaction costs the company almost nothing to process, so profits pile up with little additional capital. Using fiscal 2025 figures, a simplified return on total capital looks like this:
Net income: $20.1B
Senior notes (debt): $25.4B (per the fiscal 2025 10-K)
Total equity: roughly $38–39B
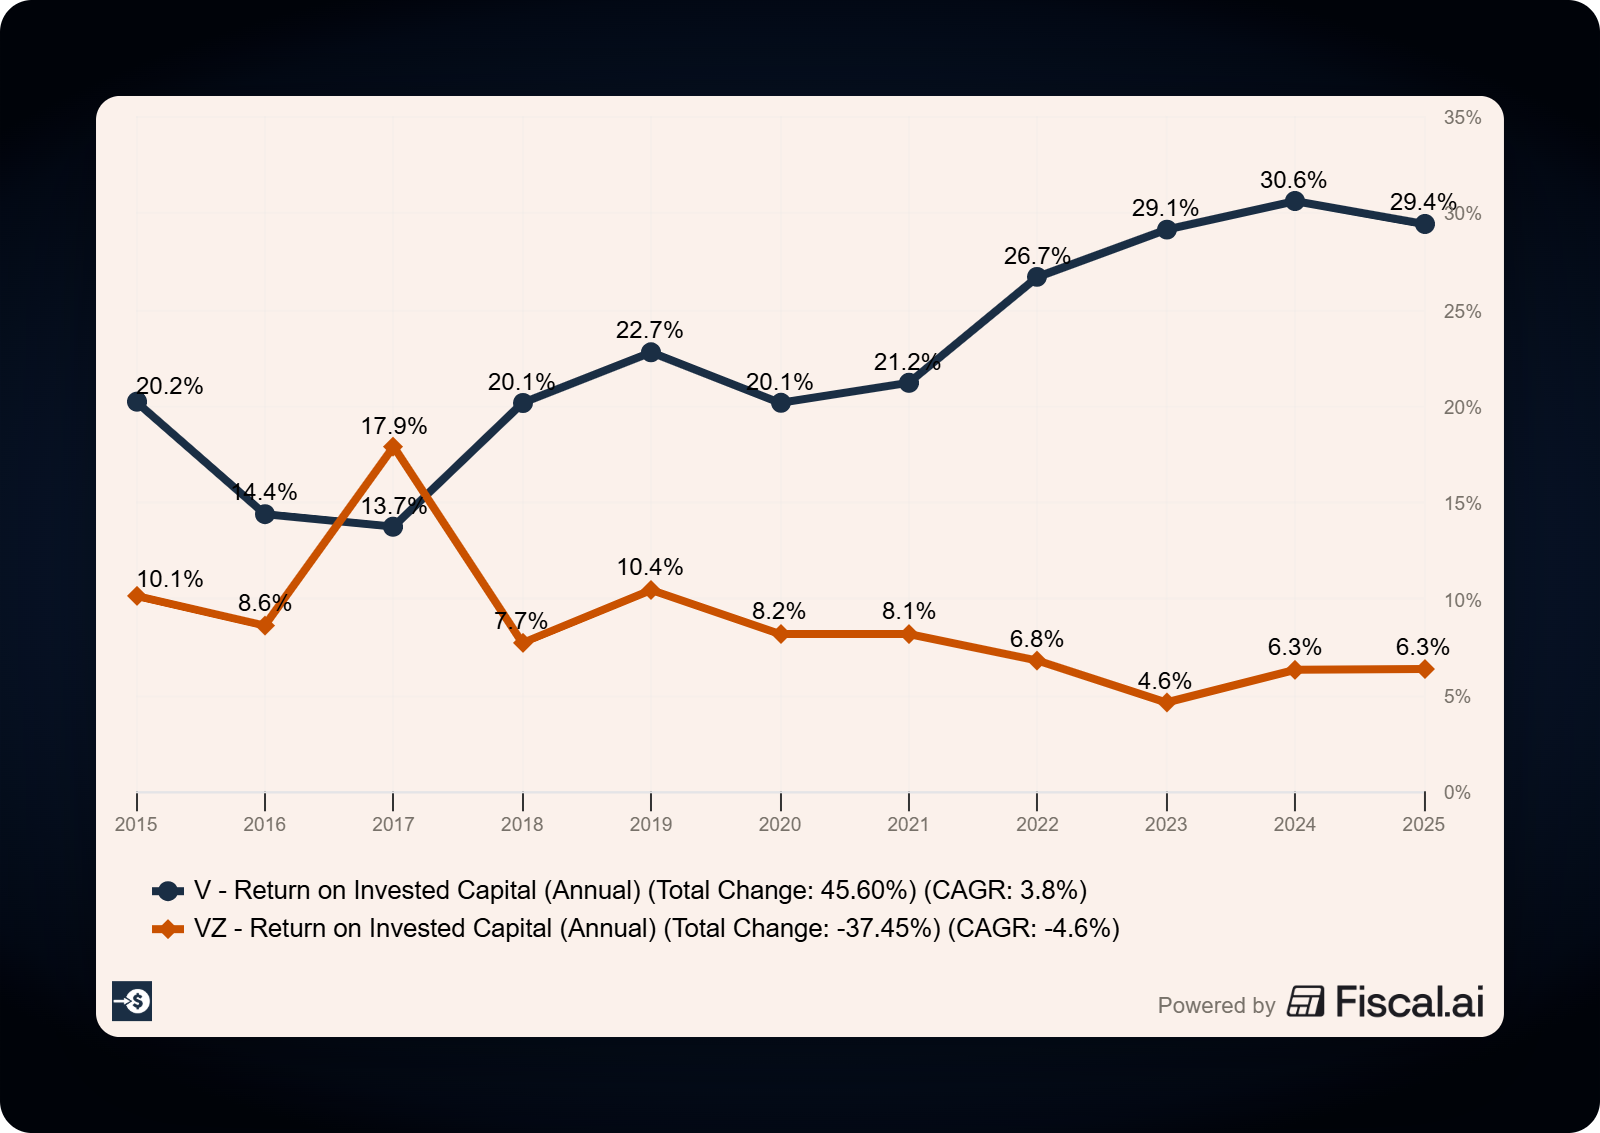
Return on total capital: about 31% ($20.1B / roughly $64B)
That is a conservative read. It buries Visa’s $20B of cash inside the capital base and treats net income as operating profit. Strip out the idle cash and look at it on a true operating basis, and Visa’s ROIC runs well above that figure. Either way, the engine is enormous.
Now run the trick. With a high ROIC and a 77% retention rate, Visa’s sustainable growth ceiling sits in the high teens. Does reality match?
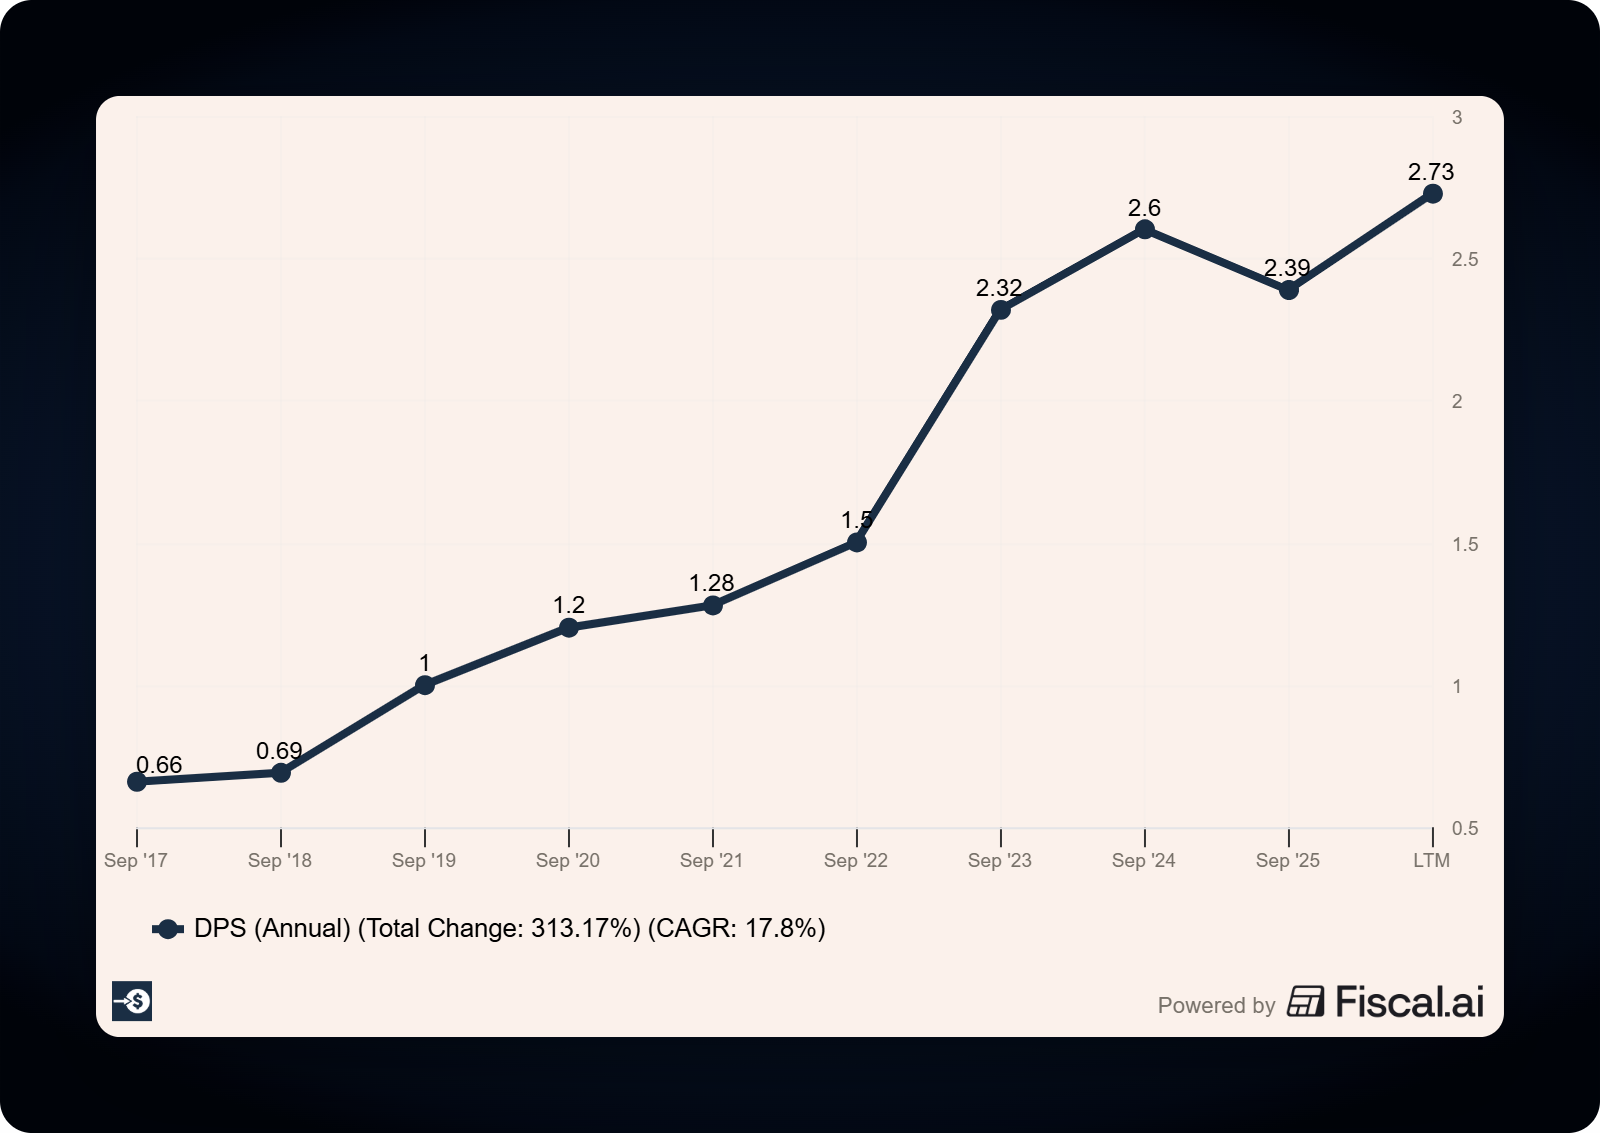
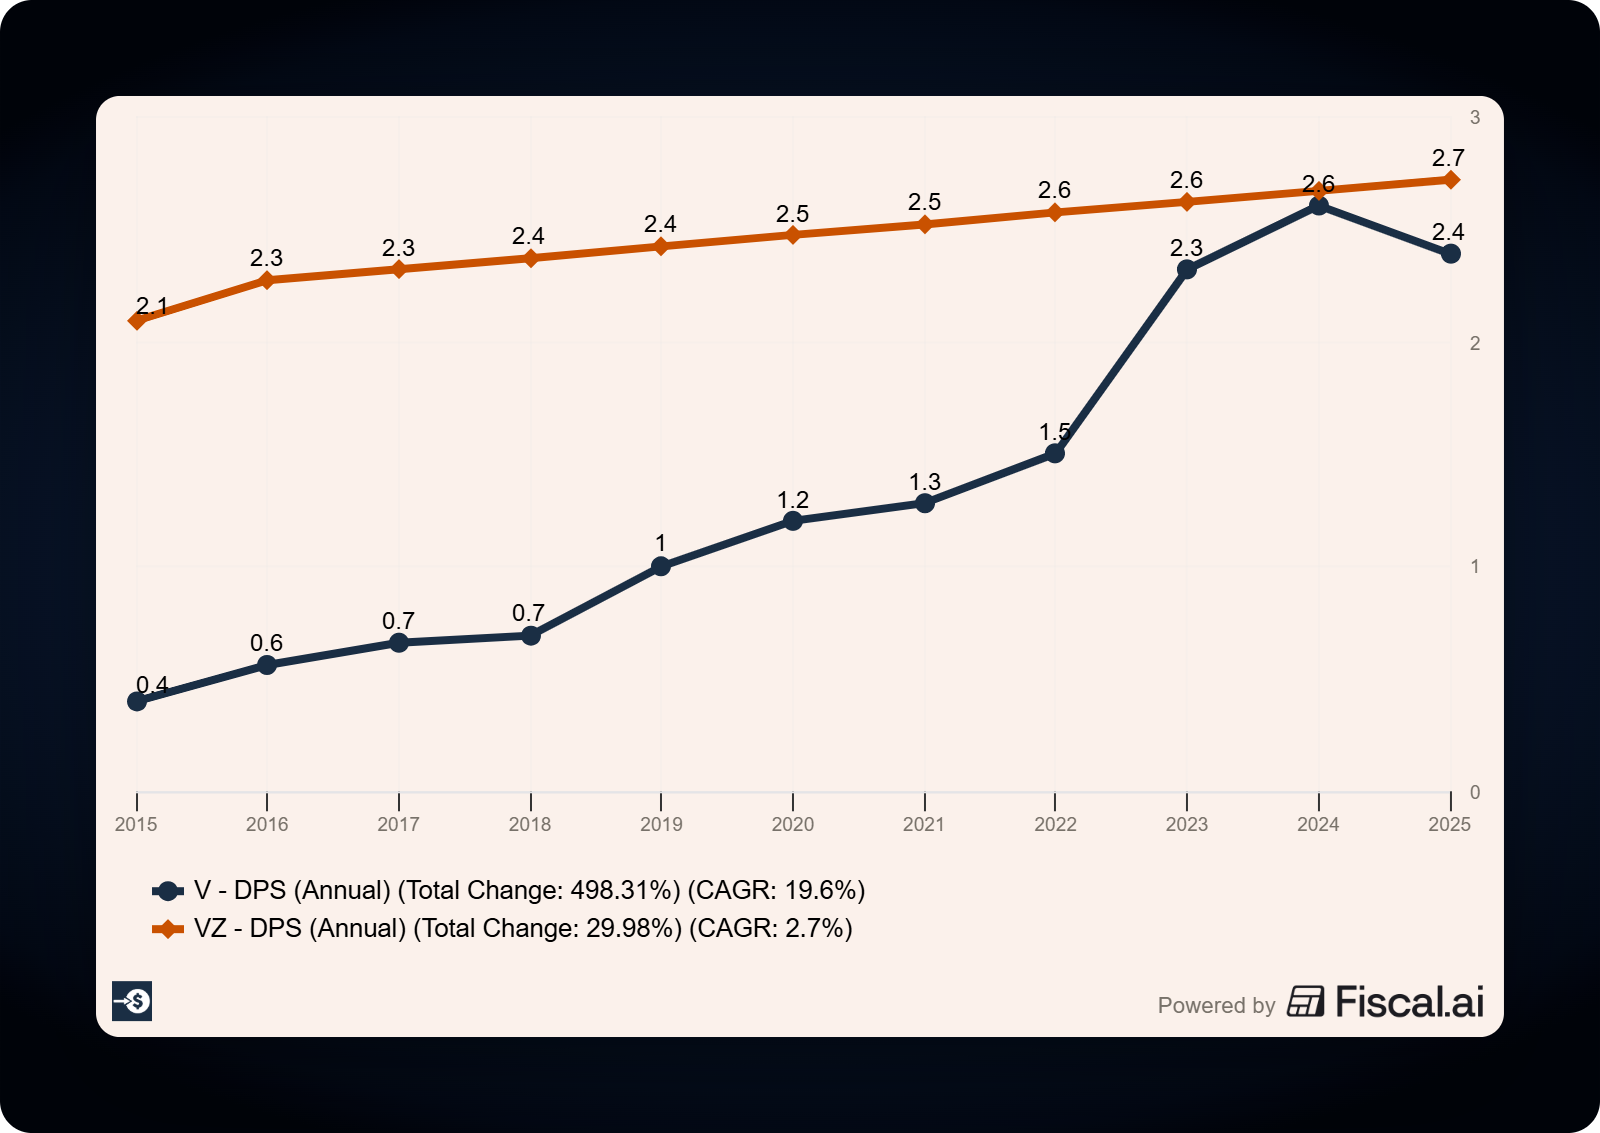
Here is Visa’s quarterly dividend, as declared each October to set the rate for the year ahead:
2020: $0.30
2021: $0.375
2022: $0.45
2023: $0.52
2024: $0.59
2025: $0.67
That run takes the quarterly payout from $0.30 to $0.67 in five years, more than double, a compound growth rate of roughly 17% a year. The October 2025 raise was 14%, on top of a 13% raise the year before.
High teens predicted. High teens delivered. The trick works.
And Visa is doing all of this while paying out less than a quarter of its profit. That low payout is the signature of a business whose ROIC is so high it can grow fast on a thin slice of retained earnings and send the rest out the door.
Verizon: the same math, a very different ceiling
Now flip it. Let’s look at Verizon (VZ), a favorite of yield hunters.
Verizon yields around 6%, roughly nine times Visa’s yield. On the surface, that looks like the better income stock. Run the trick and a different story shows up.
Here is Verizon’s recent profile:
Fiscal 2025 net income: about $17.2B
Diluted EPS: about $4.06
Payout ratio: roughly 60% of earnings
Retention ratio: roughly 40%
Verizon keeps far more profit per dollar than Visa does. So why does its dividend barely move? The engine.
Verizon builds and maintains physical networks. Spectrum, towers, fiber, and equipment soak up tens of billions in capital every year. All that capital sits on the balance sheet, and the returns it throws off are modest. Verizon’s ROIC lands in the high single digits, only a touch above its cost of capital.
Plug that into the trick:
About 7% ROIC × roughly 40% retention = under 3% sustainable growth
Reality matches the math again. Verizon’s dividend history tells the story:
The September 2025 raise was 1.25 cents a quarter, about 1.8%
The dividend has grown around 2% a year over the past five years
2025 marked its 19th straight annual increase
Nineteen years of raises sounds impressive, and the streak is real. Each raise, though, is tiny. A 2% bump barely keeps pace with inflation, so the purchasing power of that dividend stays close to flat year after year.
Same formula. One business has a high-teens ceiling; the other, a low-single-digit ceiling. The whole gap comes down to ROIC.
How to use this in your own process
You do not need a spreadsheet to run this check. Three numbers and one minute will do.
First, find the payout ratio. Take dividends per share divided by earnings per share. Subtract that from 1 to get the retention ratio.
Second, get a rough ROIC. Many data sources list it. Or build a simplified version yourself: net income divided by the sum of total debt and total equity from the balance sheet. It will read a little low, but it works for a gut check.
Third, multiply ROIC by the retention ratio. That product is the dividend’s growth ceiling.
Then compare what you find:
A high ceiling (low teens or better) means a dividend that can compound for years. You can accept a lower starting yield because the raises do the heavy lifting.
A low ceiling (low single digits) means a dividend that mostly stands still. The starting yield is most of what you will ever get from it.
This reframes the whole yield-versus-growth question. A 0.7% yield growing 17% a year eventually overtakes a 6% yield growing 2% a year. It takes patience, and it takes time, but the math is on the side of the high-ROIC compounder.
Where the trick breaks down
The formula is a strong starting point. It does not see the future, though, so a few limits are worth knowing.
ROIC can fade. A company earning 30% today may face new competition that drags returns down tomorrow. The trick assumes the engine keeps running at the same rate, so check whether the moat is durable enough to defend those returns.
Reinvestment opportunities run out. A business can earn a high ROIC and still have nowhere left to deploy capital. When that happens, it usually raises the payout ratio and slows reinvestment. That is a healthy stage of life, just a different one. Buffett’s dream business, See’s Candies, eventually sent almost all of its cash to Berkshire because it could not reinvest those dollars at high rates at home.
Buybacks muddy the picture. Visa spends heavily on repurchases, which shrinks the share count and lifts per-share figures on top of the growth the formula predicts. The trick captures the business engine, not every lever management can pull.
One-time items distort a single year. Use a few years of ROIC and payout, not one snapshot, so a strange quarter does not throw off your read.
The takeaway
A dividend can only grow as fast as the business behind it earns on the capital it reinvests, so multiply ROIC by what a company keeps and you will know the ceiling on those raises long before they ever arrive.
As always, thank you for taking the time to read this post, and I hope you find something of value on your investing journey.
If I can further assist, please don’t hesitate to reach out.
Until next time, take care and be safe out there,
Dave
P.S. If you want to keep pressure-testing dividends alongside other patient investors, the paid tier is where the full breakdowns live.
Great work my friend! I'm looking forward to Saturday. There is great value in your work especially when compared to things like Stock Simplifier and it's new release.