
Toll Roads of Finance: Valuing LSE, ICE, and CME Through a Quality Lens

Exchanges resemble toll roads, characterized by high incremental margins, network effects, and low capital intensity.
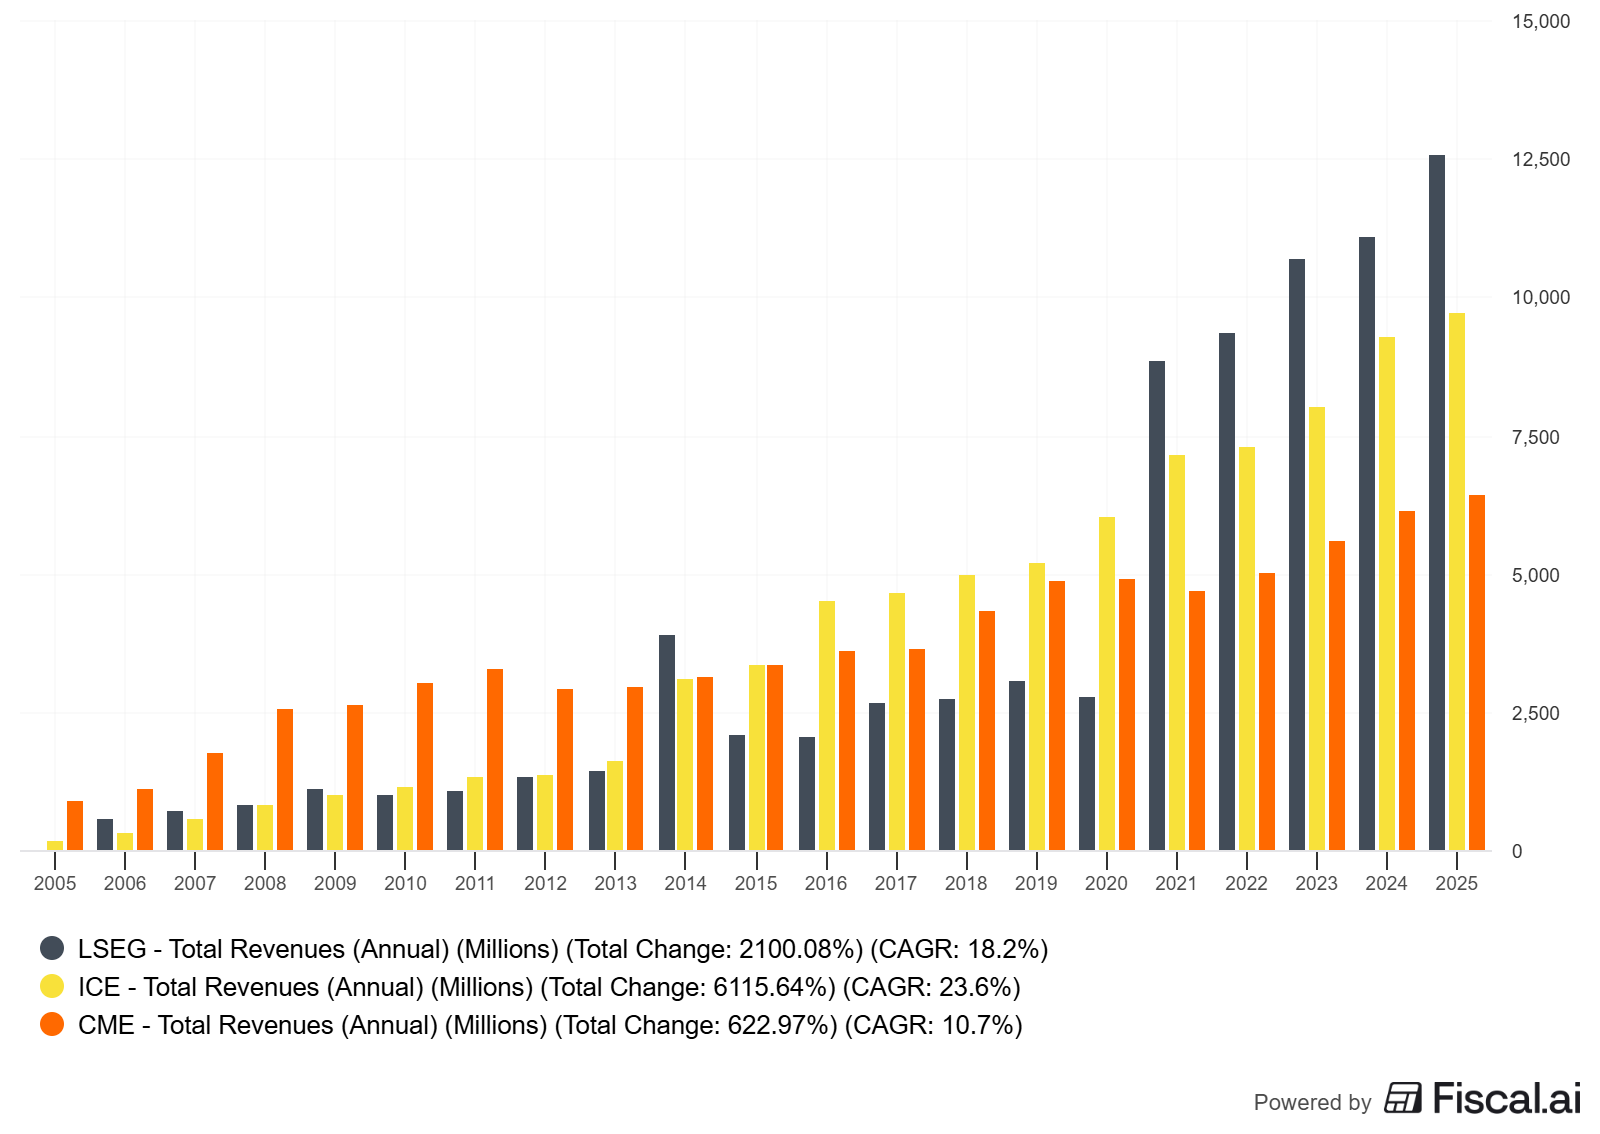
But not all toll roads collect the same fees. LSEG leans into data and indices, ICE leans into data and mortgages alongside energy/financial derivatives, and CME is the purest global clearinghouse scale play.
If you can separate unit economics from market noise, you can value the trio with simple, robust scenarios.
TL;DR
Exchanges are quality businesses: asset-light, recurring, and resilient. Focus on ROIC vs WACC, pricing power, and per-share value creation.
Revenue mix matters. LSEG skews to data/indices and post-trade; ICE to exchanges + fixed income/data + mortgage tech; CME to futures/clearing and market data.
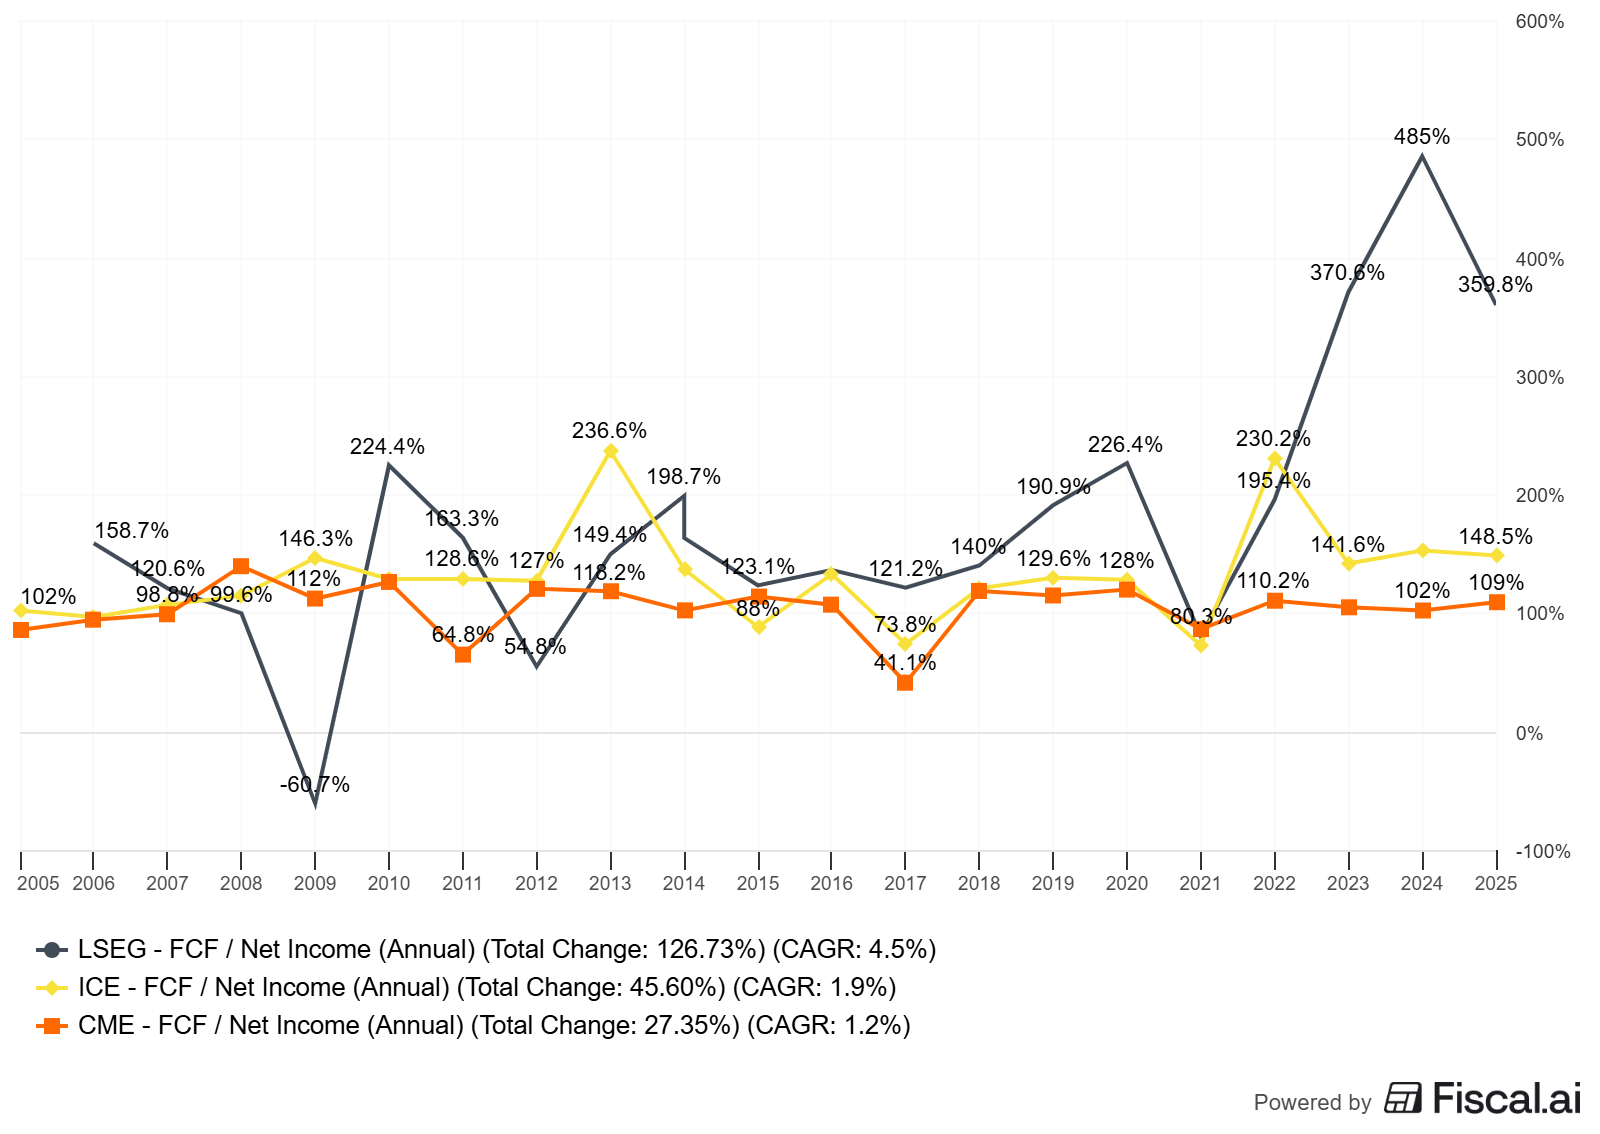
FCF conversion is strong across the set; capex intensity is low-to-mid single digits to low teens; large buybacks/dividends amplify per-share compounding.
Valuation is about durability and reinvestment runway. Use reverse DCF: bake mid-single-digit organic growth, stable-to-rising margins, and modest reinvestment.
Don’t overfit to recent volume spikes or interest rate tailwinds. Normalize to mid-cycle and test bear/base/bull scenarios.
Evidence of claims: verify moat durability through retention, price realization, share gains, and margin stability across cycles.
Why it matters
Exchanges and market infrastructure firms often deliver:
High gross and operating margins due to network effects and scale in matching and clearing.
Recurring revenues from data and connectivity.
Low incremental capital needs, enabling strong FCF conversion and shareholder returns.
Where investors go wrong:
Treating all exchange groups as identical. Mixing (data vs. trading vs. clearing vs. mortgage tech) changes cyclicality and valuation.
Overweighting volume spikes from macro events (e.g., rate volatility) and extrapolating peak economics.
Ignoring per-share framing. Buybacks and variable dividends (e.g., CME) versus reinvestment priorities materially affect compounding.
Not separating GAAP noise (acquisition amortization) from economic reality (owner earnings, equity free cash flow).
Core concepts (quality lens)
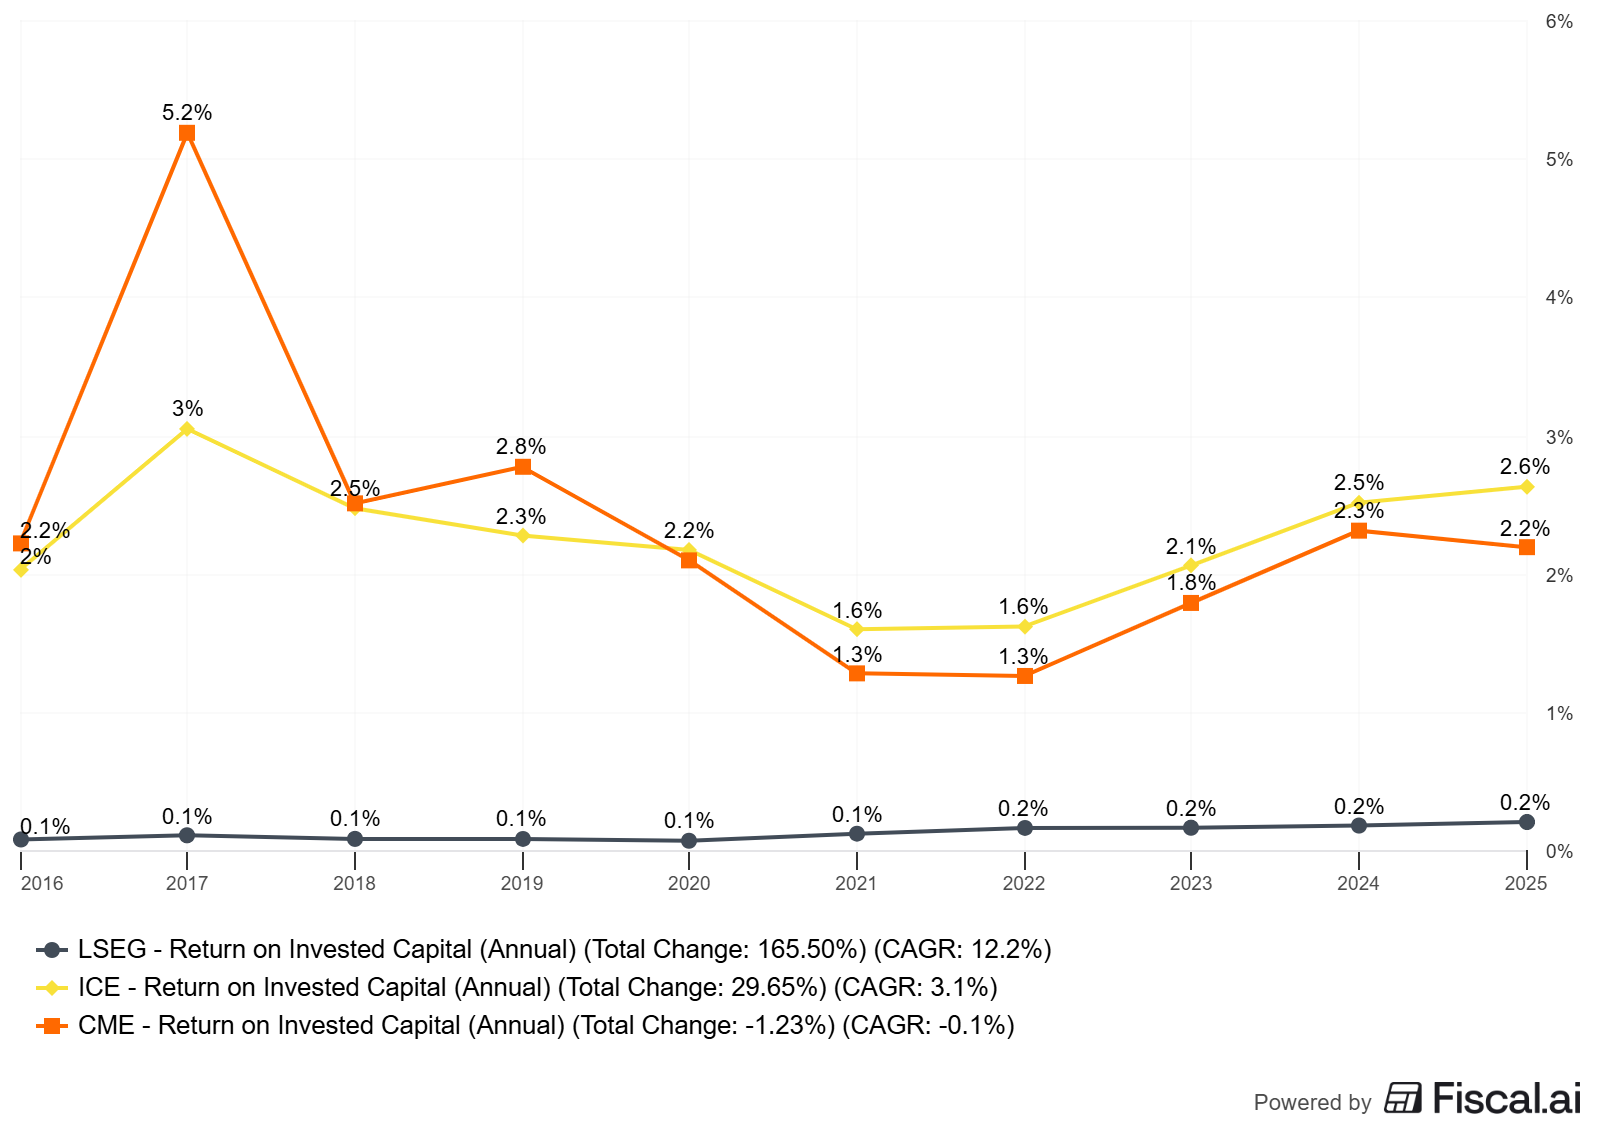
ROIC vs WACC and value creation
ROIC: after-tax operating profit divided by invested capital (including intangibles where appropriate). Exchanges typically post ROIC above WACC due to pricing power, switching costs, and regulated barriers.
WACC: blend of cost of equity and debt. For stable infrastructure-like businesses, WACC often sits high single digits (country- and rate-regime dependent).
Spread: A sustained ROIC – WACC > 5% is a strong marker for quality. Look at multi-year averages, not a single-year spike.
Practical proxy: Where ROIC disclosure is inconsistent, triangulate from operating margins, cash conversion, and reinvestment rates.
Reinvestment runway and capital intensity
Capital intensity is low. Capex typically runs in the high single digits to low teens percent of income for platform upgrades and cloud/data investments (e.g., LSEG guided capex intensity ~10% in 2025; see LSEG’s 2024 preliminary results) LSEG 2024 prelim, as of Feb 27, 2025.
Runway drivers: new products, cross-margining, post-trade optimization, data/indices penetration, cloud distribution, and geographic expansion.
Score reinvestment by incremental margins and retention—not just headline TAM.
Unit economics and per-share metrics
Incremental margins are high due to fixed-cost leverage. Volume or pricing gains are reflected in profit.
FCF conversion: owner earnings (after maintenance capex) usually track close to net income over time; watch working capital around clearing/treasury income cycles.
Per-share framing: CME prioritizes dividends (including a variable dividend); ICE focuses on buybacks when leverage allows; LSEG has executed significant buybacks following the reduction of the Refinitiv overhang.
Moat durability and evidence (not claims)
Evidence to seek:
Price realization and retention in data/indices.
Market share gains in key contracts.
Clearinghouse stickiness and capital efficiency benefits.
Margin stability through macro shifts.
Red flags: regulatory intervention on fees, migration risk in flagship products, structural competition in data pricing.
Valuation frameworks, drivers, and scenario design (Valuation Monday)
Reverse DCF: Solve for revenue CAGR and steady-state margins that justify today’s EV. Cross-check with history and peers.
Multiples vs medians: Compare EV/FCF and EV/EBIT to 5–10 year medians to gauge “through-cycle” valuation. Adjust for mix and rate regime.
Three drivers:
Normalized volume growth and elasticity to volatility.
Pricing power in data and listings/connectivity.
Incremental margins and capex intensity.
Worked example or mini case (mid-cap+; US or international)
Let’s pick LSEG (International) for the worked example, and compare back to ICE/CME.
What LSEG is today
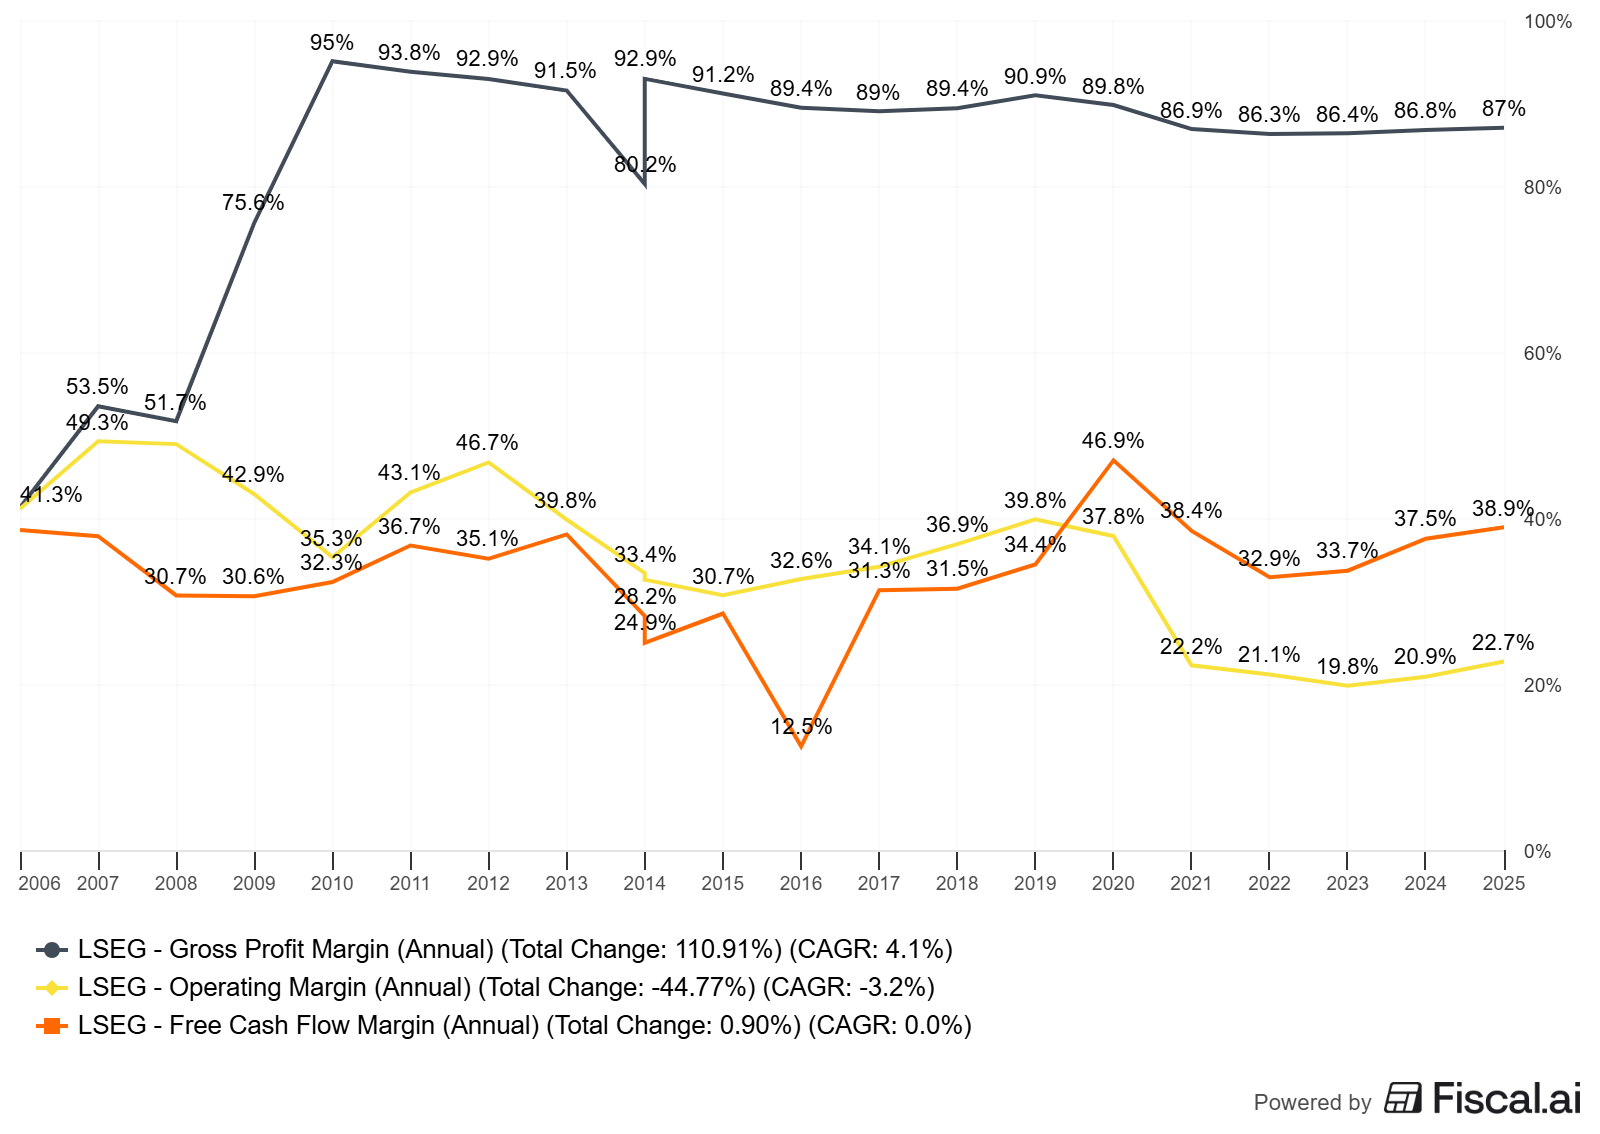
A multi-segment market infrastructure and data group (Data & Analytics, FTSE Russell, Capital Markets, Post Trade). 2024 adjusted EBITDA margin ~48.8%, up 160 bps, with equity free cash flow of ~£2.2B and £1B of buybacks in 2024 LSEG Annual Report 2024 and 2024 prelims, as of Feb 27, 2025: financial highlights and margin expansion; LSEG 2024 prelims; RNS PDF.
Guidance points to capex at ~10% of income and continued margin improvement (50–100 bps) in 2025 LSEG 2024 prelims, as of Feb 27, 2025.
Adjusted EPS grew ~12% to 363.5p in 2024 LSEG 2024 prelims, as of Feb 27, 2025.
Directional 5–10y trends (LSEG)
Revenue CAGR: post-Refinitiv, organic total income (excl recoveries) CAGR ~6.5% over 2021–2023 LSEG 2023 prelims, as of Feb 29, 2024.
Margin trend: adjusted EBITDA margin around high 40s%, with incremental improvement through integration and scaling (48.8% in 2024) LSEG 2024 prelims, as of Feb 27, 2025.
FCF conversion: equity free cash flow robust (e.g., £1.8B in 2023; ~£2.2B in 2024) [LSEG 2023 prelims; 2024 prelims, as of cited dates].
Per-share: buybacks reduced share count; dividend rising. Per-share value creation reinforced by lower overhang and improving mix.
Comparative context
ICE 2024: net revenues $9.3B (+16% y/y); adjusted operating margin 59%; record adjusted FCF >$3.6B; exchange segment margin ~73–75% ICE FY24 results, as of Feb 6, 2025.
CME 2024: record revenue $6.1B and operating income $3.9B (≈64% operating margin); net income $3.5B; large dividends including variable payout CME FY24 press release, as of Feb 12, 2025.
Caveats
ROIC at LSEG is muddied by large intangibles from Refinitiv; consider owner-earnings returns on tangible capital and incremental returns by segment.
Rate tailwinds (treasury income/clearing balances) can inflate short-term economics across groups; normalize to mid-cycle.
Mix shifts (e.g., mortgages at ICE, indices at LSEG) change cyclicality and capital needs.
How to do this yourself (step-by-step guide)
Data to gather (primary sources preferred)
Annual/quarterly filings: operating income, segment mix, cash flow, capex, SBC, working capital.
LSEG: Annual Report 2024; 2024 prelims.
CME: FY 2024 press release.
Investor presentations for margins, growth targets, and mix.
Market data (for EV): price, shares, net debt. Use your broker or a data terminal.
Exact checks and calculations
FCF conversion = FCF / Net Income over multi-years. Prefer “equity free cash flow” where disclosed (LSEG).
Capex intensity = Capex / Income (or revenue).
Per-share = EPS trend, FCF/share trend, and diluted share count trend. Include SBC addbacks if needed.
ROIC proxy = NOPAT / Invested Capital. When intangibles dominate, triangulate with incremental margins and organic growth to infer quality.
WACC = CAPM-based equity cost + after-tax debt cost (use a range: 8–10% for scenario tests; adjust for region/risk).
Decision rules and thresholds (pragmatic)
Prefer businesses with ROIC – WACC ≥ 5% sustained (or convincing proxies).
FCF conversion consistently >80% through-cycle.
Capex intensity ≤ 12% of income unless a high-return program is underway.
Evidence of price realization and retention in data/indices.
Per-share: look for rising FCF/share and disciplined buybacks (or a durable variable dividend in CME’s case).
Scenario design (Reverse DCF)
Base: organic revenue CAGR 5–6%, steady margins near current levels, capex intensity flat-to-down slightly; exit multiple near 10y median EV/EBIT or EV/FCF.
Bear: revenue CAGR 3–4%, small margin compression, WACC +100 bps; exit multiple below median.
Bull: revenue CAGR 7–8%, +100–150 bps margin, modest multiple premium or WACC –50 bps.
Solve for the implied EV today under each scenario; compare to market EV to assess required expectations.
Pitfalls and false positives
Over-crediting transient treasury/clearing income during rate spikes.
Treating every data dollar as equal. Some feeds/indices have stronger pricing power and retention than others.
Ignoring regulatory risk on fees or data pricing.
Extrapolating record volumes into perpetuity, volumes tend to mean-revert.
Counting on buybacks when leverage or regulatory capital constraints limit their options.
Checklist / one-pager
Business mix: % recurring data/indices vs transaction vs post-trade.
ROIC proxy and margin stability: ≥ 5% ROIC–WACC spread and margins stable across cycles?
FCF conversion: multi-year average >80%?
Capex intensity: ≤ 12% and trending down with scale?
Per-share: FCF/share up, share count flat/down, SBC < 4% of revenue unless offset by buybacks?
Moat evidence: retention, pricing power, share gains in key contracts, clearing stickiness.
Valuation: EV/FCF and EV/EBIT vs 5–10y medians; reverse DCF sanity check.
Risk audit: regulatory, product concentration, rate normalization, tech/latency arms race.
Mini-FAQ
Q1: Are exchanges cyclicals?
A: Less than many financials. Volumes correlate with volatility, but data and connectivity are recurring. Clearing adds resilience.
Q2: How do rising rates affect them?
A: Positive in the near term via treasury/clearing income and higher rate-product volumes. Normalize to mid-cycle in valuation.
Q3: What’s the cleanest quality tell?
A: Multi-year ROIC–WACC spread plus stable and rising FCF/share. Margin resilience through calm and volatile markets.
Q4: Which multiple matters—EV/EBITDA, EV/EBIT, or EV/FCF?
A: Prefer EV/EBIT and EV/FCF for capital-light businesses with varied amortization; cross-check to 5–10y medians.
Q5: LSEG vs ICE vs CME—who’s “best”?
A: Depends on your preference: LSEG for data/indices and post-trade ecosystem; ICE for diversified engines (exchanges, fixed income/data, mortgage tech); CME for pure clearing scale and variable dividend compounding. Price each with its own mix and risk.
Glossary
ROIC: Return on invested capital; a measure of economic profitability.
WACC: Weighted average cost of capital; discount rate for cash flows.
Clearinghouse: Central counterparty that stands between buyers and sellers, reducing counterparty risk.
ASV: Annual subscription value; forward-looking contracted value for data/analytics.
FCF conversion: Ratio of free cash flow to net income over time.
Capex intensity: Capital expenditures as a percentage of revenue/income.
Per-share framing: Focus on FCF/share, EPS/share, and share count.
Treasury income: Interest earned on cash collateral balances at clearinghouses.
Further reading
LSEG 2024 Annual Report (as of Feb 27, 2025): LSEG Annual Report 2024
LSEG 2024 Preliminary Results (as of Feb 27, 2025): 2024 Preliminary Results
ICE FY 2024 Results (as of Feb 6, 2025): ICE FY24 Results
CME FY 2024 Results (as of Feb 12, 2025): CME FY24 Results
Basic reverse DCF walkthrough (general resource): Most finance textbooks or your preferred valuation primer; adapt to per-share owner earnings.
References
LSEG Annual Report 2024 (financial highlights including adjusted EBITDA margin and strategy), as of Feb 27, 2025: LSEG Annual Report 2024 and direct PDF: Annual Report PDF
LSEG 2024 Preliminary Results (equity free cash flow, margin improvement, capex intensity guidance), as of Feb 27, 2025: 2024 Preliminary Results and RNS PDF: RNS PDF
LSEG 2023 Preliminary Results (organic CAGR and integration targets), as of Feb 29, 2024: 2023 Preliminary Results and press release: Press Release
ICE FY 2024 Results (net revenues, margins, record operating cash flow/FCF), as of Feb 6, 2025: ICE FY24 Results
CME FY 2024 Results (revenue, operating income, dividends), as of Feb 12, 2025: CME FY24 Results
Disclaimer: Educational content, not investment advice.
Educational content, not investment advice.