
Three Types of Dividend Growth Stocks: A Framework for Building the Right Portfolio

Not all dividend stocks are created equal.
Some investors chase the highest yields, only to watch their “income stocks” cut the dividend and crater in price. Others buy fast-growing companies with tiny yields and wonder when the income will ever show up. The problem isn’t dividend investing itself. The problem is treating all dividend growth stocks as one category when there are actually three distinct types, each serving a different purpose in your portfolio.
In today’s post, I’ll walk you through a framework for categorizing dividend growth stocks into three types, explain the trade-offs of each, and show you how to evaluate which type fits your investing goals. We’ll use real companies and actual financial data to bring each category to life.
Here’s what we’ll cover:
Why categorizing dividend stocks matters
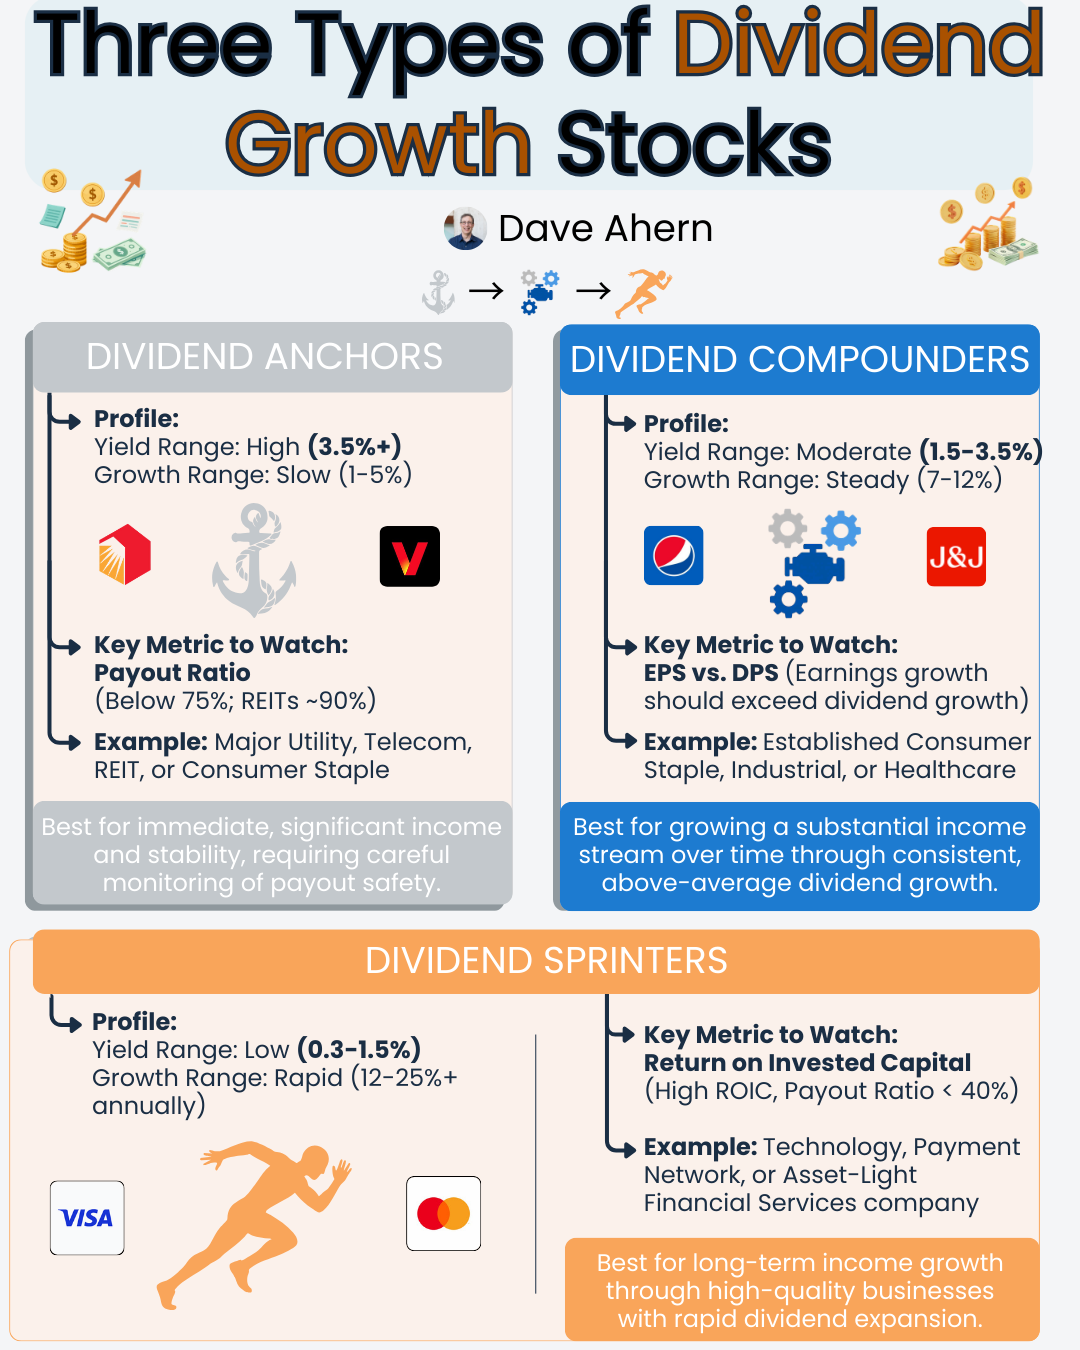
Type 1: Dividend Anchors (high yield, slow growth)
Type 2: Dividend Compounders (moderate yield, steady growth)
Type 3: Dividend Sprinters (low yield, rapid growth)
How to match each type to your investing goals
Common mistakes investors make with dividend stocks
Why Categorizing Dividend Stocks Matters
When most investors think about dividend stocks, they focus on one number: the current yield. That’s like buying a car based solely on the sticker price without considering fuel costs, maintenance, or how long it will last.
Dividend yield tells you the annual dividend payment divided by the current stock price. A 4% yield on a $100 stock means $4 in dividends per year. Simple enough. But yield alone tells you nothing about whether that dividend will grow, stay flat, or get cut next quarter.
Dividend growth rate tells you how fast the company is increasing its dividend payments over time. This is where the real wealth-building happens. A company growing its dividend at 10% per year will double the payout in roughly seven years. A company growing at 3% takes 24 years to grow at the same rate.
The relationship between yield and growth creates three distinct categories. Think of it like Buffett’s three types of businesses from his 2007 shareholder letter. He described a spectrum from dream businesses (high returns, low capital needs) to gruesome businesses (low returns, high capital needs). Dividend stocks follow a similar pattern, and understanding where a company falls on that spectrum changes how you should evaluate it.
Type 1: Dividend Anchors
Profile: High current yield (3.5%+), slow dividend growth (1-5% annually)
Dividend Anchors are the workhorses of income portfolios. They pay generous current yields but grow their dividends slowly. These tend to be mature companies in stable industries, such as utilities, telecom, real estate investment trusts (REITs), and consumer staples.
The appeal is straightforward. You buy the stock and collect a meaningful income stream right away. If you invest $100,000 in a stock yielding 4.5%, you’re collecting $4,500 per year in dividends from day one.
What makes a good Anchor?
The key question with Anchors is dividend safety. Because these companies already pay out a large share of their earnings as dividends, there’s less room for error. If earnings dip, the dividend could be at risk. That’s why payout ratios matter enormously for this category.
The payout ratio is the percentage of earnings paid out as dividends. For Anchors, I want to see a payout ratio below 75% for most industries. REITs are an exception because they’re required to distribute 90% of taxable income, so their payout ratios naturally run higher.
Real Company Example: Realty Income (O)
Realty Income is a textbook Dividend Anchor. The company is a REIT that owns over 15,400 commercial properties leased to tenants such as Walgreens, Dollar General, and FedEx under long-term net-lease agreements.
As of Realty Income’s 2024 10-K:
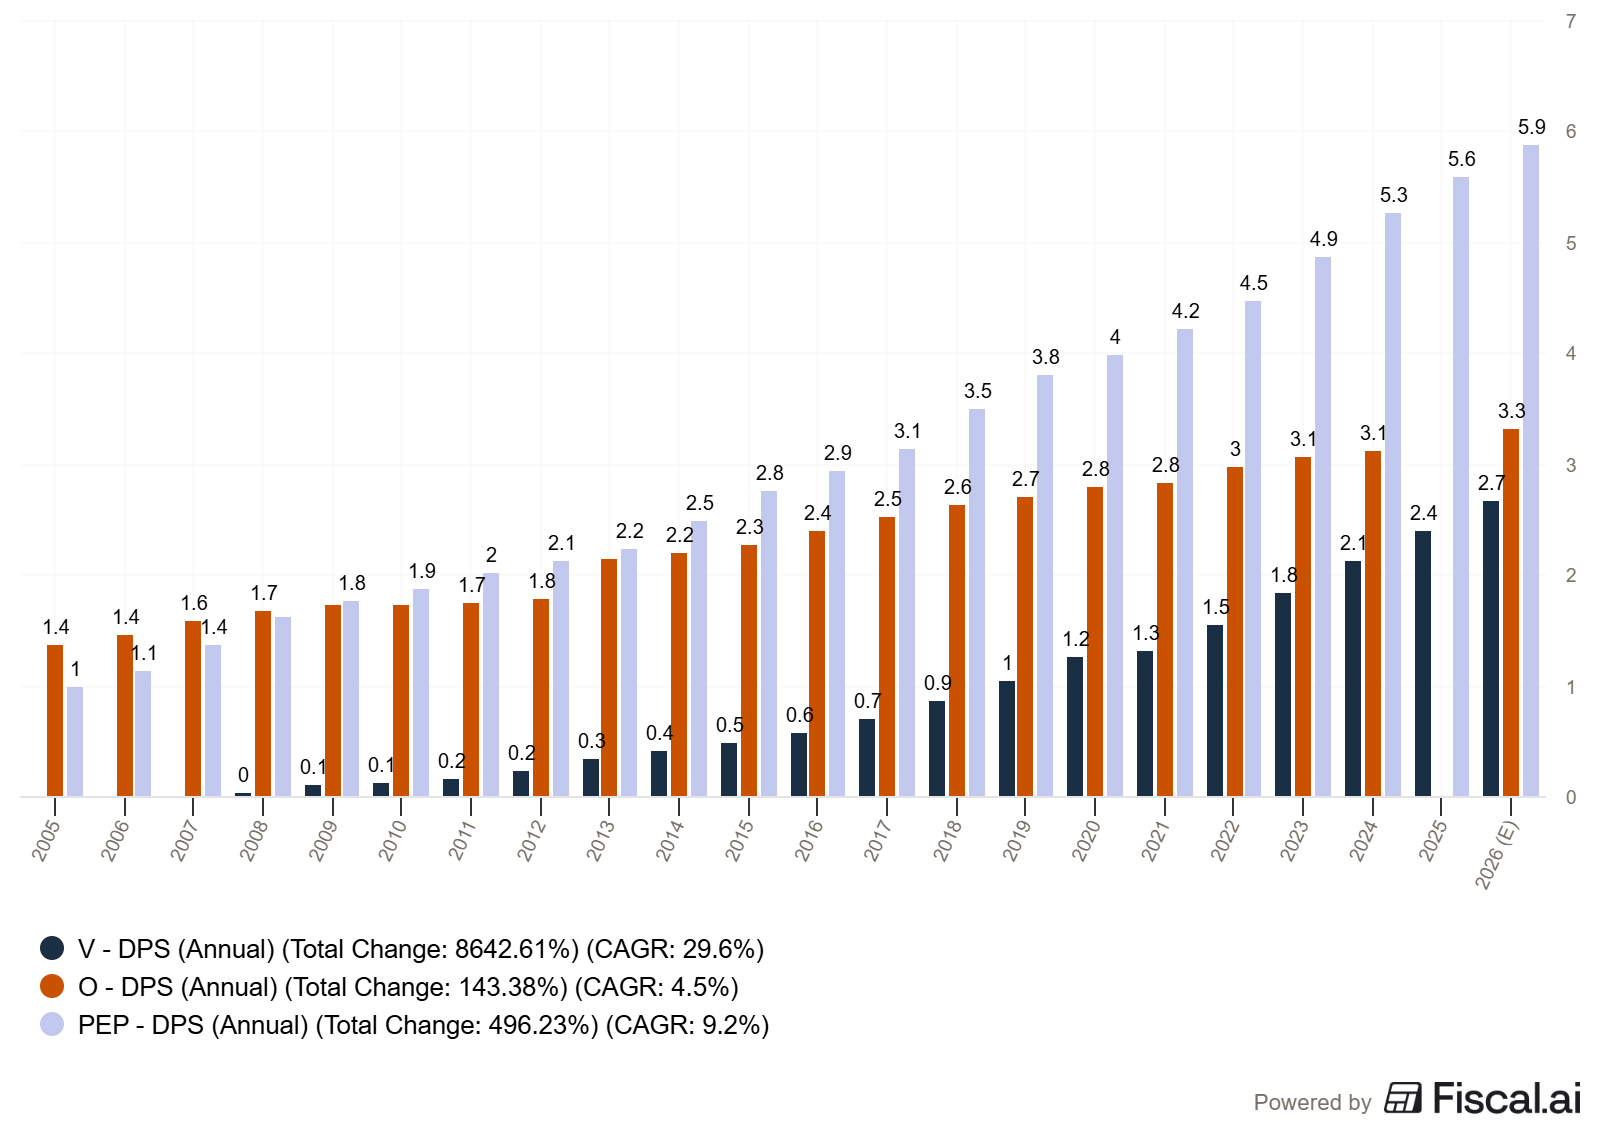
Dividend yield: approximately 4.9%
5-year dividend growth rate: approximately 2.9% annually
The company has increased its dividend for over 113 consecutive quarters
Adjusted Funds from Operations (AFFO) per share aviailable for payout: $4.20 per share
What makes Realty Income a quality Anchor is the predictability of its cash flows. Net lease agreements mean the tenant pays property taxes, insurance, and maintenance. Revenue is contractual. That stability supports the consistent dividend.
What to watch for with Anchors:
Payout ratios creeping above 80% (75% for non-REITs)
Declining revenue or earnings over multiple years
Rising debt levels without corresponding asset growth
Industry disruption that threatens the business model
The risk with Anchors is that slow growth may not keep pace with inflation over the long term. If your dividend grows at 2% per year and inflation runs at 3%, your purchasing power is actually shrinking. That’s why Anchors work best as one piece of a broader dividend strategy, not the entire portfolio.
Type 2: Dividend Compounders
Profile: Moderate yield (1.5-3.5%), steady dividend growth (7-12% annually)
If Anchors are the workhorses, Compounders are the engines. They offer a decent starting yield combined with consistent, above-average dividend growth. Over time, that growth rate transforms a modest yield into a substantial income stream on your original investment.
This is where the math gets exciting. A stock with a 2.5% yield growing its dividend at 10% annually will yield over 6.5% on your original cost basis in ten years. The same dollar invested in an Anchor yielding 4.5% with 3% growth will yield about 6% on cost in the same period. The Compounder catches up and then surpasses the Anchor.
Compounders tend to be established companies with strong competitive positions, healthy balance sheets, and room to grow both earnings and dividends. Consumer staples, industrials, and healthcare companies often appear in this category.
What makes a good Compounder?
For Compounders, I focus on the relationship between earnings growth and dividend growth. A company can’t sustainably grow its dividend faster than its earnings for long. Eventually, the payout ratio maxes out and dividend growth stalls or the company cuts back.
The magic formula: look for companies where earnings-per-share growth exceeds dividend growth by a small margin. That means the payout ratio is gradually declining, giving the company even more flexibility going forward.
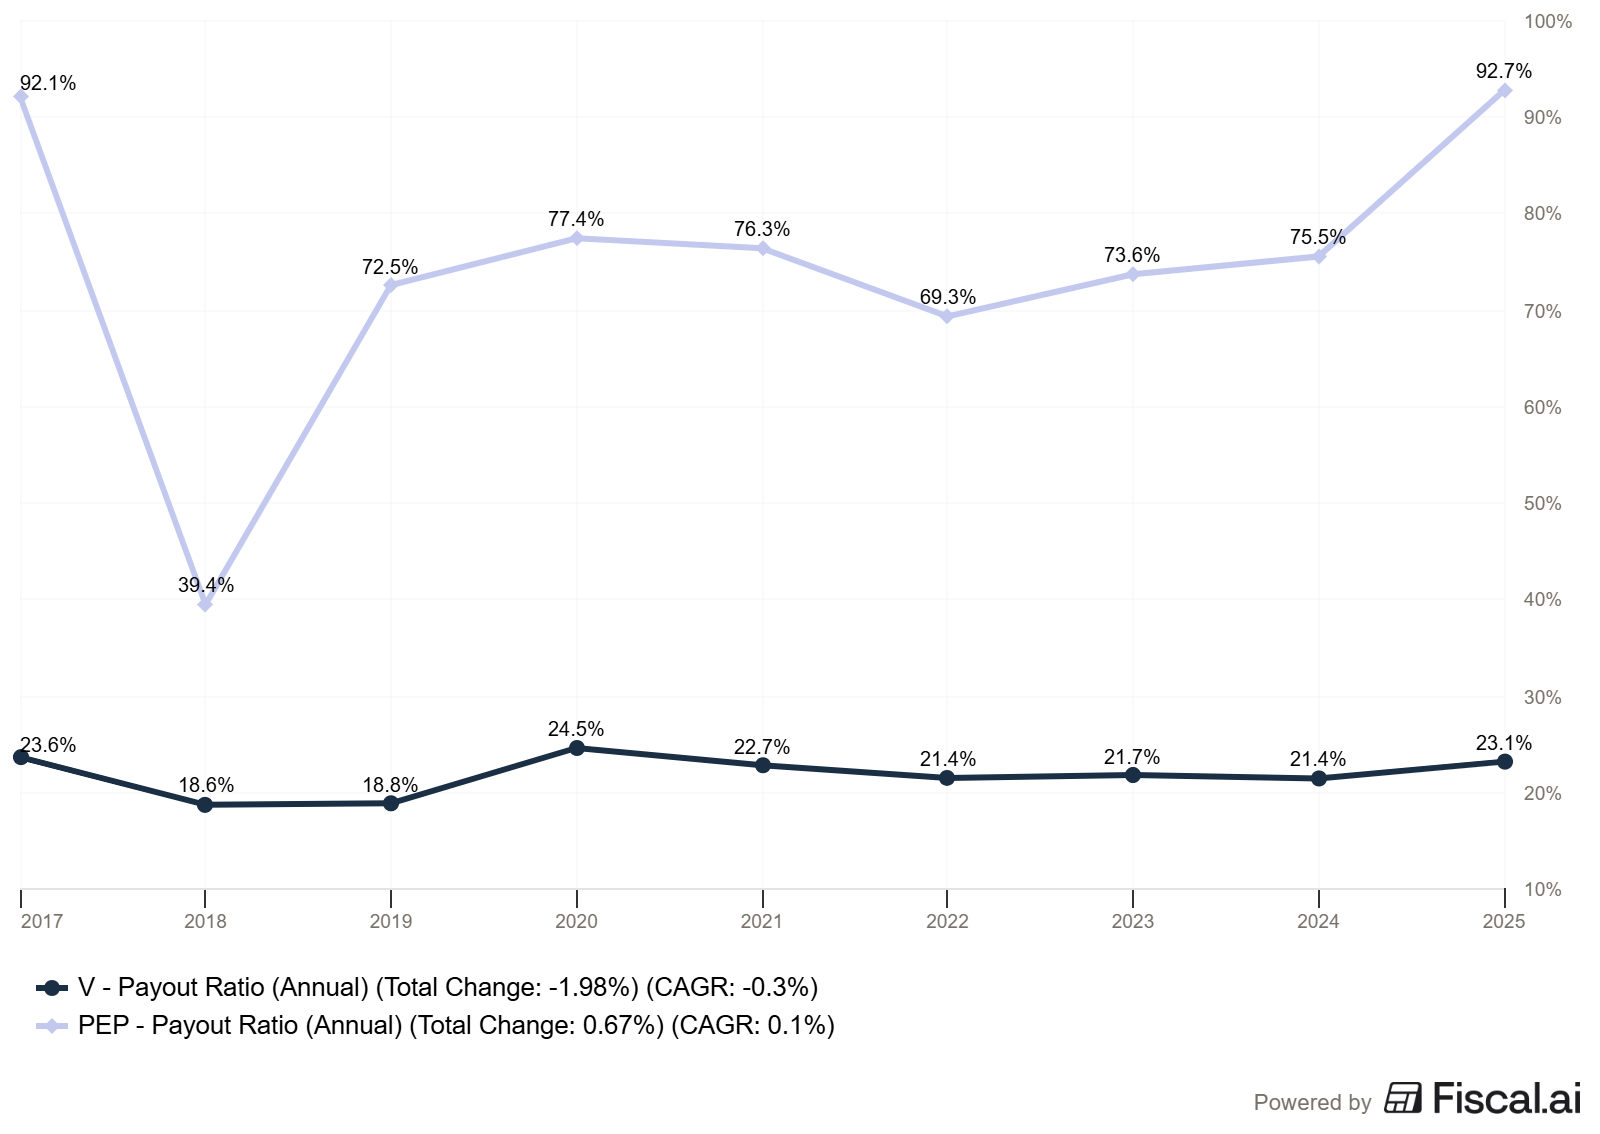
Real Company Example: PepsiCo (PEP)
PepsiCo is a classic Compounder. The company operates a diversified food and beverage business, including brands such as Pepsi, Frito-Lay, Gatorade, and Quaker Oats. That diversification across snacks and beverages provides more stable revenue than a pure beverage company.
From PepsiCo’s recent filings:
Dividend yield: approximately 3.4%
5-year dividend growth rate: approximately 7% annually
Consecutive years of dividend increases: 54+ years
Payout ratio: 93.4%
PepsiCo’s competitive advantage comes from its distribution network and brand portfolio. Frito-Lay alone controls a dominant share of the U.S. salty snack market. That kind of market position gives PepsiCo the pricing power Buffett loves, which directly translates into earnings growth that fuels dividend increases.
What to watch for with Compounders:
Dividend growth that consistently outpaces earnings growth (unsustainable)
Acquisitions funded by debt that inflate revenue but compress returns on capital
Deteriorating ROIC, which signals the company is investing in lower-quality growth
Management chooses buybacks over dividend growth when the stock is overvalued
The beauty of Compounders is that patience is rewarded. The initial yield doesn’t look impressive compared to an Anchor, but give it a decade of steady 8-10% dividend growth and the income stream becomes substantial. Buffett’s investment in Coca-Cola is the ultimate example. Berkshire’s yield on its original cost basis has grown to extraordinary levels over decades of dividend increases.
Knowing the concepts is one thing. Being able to sit down with a real dividend stock and actually analyze it is another. Paid membership gives you the tools to bridge that gap:
📊 1. Stock Analysis Infographic Library: 180+ visual references covering financial statements, valuation multiples, and dividend metrics, your cheat sheet for analyzing any company
🤖 2. AI Prompt Library: 10 purpose-built prompts that turn AI into a research partner, stress-test your thesis, dig into financials faster, and catch risks you’d otherwise miss
🔧 3. Investing Tools Suite: 4 analytical tools that take the friction out of the numbers so you can focus on understanding the business, not wrestling with spreadsheets
🎓 4. Skill Workshop: Practical working sessions walking through real company analysis start to finish, not theory, not lectures, actual practice
📈 5. Dividend Analysis Course (Coming Soon): A complete step-by-step course on analyzing dividend stocks using Buffett-inspired fundamental analysis
🔓 6. Everything Added Going Forward: Every new resource, tool, and prompts added automatically, no extra charge, ever
Type 3: Dividend Sprinters
Profile: Low current yield (0.3-1.5%), rapid dividend growth (12-25%+ annually)
Dividend Sprinters are the category most income investors ignore. The current yield looks laughable compared to Anchors. Why would you buy a stock yielding 0.7% when you could get 5%?
The answer is growth.
Sprinters are typically high-quality businesses generating strong free cash flow with relatively low payout ratios. They’re reinvesting heavily into growth while simultaneously increasing dividends at aggressive rates. The combination of business growth and a rising payout ratio creates rapid dividend expansion.
These companies often have the characteristics Buffett describes as “dream businesses” in his 2007 letter: high returns on capital, low capital requirements, and the ability to grow without consuming enormous amounts of capital. Technology, payment networks, and asset-light financial services companies frequently fall into this category.
What makes a good Sprinter?
The essential metric for Sprinters is return on invested capital (ROIC). As we’ve discussed in past articles, ROIC tells you how efficiently a company turns its invested capital into profits. Sprinters with high ROIC can grow earnings rapidly without retaining all their profits, which funds those fast-growing dividends.
I also look for a low payout ratio (below 40%) combined with strong free cash flow growth. The low payout ratio means the company has a long runway to increase dividends even if earnings growth temporarily slows.
Real Company Example: Visa (V)
Visa is perhaps the best example of a Dividend Sprinter. The company operates the world’s largest payment network, processing billions of transactions annually. As we’ve covered in our payment processing deep dive, Visa doesn’t take credit risk or lend money. It simply collects a fee on every transaction that flows through its network.
From Visa’s recent filings:
Dividend yield: 0.9%
5-year dividend growth rate: 15.2% annually
Payout ratio: 23.6%
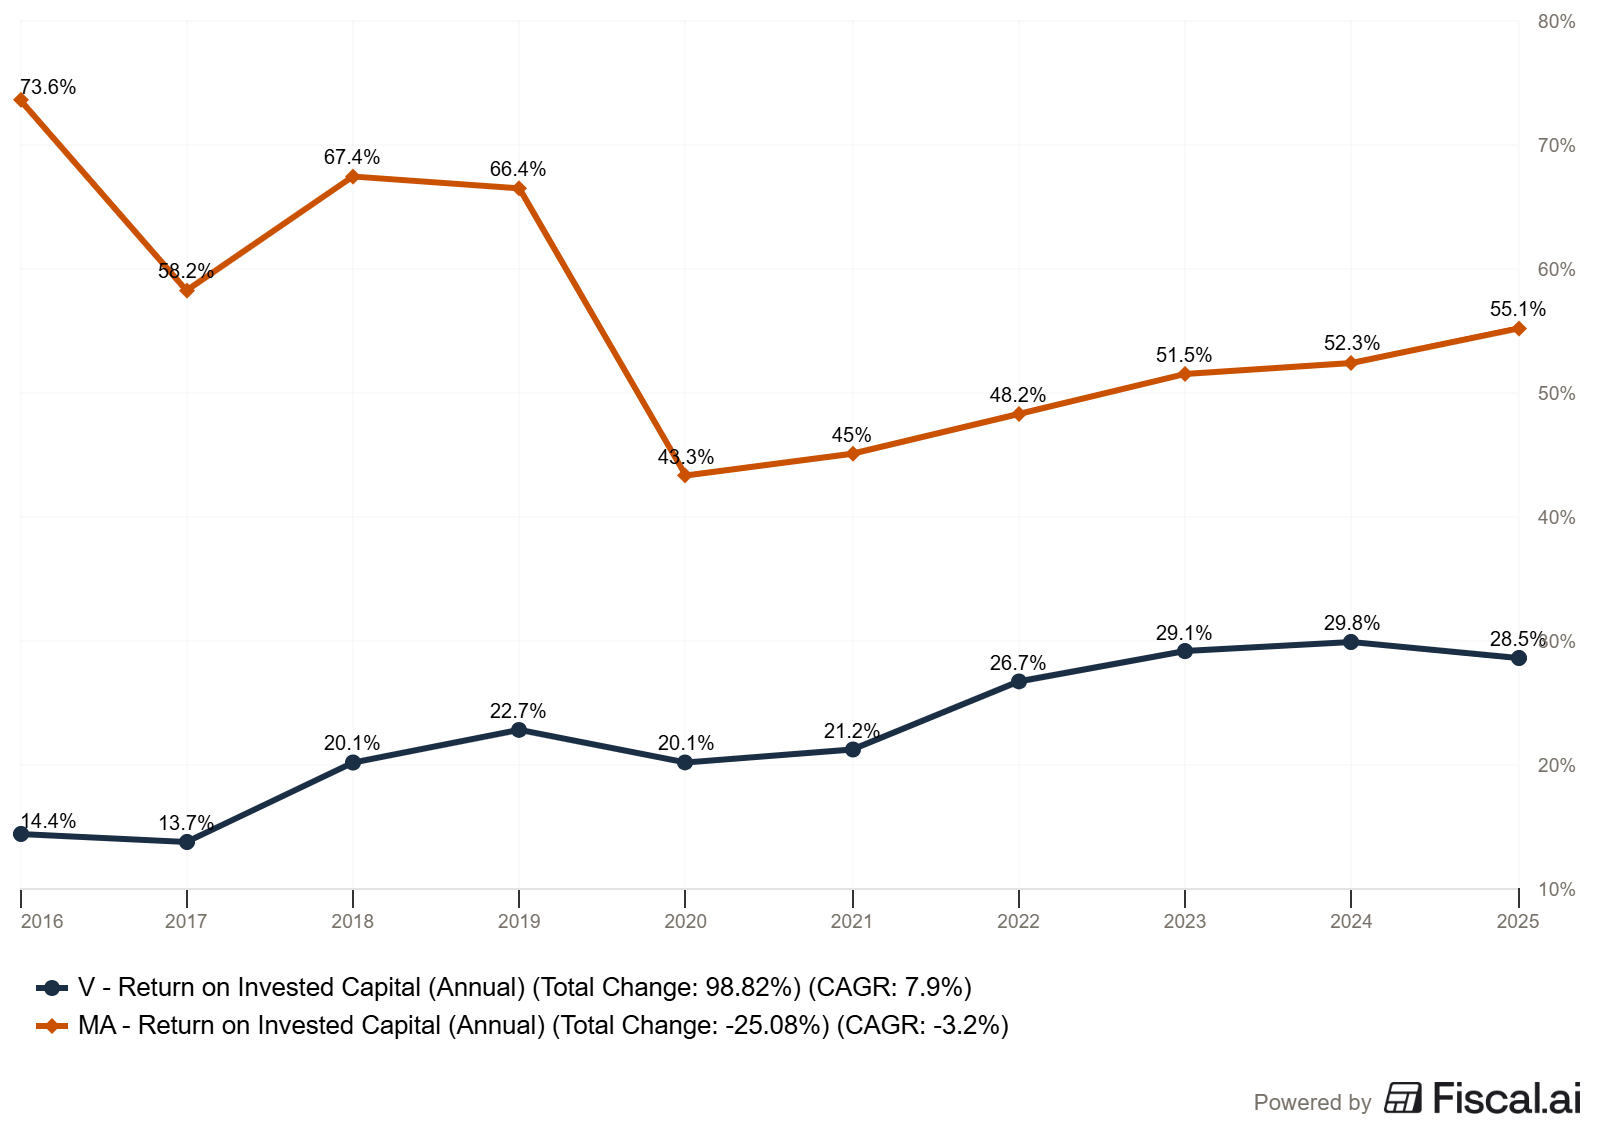
ROIC: 24.7%
Free cash flow margin: 55.4%
Think about what those numbers mean together. Visa is paying out less than a quarter of its earnings as dividends while growing that dividend at 15%+ per year. The payout ratio is so low that even if earnings growth slowed meaningfully, Visa could continue raising the dividend at double-digit rates for years just by allowing the payout ratio to increase.
This connects directly to Buffett’s framework. Visa is a capital-light business with enormous returns on invested capital. It doesn’t need to build factories or buy fleets of trucks to grow. When more transactions flow through the network, revenue grows with minimal additional investment. That’s the “dream business” economics Buffett described with See’s Candies, scaled up to a global payment network.
What to watch for with Sprinters:
Sudden deceleration in revenue growth, which could slow dividend growth
The company is abandoning dividends in favor of excessive buybacks at high valuations
Competitive threats that could erode the business model (for tech companies, especially)
ROIC is declining over time, suggesting the competitive advantage is weakening
Putting It All Together: A Side-by-Side Comparison
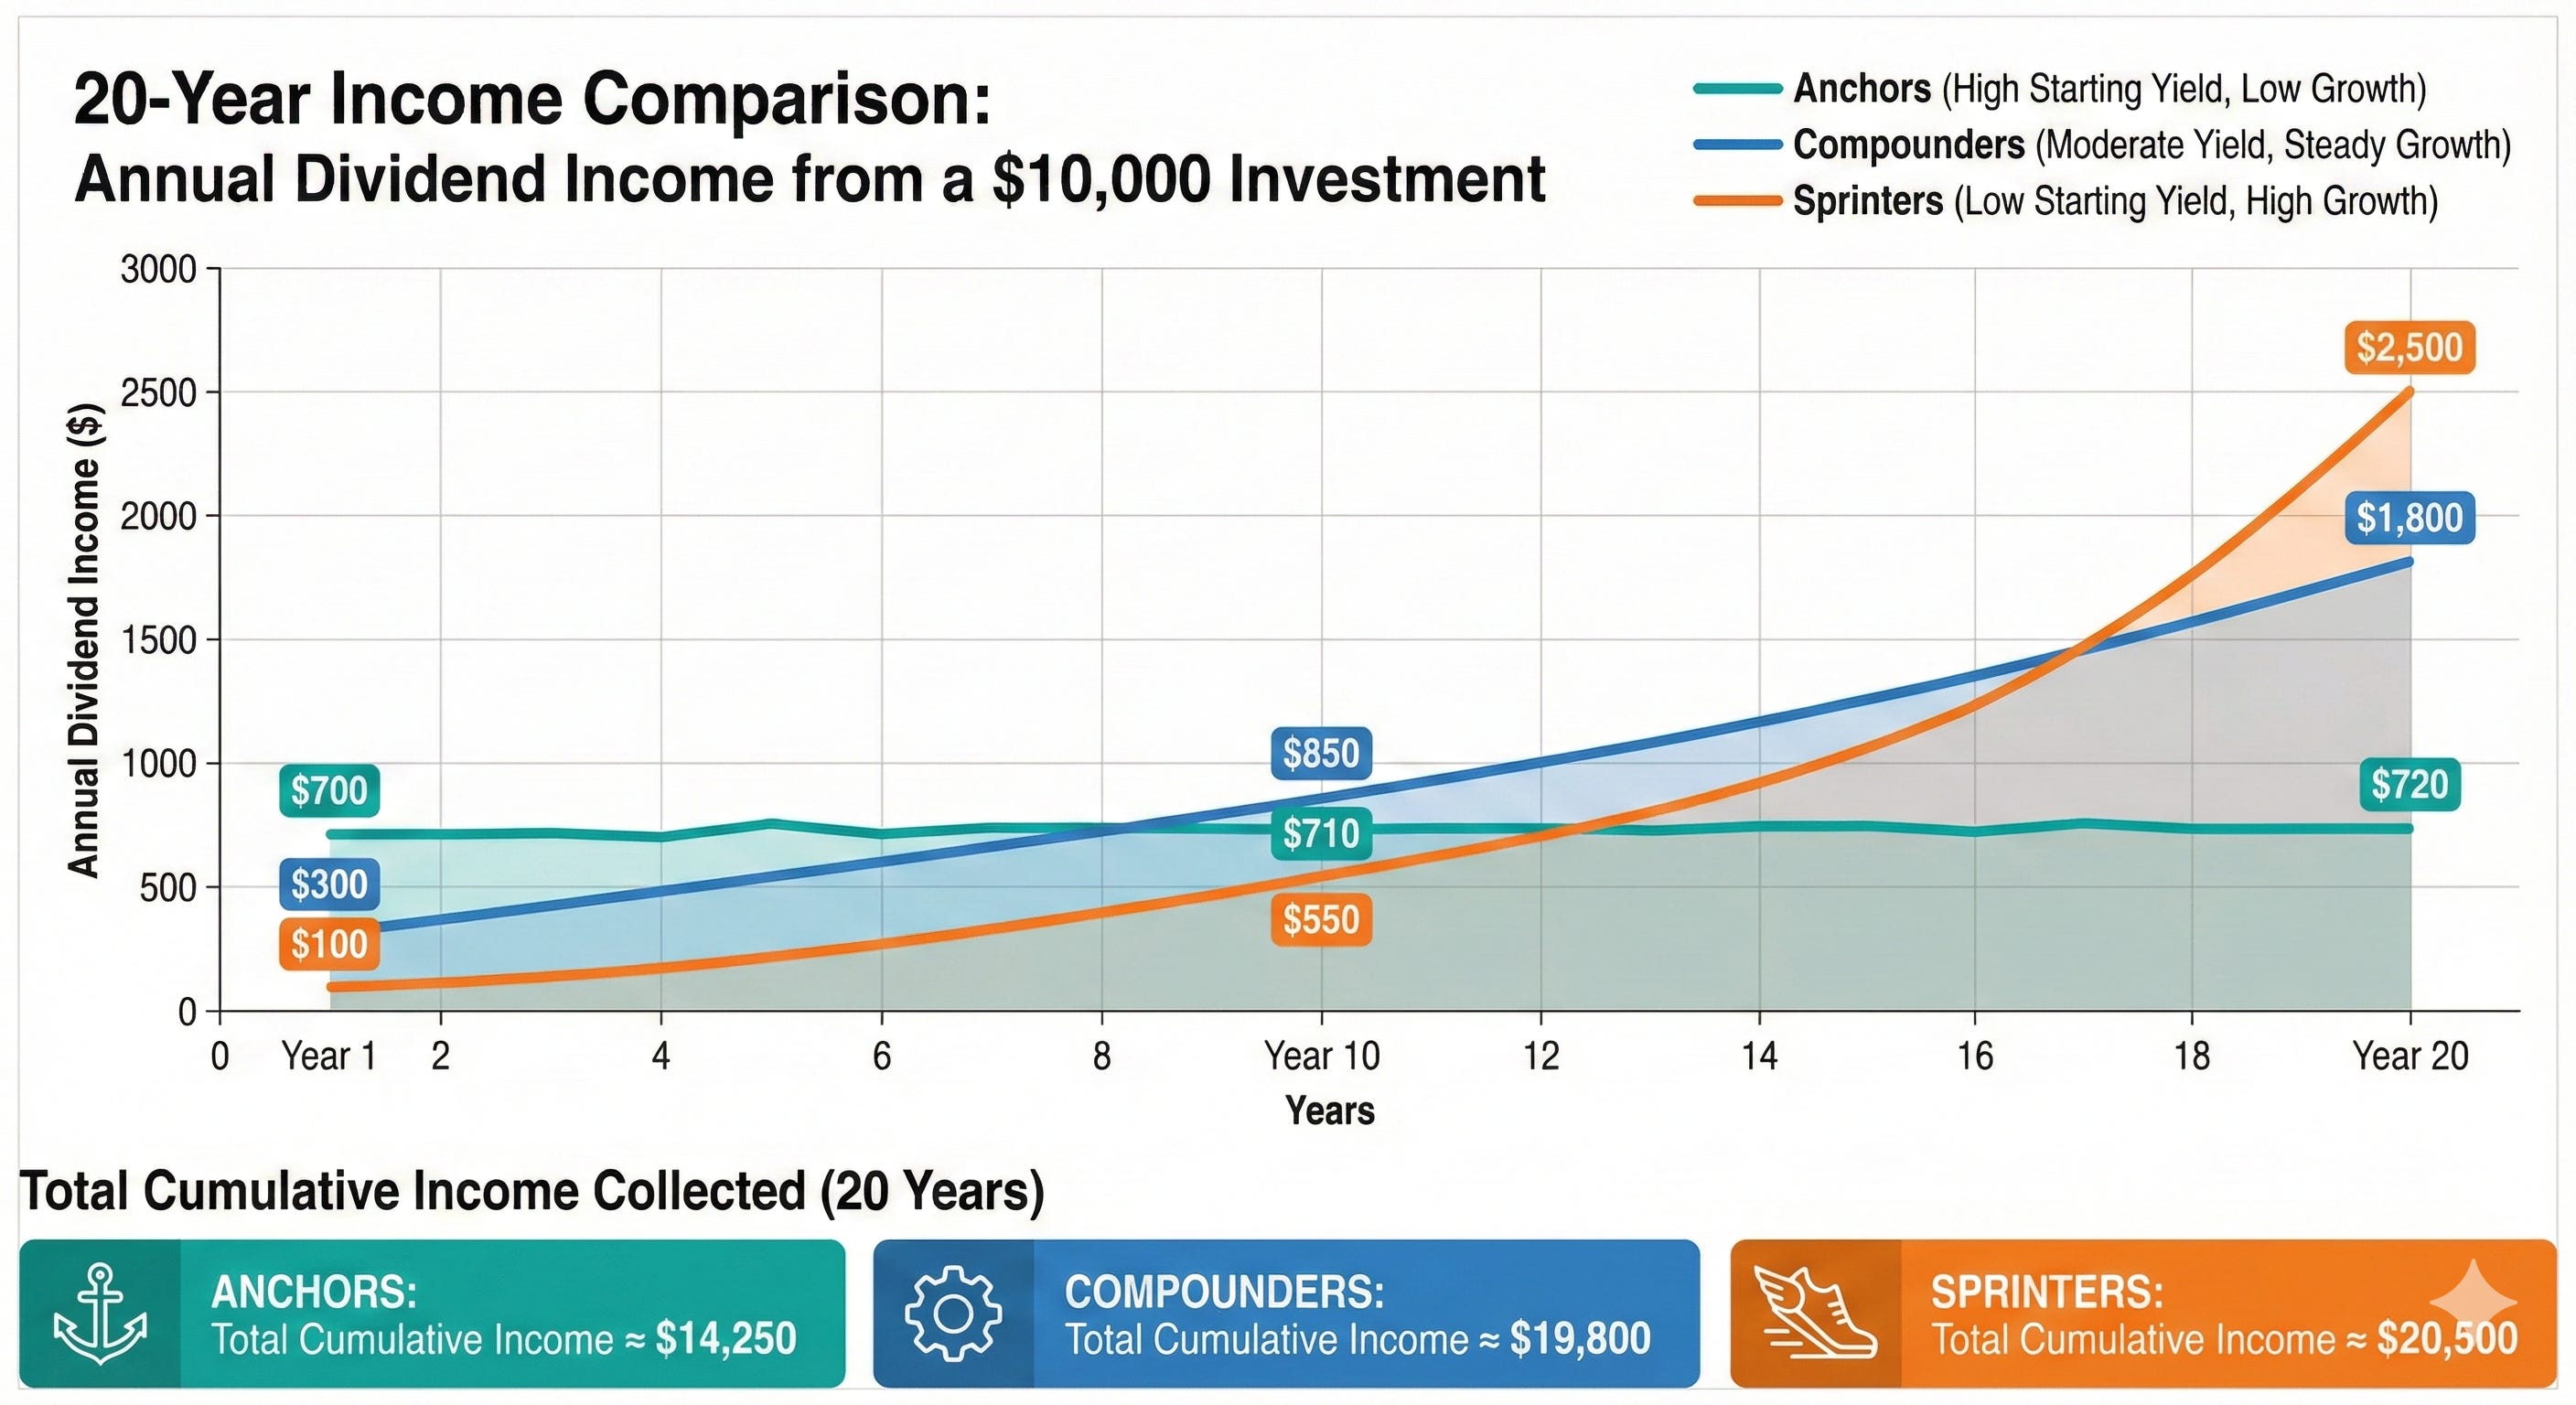
To see how these three types perform differently over time, let’s look at a hypothetical $10,000 investment in each category.
Assumptions:
Anchor: 4.5% starting yield, 3% annual dividend growth
Compounder: 2.5% starting yield, 9% annual dividend growth
Sprinter: 0.8% starting yield, 16% annual dividend growth
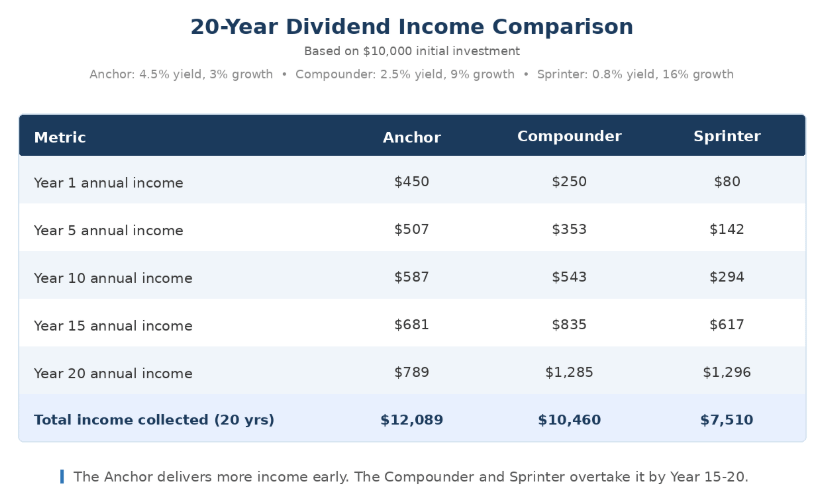
The table reveals the trade-off clearly. The Anchor delivers more income in the early years and collects the most total income over 20 years. But the Compounder and Sprinter are producing significantly more annual income by year 15-20. If you extend the time horizon to 25 or 30 years, the Sprinter dominates.
This is why your time horizon matters. If you need income today (retirement, living expenses), Anchors carry more weight. If you’re building wealth for the future, Compounders and Sprinters offer more total return potential.
Screening Criteria: What I Look For in Each Type
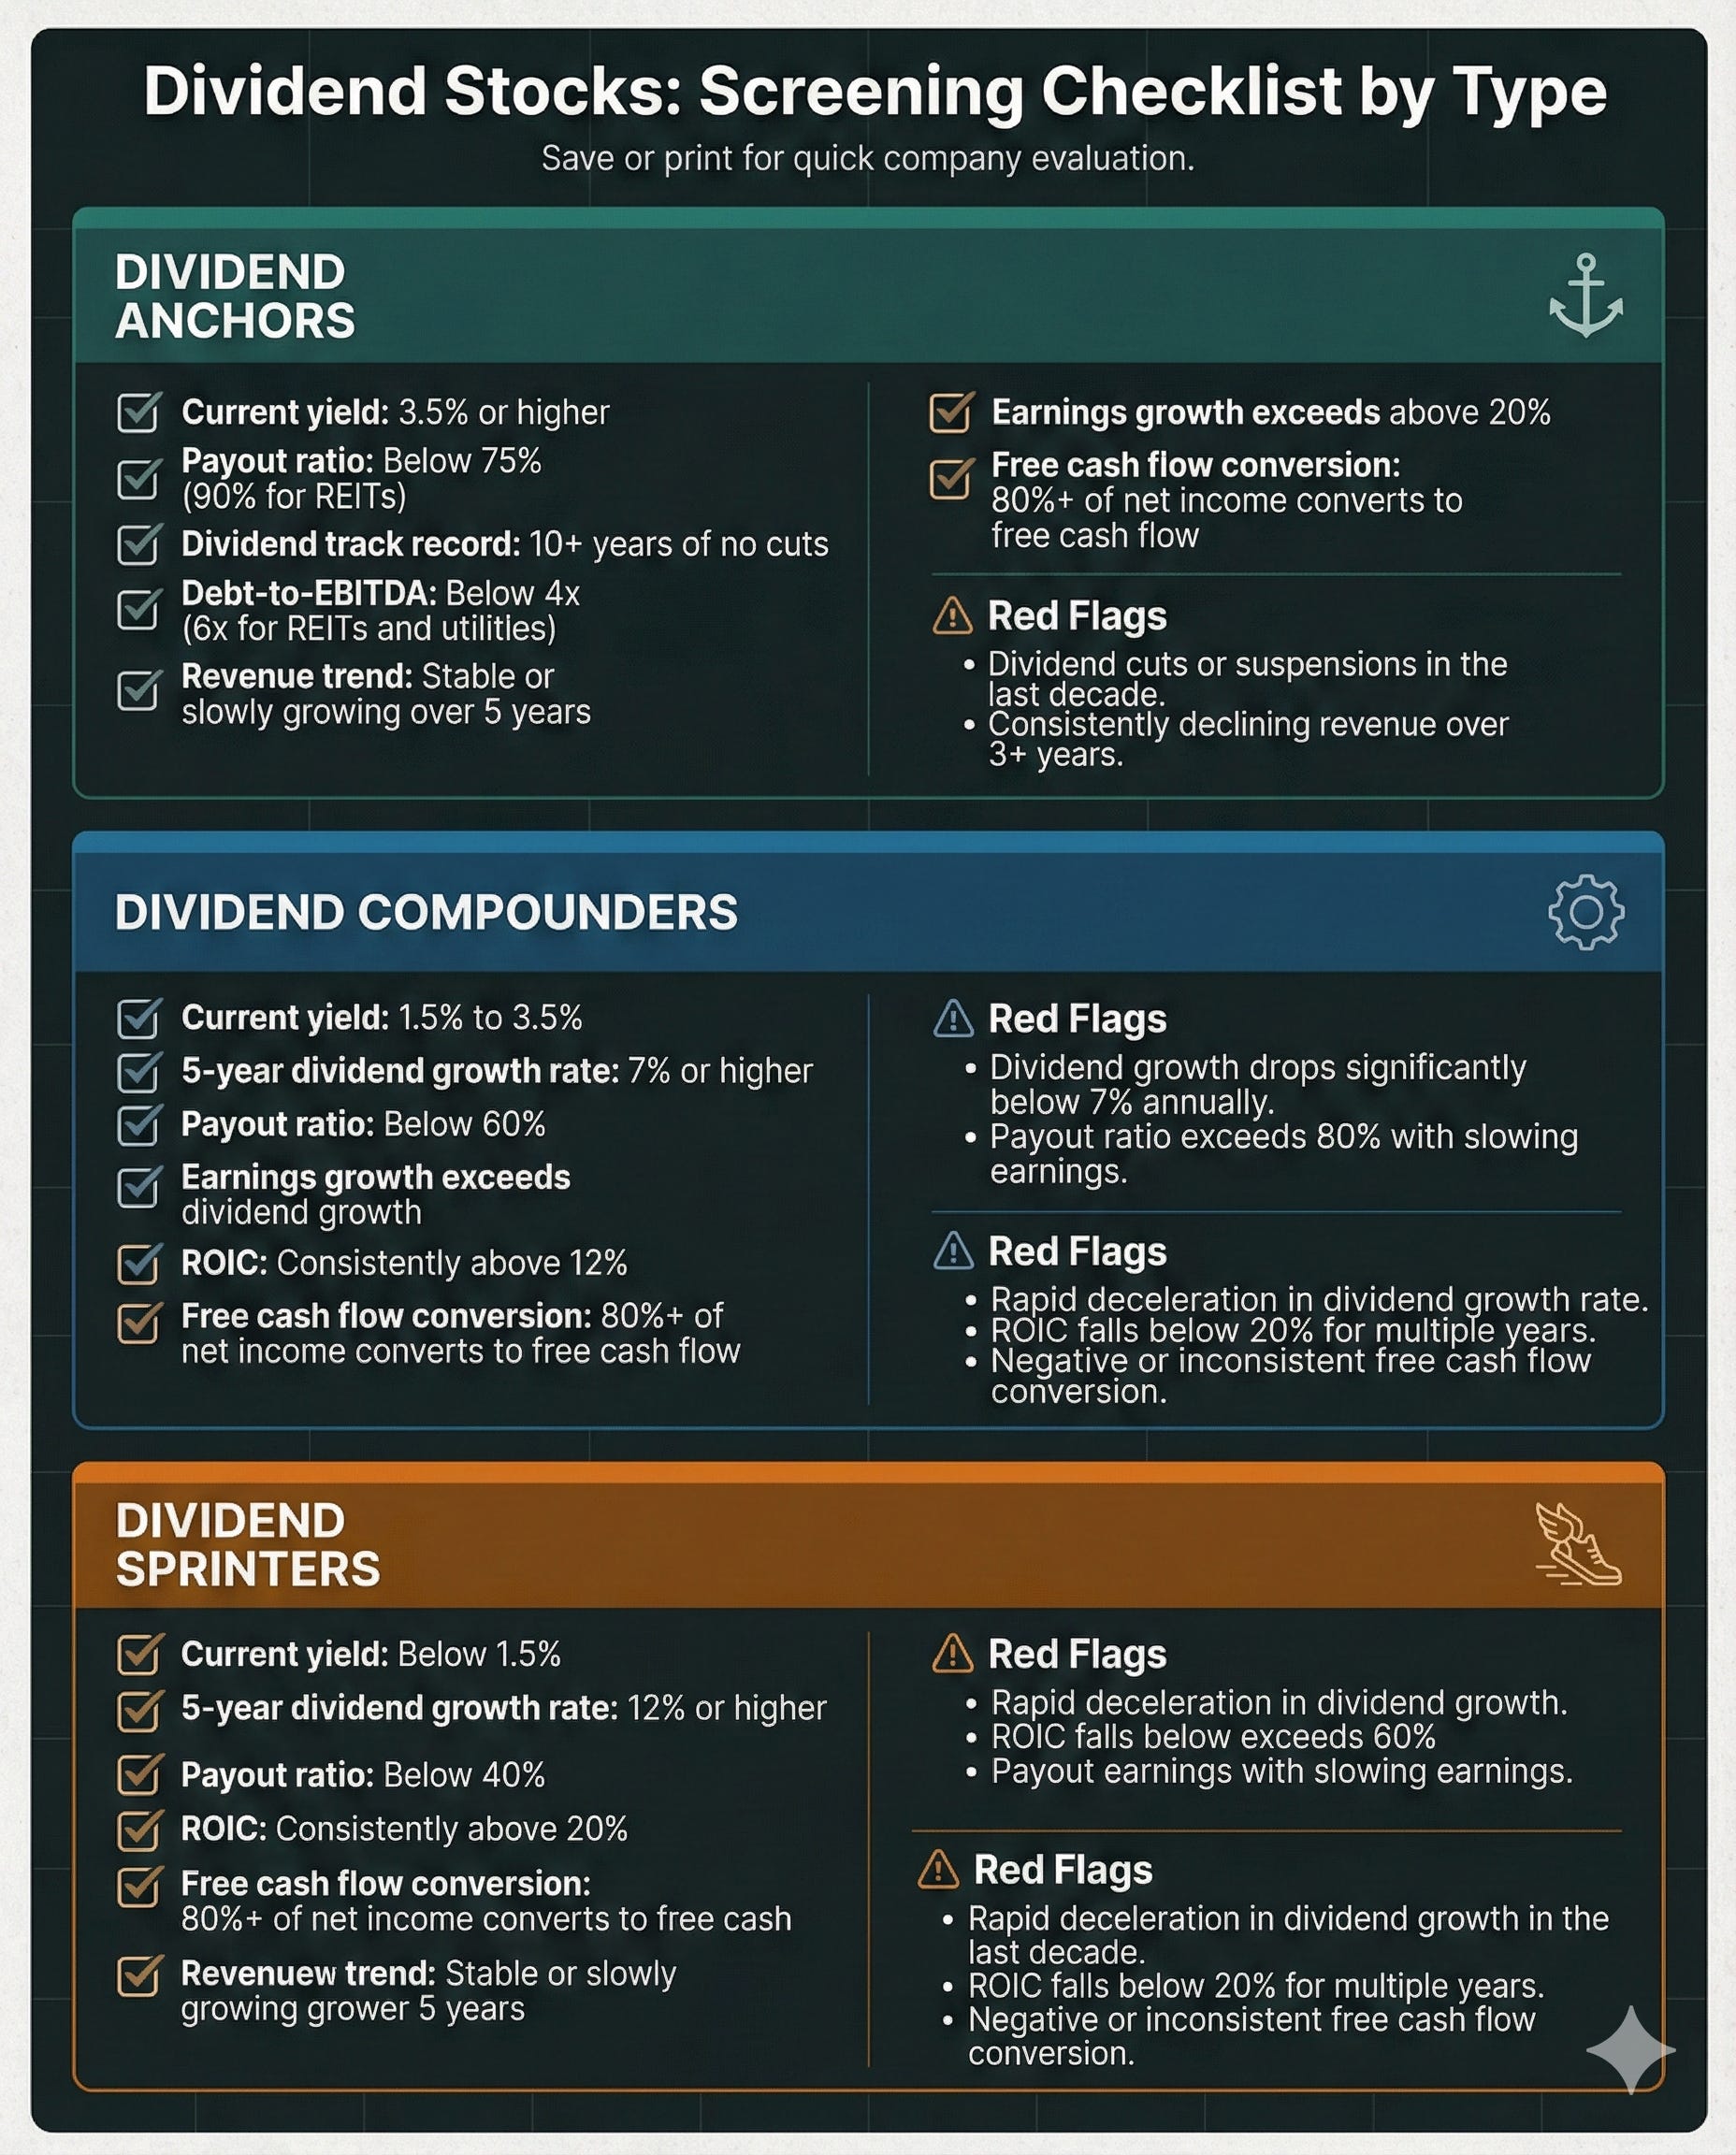
Here’s a practical checklist for evaluating companies in each category:
Dividend Anchors
Current yield: 3.5% or higher
Payout ratio: Below 75% (90% for REITs)
Dividend track record: 10+ years of no cuts
Debt-to-EBITDA: Below 4x (6x for REITs and utilities)
Revenue trend: Stable or slowly growing over 5 years
Dividend Compounders
Current yield: 1.5% to 3.5%
5-year dividend growth rate: 7% or higher
Payout ratio: Below 60%
Earnings growth exceeds dividend growth
ROIC: Consistently above 12%
Dividend Sprinters
Current yield: Below 1.5%
5-year dividend growth rate: 12% or higher
Payout ratio: Below 40%
ROIC: Consistently above 20%
Free cash flow conversion: 80%+ of net income converts to free cash flow
The ROIC threshold is intentionally higher for Sprinters because the entire thesis depends on capital-efficient growth. A company growing dividends at 15% while ROIC deteriorates is borrowing from the future. Eventually, that growth stalls.
Common Mistakes to Avoid
Chasing yield without checking sustainability. A 7% yield is worthless if the company cuts the dividend next quarter. Always verify the payout ratio and free cash flow coverage before buying high-yield stocks. If dividends paid exceed free cash flow, that’s a red flag regardless of what the earnings-based payout ratio says.
Ignoring the total return picture. Dividends are one component of total return. A Sprinter yielding 0.8% but growing earnings at 15% will likely deliver strong price appreciation alongside dividend growth. An Anchor yielding 5% with flat earnings may deliver income but little capital appreciation. Both have value, but understand what you’re buying.
Treating all dividend stocks the same. This is the biggest mistake. Evaluating Visa by the same yield criteria you’d use for a utility company makes no sense. They’re different categories serving different purposes. Use the right framework for the right type.
Forgetting that past dividend growth doesn’t guarantee future growth. A company that grew its dividend at 12% for five years might slow to 6% as its business matures. Always check whether the underlying earnings growth supports the dividend growth rate.
Final Thoughts
The best dividend portfolios aren’t built from a single type. They blend Anchors, Compounders, and Sprinters in proportions that match the investor’s needs. Someone five years from retirement might lean heavily on Anchors and Compounders. A thirty-year-old building wealth might emphasize Compounders and Sprinters with a small Anchor allocation for stability.
What matters most is understanding what you own and why. When you categorize your dividend stocks into these three types, you can evaluate each one against the right benchmarks, set the right expectations, and build a portfolio that works together instead of pulling in different directions.
The framework is simple: yield tells you what you earn today, growth tells you what you’ll earn tomorrow, and ROIC tells you whether the growth is sustainable. Put those three pieces together, and you have a complete picture of any dividend growth stock.
That wraps up our discussion for today.
As always, thank you for taking the time to read this post, and I hope you find something of value on your investing journey.
If I can further assist, please don’t hesitate to reach out.
Until next time, take care and be safe out there,
Dave
Knowing the concepts is one thing. Being able to sit down with a real dividend stock and actually analyze it is another. Paid membership gives you the tools to bridge that gap:
📊 1. Stock Analysis Infographic Library: 180+ visual references covering financial statements, valuation multiples, and dividend metrics, your cheat sheet for analyzing any company
🤖 2. AI Prompt Library: 10 purpose-built prompts that turn AI into a research partner, stress-test your thesis, dig into financials faster, and catch risks you’d otherwise miss
🔧 3. Investing Tools Suite: 4 analytical tools that take the friction out of the numbers so you can focus on understanding the business, not wrestling with spreadsheets
🎓 4. Skill Workshop: Practical working sessions walking through real company analysis start to finish, not theory, not lectures, actual practice
📈 5. Dividend Analysis Course (Coming Soon): A complete step-by-step course on analyzing dividend stocks using Buffett-inspired fundamental analysis
🔓 6. Everything Added Going Forward: Every new resource, tool, and prompts added automatically, no extra charge, ever