

On September 16, the Fed raised rates a quarter point, to between 3.75% and 4.00%. No cut, which the market was hoping for, but a raise.
With the 10-year Treasury closing at about 5.00% that day, and 4.94% the next. We have to ask: how much are we being paid to take risk now? The risk-free rate pays us nearly what a lot of “high-yield” stocks pay. And we don’t need to look at payout ratios, rent coverage, or debt levels to buy the Treasury.
This all makes dividend investing more challenging. When cash paid 1%, a 6% yield only needed safety. Now, that same 6% yield needs safety plus a little more to justify the extra 1% of risk.
This makes it a good month to sort the durable yields from the ones that will become our next case study.
In today’s post, we will discuss:
2 Minutes Safety Check
My top 10 high yield picks for September
Two yields that didn’t pass the check
The full scorecard
Okay, let’s dive in and count them down.
2 Minute Safety Check
High-yield investments come from a wide range of businesses with different accounting rules. Each type of business will have a different flavor of coverage math. Many of them aren't apples-to-apples. We can’t compare pizza to hard-boiled eggs; it's not a fair comparison for the eggs. I mean, yuck…..
Here is the cheat sheet we’ll use across the board:
Common stocks: free cash flow payout ratio (dividends paid ÷ free cash flow). Ideally under 70%
REITs: AFFO payout ratio (dividends ÷ adjusted funds from operations). Under 80% is healthy.
MLPs: distributable cash flow per share dividends per share. Above 1.4 times is good.
Mortgage REITs: net spread income against the dividend, and then tangible book value per share over the past five years.
Why not one ratio to rule them all?
Because, as I mentioned earlier, AFFO and distributable cash flow are similar but wear different hats. They approximate free cash flow for a REIT or MLP. They give us a metric we can use when earnings aren’t a good measure. For example, a REIT’s depreciation distorts paper earnings and misrepresents the REIT’s actual earning power. So we add the depreciation back, and voila AFFO.
Two rules before we start.
When yield looks unusually high, check whether it’s high because the payout grew or because the price collapsed. We need to investigate the second before we consider buying.
With Treasuries sitting near 5%, yield alone isn’t the test anymore. We need to look at total expected return, which is the starting yield plus the dividend growth rate, and compare that against the risk-free rate or Treasury.
Now, let’s get to the list.
#10 Verizon (VZ), 5.5% yield
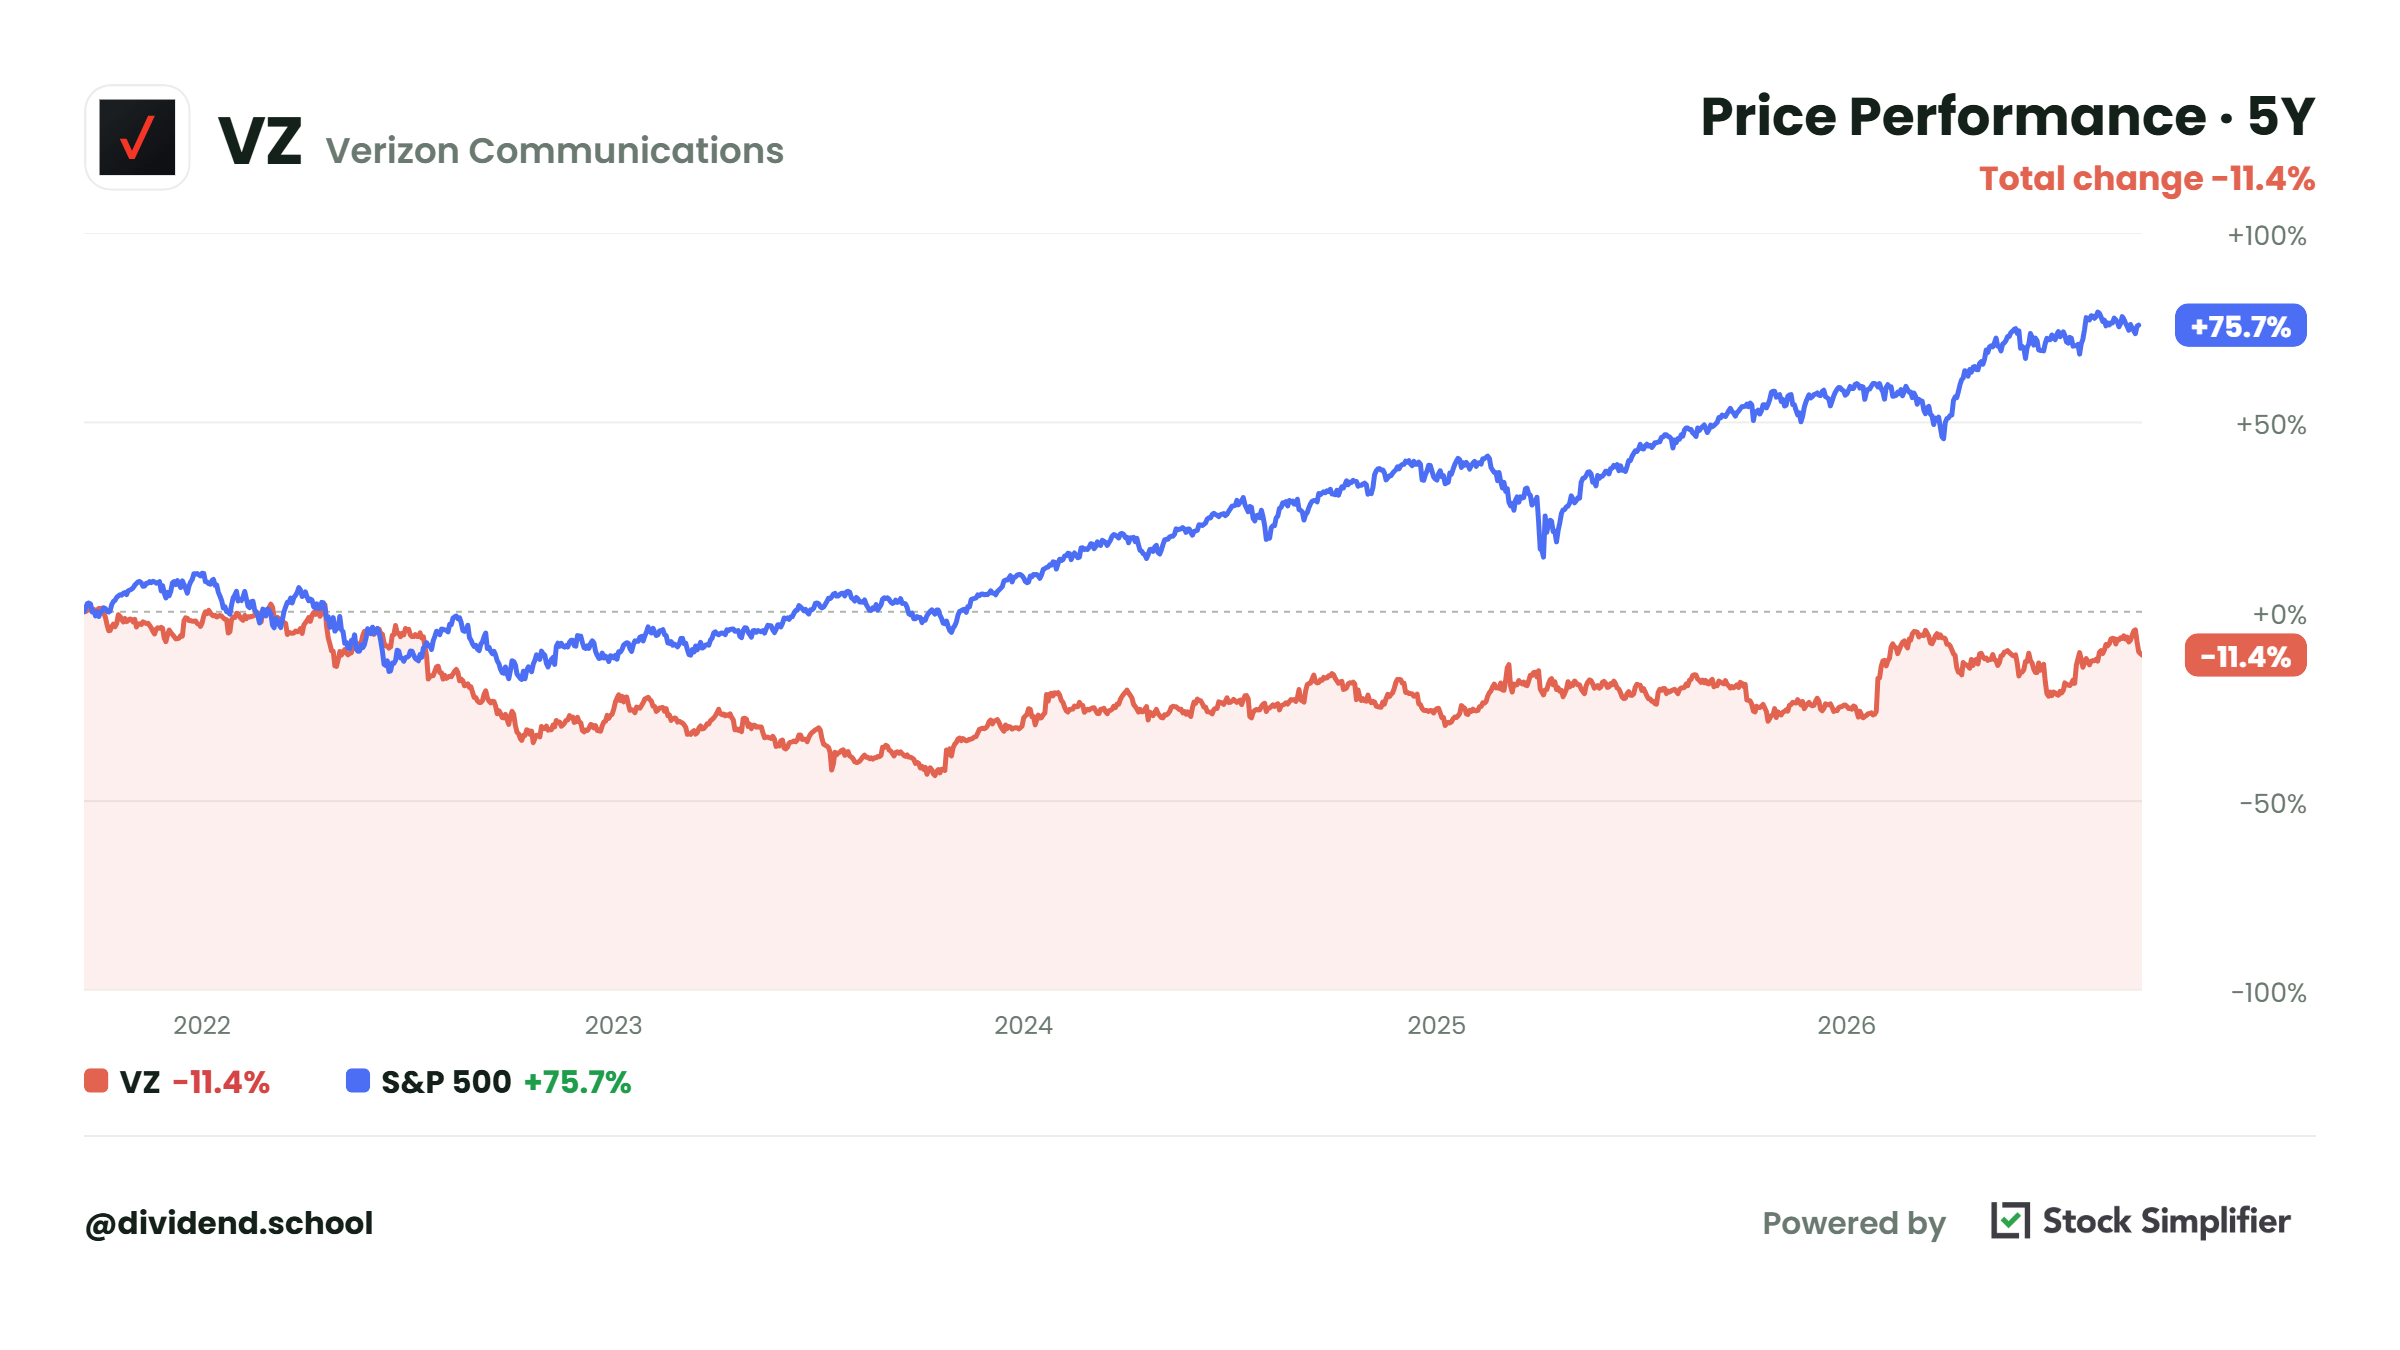
The company’s yield has dipped a little lately because its price has rebounded.
Taking a look at the free cash flow payout ratio, here are some numbers for the first half of 2026:
Operating cash flow: $18,419 million
Capital expenditures: $8,210 million
Free cash flow: $10,209 million
Dividends paid: $5,864 million
FCF payout ratio: 57.4%
So Verizon’s current 5.5% yield is covered 1.74 times by cash, and the company posted a 40.1% adjusted EBITDA margin; it’s higher every. Management raised second-quarter guidance to adjusted earnings of $4.99 to $5.04. Plus, free cash flow growth of 9% to 10%. The company has grown its dividend for 20-plus years.
Bottom line, the dividend is safe.
So why is this #10?
Because the stock price rallied and dropped the yield to 5.5%, which is only half a point above the risk-free rate, along with a slow dividend growth rate of 2.5%. Remember the earlier test: yield plus dividend growth? Well, Verizon adds up to 8%, against 4.94% from a safe investment.
That spread is real; why pay for the added risk for a 2.5% dividend growth rate?
Better opportunities exist.
The lesson: measure yield plus growth against the 10-year Treasury. This is why we don’t rank by yield. Verizon has rock-solid coverage and financials of almost any dividend payer, but the growth rate leaves a lot on the table. Why pay for added risk?
Trap or not: Not a trap per se, but depending on your portfolio needs, this is a poor man’s bond substitute with a higher yield. The big drag: slow dividend growth. The dividend will be paid; safety is rock solid here, but there are way better options in the market.
#9 Omega Healthcare Investors (OHI), 5.8% yield
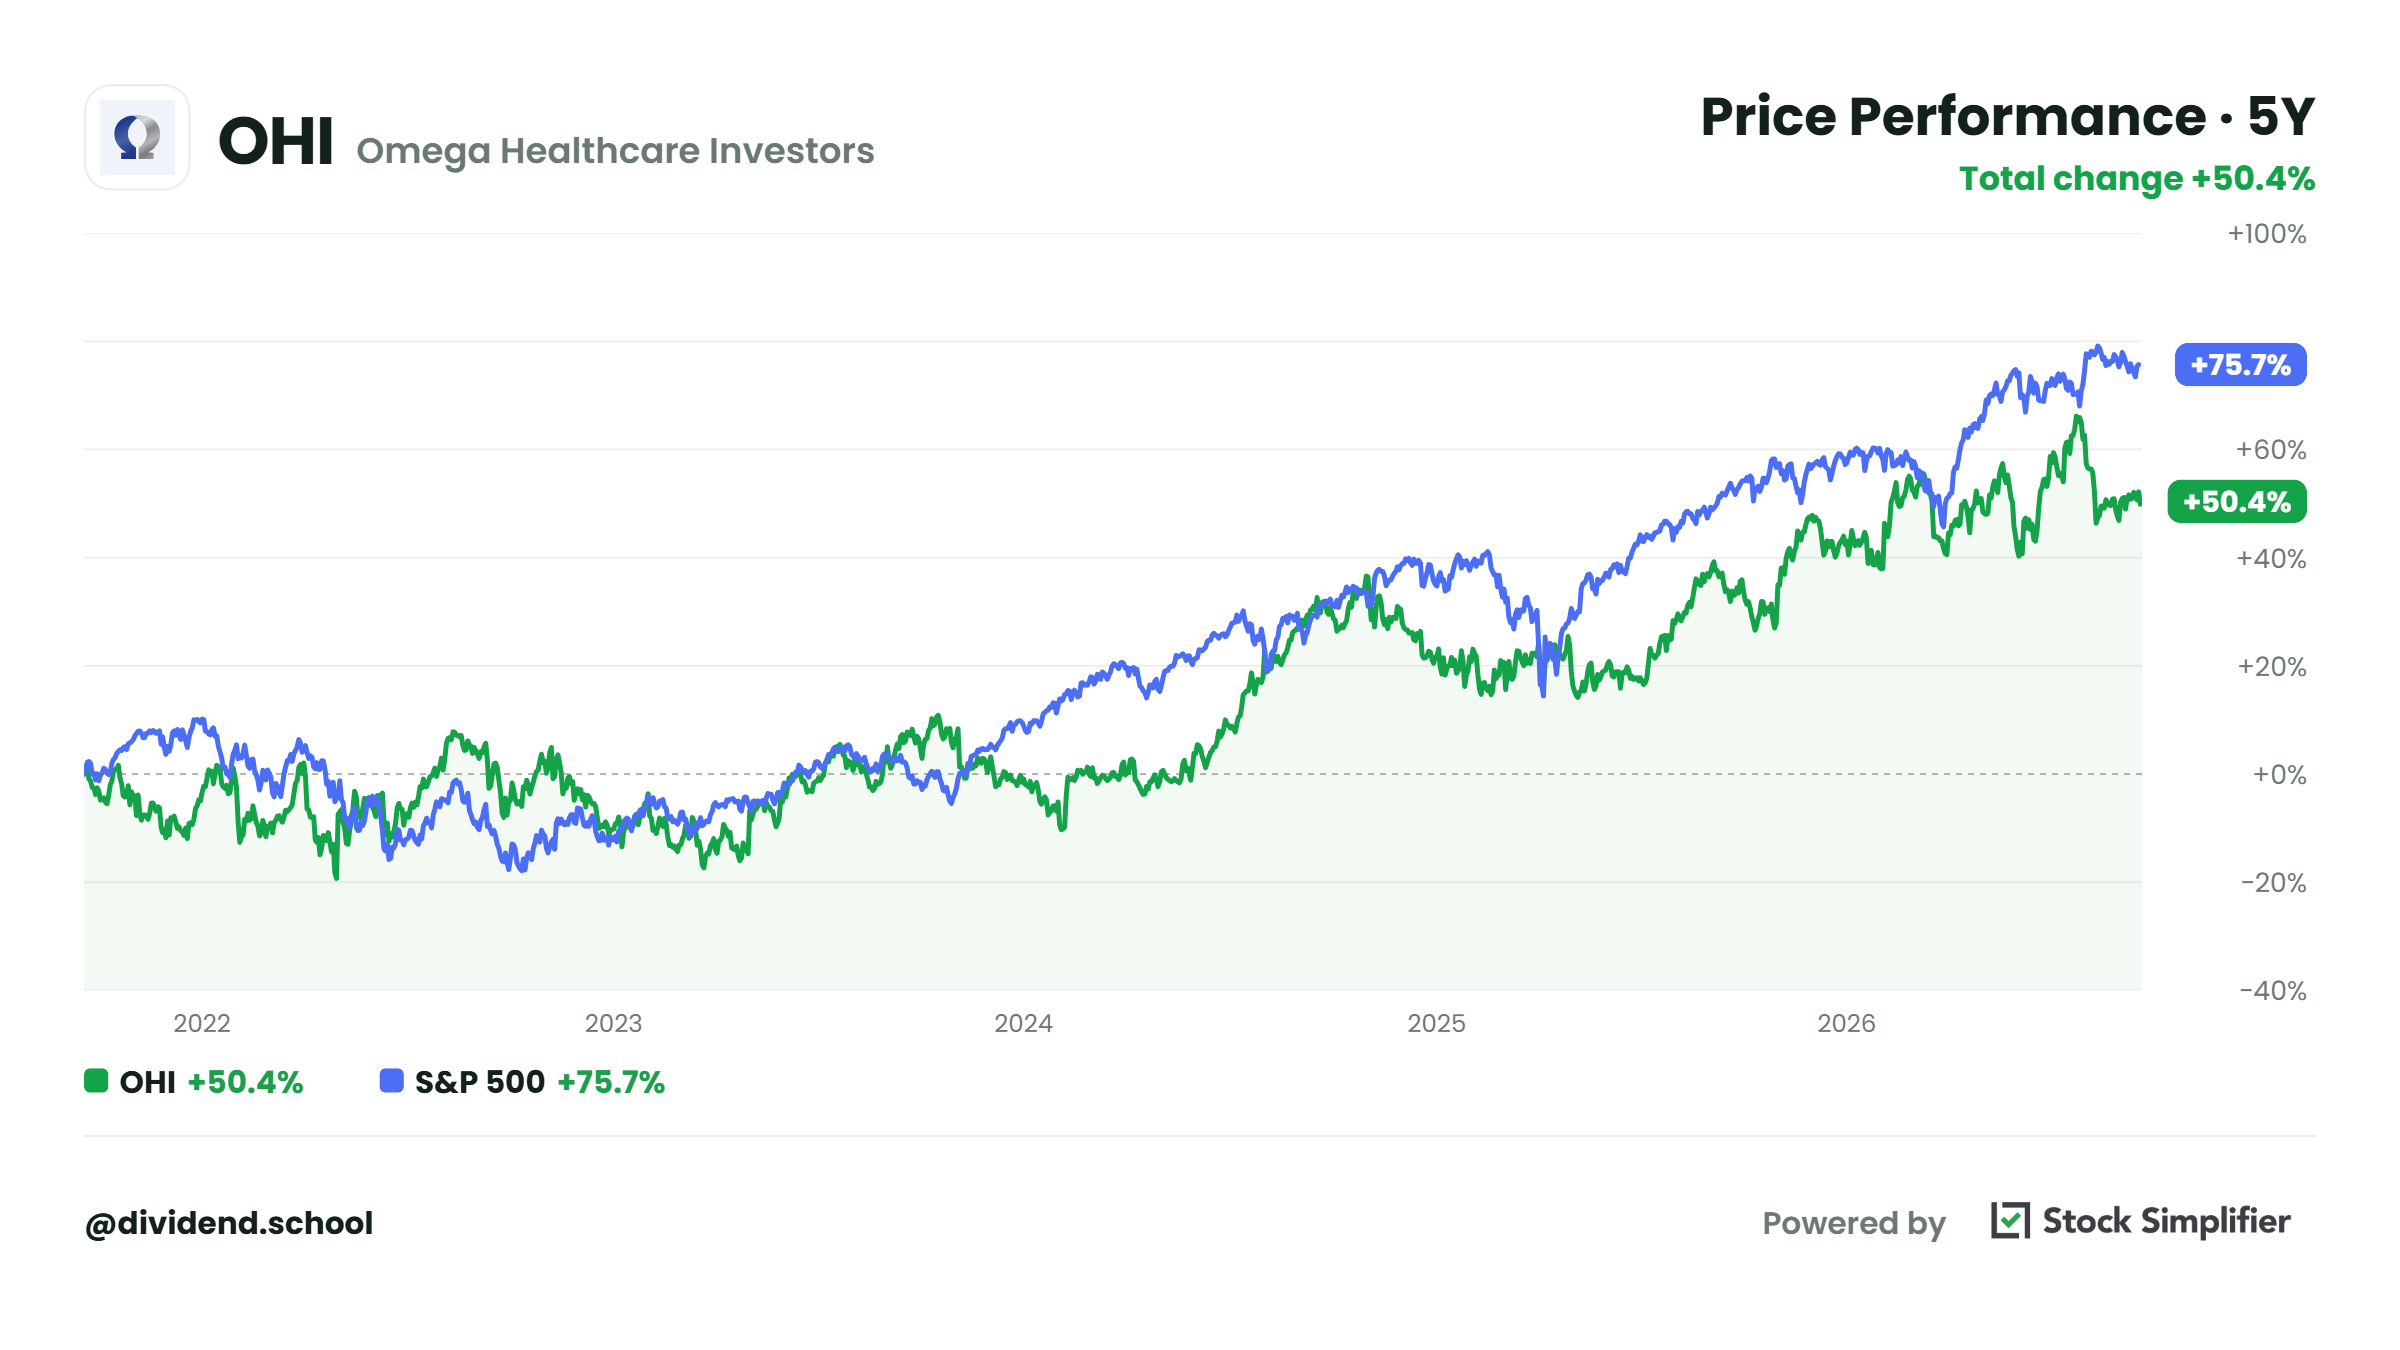
Omega’s business model revolves around leasing out skilled nursing homes and senior housing to operators. Omega paid $0.67 a quarter for twenty-seven straight years, and then in July, raised it to $0.68. The company stated “prior to the pandemic, we enjoyed seventeen straight years of dividend growth.”
So, almost seven years of zero dividend growth, and then voila! a whole penny. Big deal.
Some financials to measure the safety:
AFFO: $0.83 a share
FAD (funds available for distribution): $0.78 a share
AFFO payout on the new dividend: 82.3%
FAD payout: 86.9%
Full-year AFFO guidance: raised to $3.22 to $3.26
Forward payout on the guidance midpoint: 84.0%
For those curious, FAD is AFFO with additional non-cash items stripped out. It’s a tighter version of AFFO. Notice the FAD payout is narrower than AFFO’s, which is okay because Omega’s balance sheet is conservatively leveraged at 3.3x net debt to EBITDA.
But Omega’s payout ratio only tells half the story. Who pays the rent here, and can they afford it?
Operator rent coverage: 1.65 times EBITDAR across the portfolio
Operators below 1.0 times coverage: 17 of them, 5.1% of rent, all current
Largest operator: Saber, 11.4% of net operating income
Genesis Healthcare: in Chapter 11 since July 2025, 4.6% of net operating income, and it has paid all of the contractual rent through July 2026.
Verdict: dividend safe. With an 82% payout backed by operators covering their rent 1.65 times, all is good.
The lesson: with any landlord, run the payout ratio as always, then run the tenant’s coverage. Use these two checks to ensure dividend safety. A REIT’s cushion is only as good as the rent checks coming in.
Trap or not: Not a trap, as the dividend safety is quite strong. The dividend growth leaves a lot to be desired, though. Plus, the healthcare space, while necessary, especially the properties they own, is volatile. No dividend growth here is the killer.
#8 Enbridge (ENB), 5.8% yield
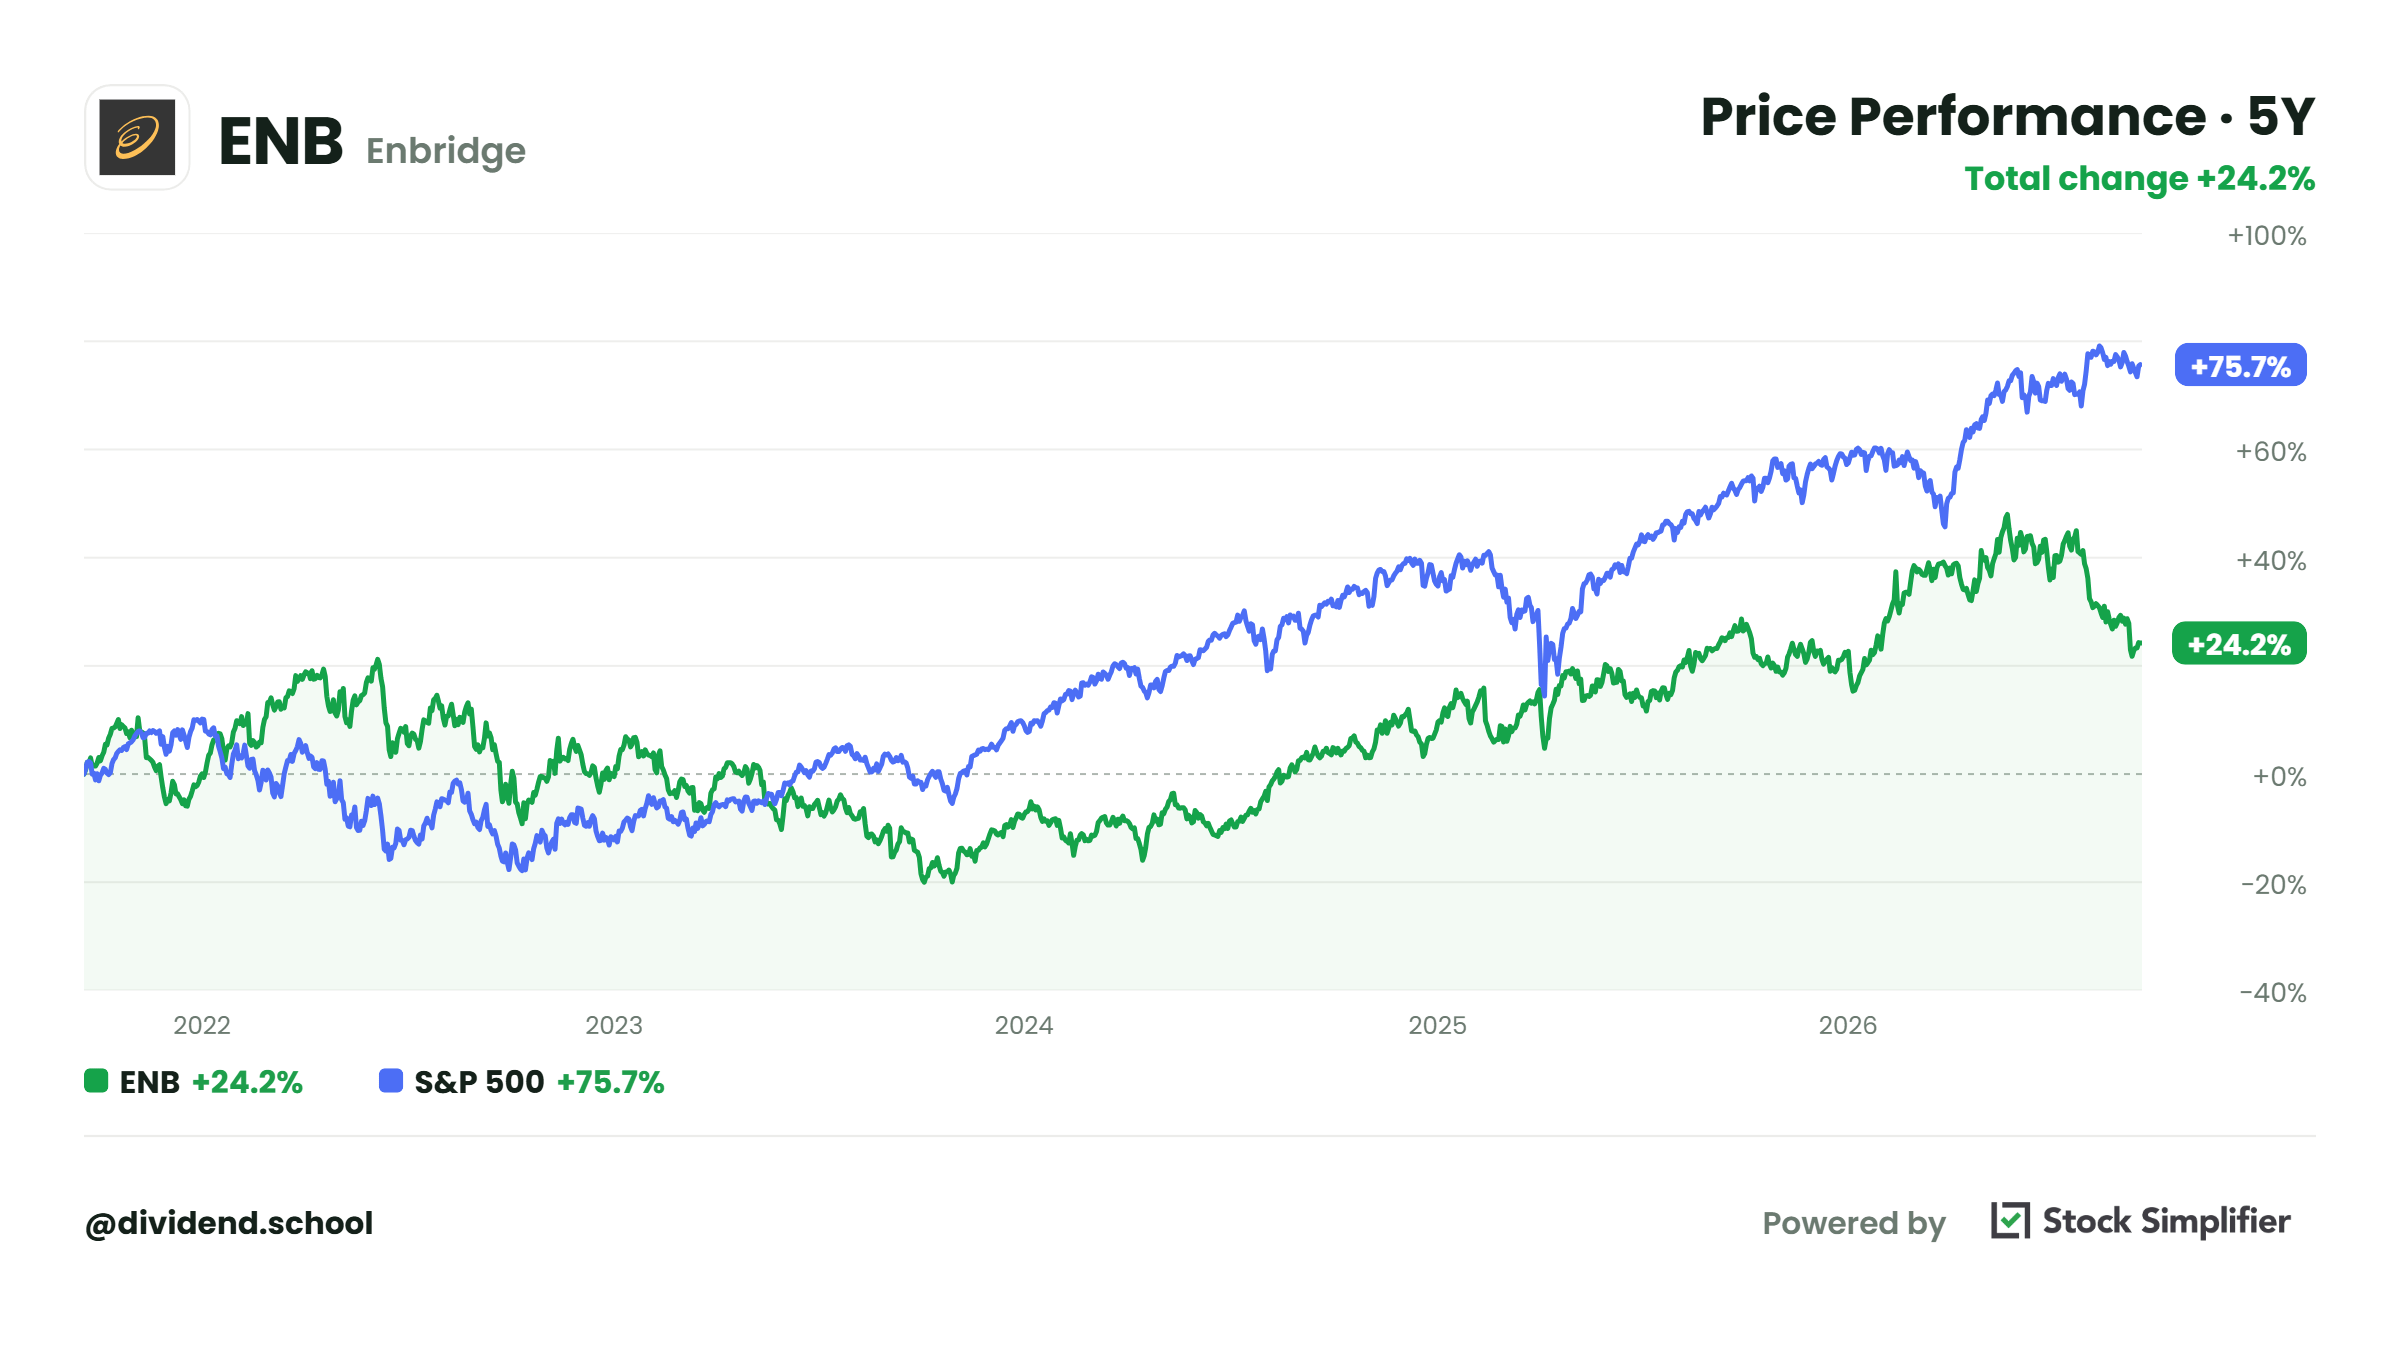
Enbridge, an MLP pipeline network, has paid a growing annual dividend for 31 consecutive years. They operate pipelines stretching from Alberta to the Gulf Coast.
On September 14, Enbridge closed on a C$3.0 billion stock sale of more than 45 million shares. This equaled 2% of the company. They did this to help pay for two acquisitions, which also diluted shareholders by the above 2%. Does this dilute our dividends?
Let’s run the second numbers to get an answer:
Distributable cash flow: C$2,948 million
Weighted average shares: 2,184 million
DCF per share: C$1.35
Dividend: C$0.97
Payout: 71.9% or 1.39 times covered
The 1.39x sits a smidge below our 1.4x we like for pipelines. If we run the six months for a better view, we see C$3.11 of DCF per share against C$1.94 of dividends, for a 62.3% payout or 1.60x coverage.
While the second quarter looks tight, the half-year is all good.
Verdict: the dividend is safe even with the dilution from the acquisitions
The lesson: always run coverage per share. A company can fund its growth by issuing stock, report record cash flow, and still give us a smaller slice of the pie.
Trap or not: Not a trap; the dividend is quite safe. There are a few warts here. First, leverage is 5.1x net debt to EBITDA, which is higher than Enbridge’s own 4.5 to 5.0 target. And they are buying more debt. They are also facing legislative issues with Line 5 in Michigan and a spill on the same line in Wisconsin. Another consideration: the dividend is paid in Canadian dollars, with 15% withheld in a taxable account. You need to hold this in the right retirement account (IRA), and account for the K-1 you will receive.
#7 W.P. Carey (WPC), 5.5% yield
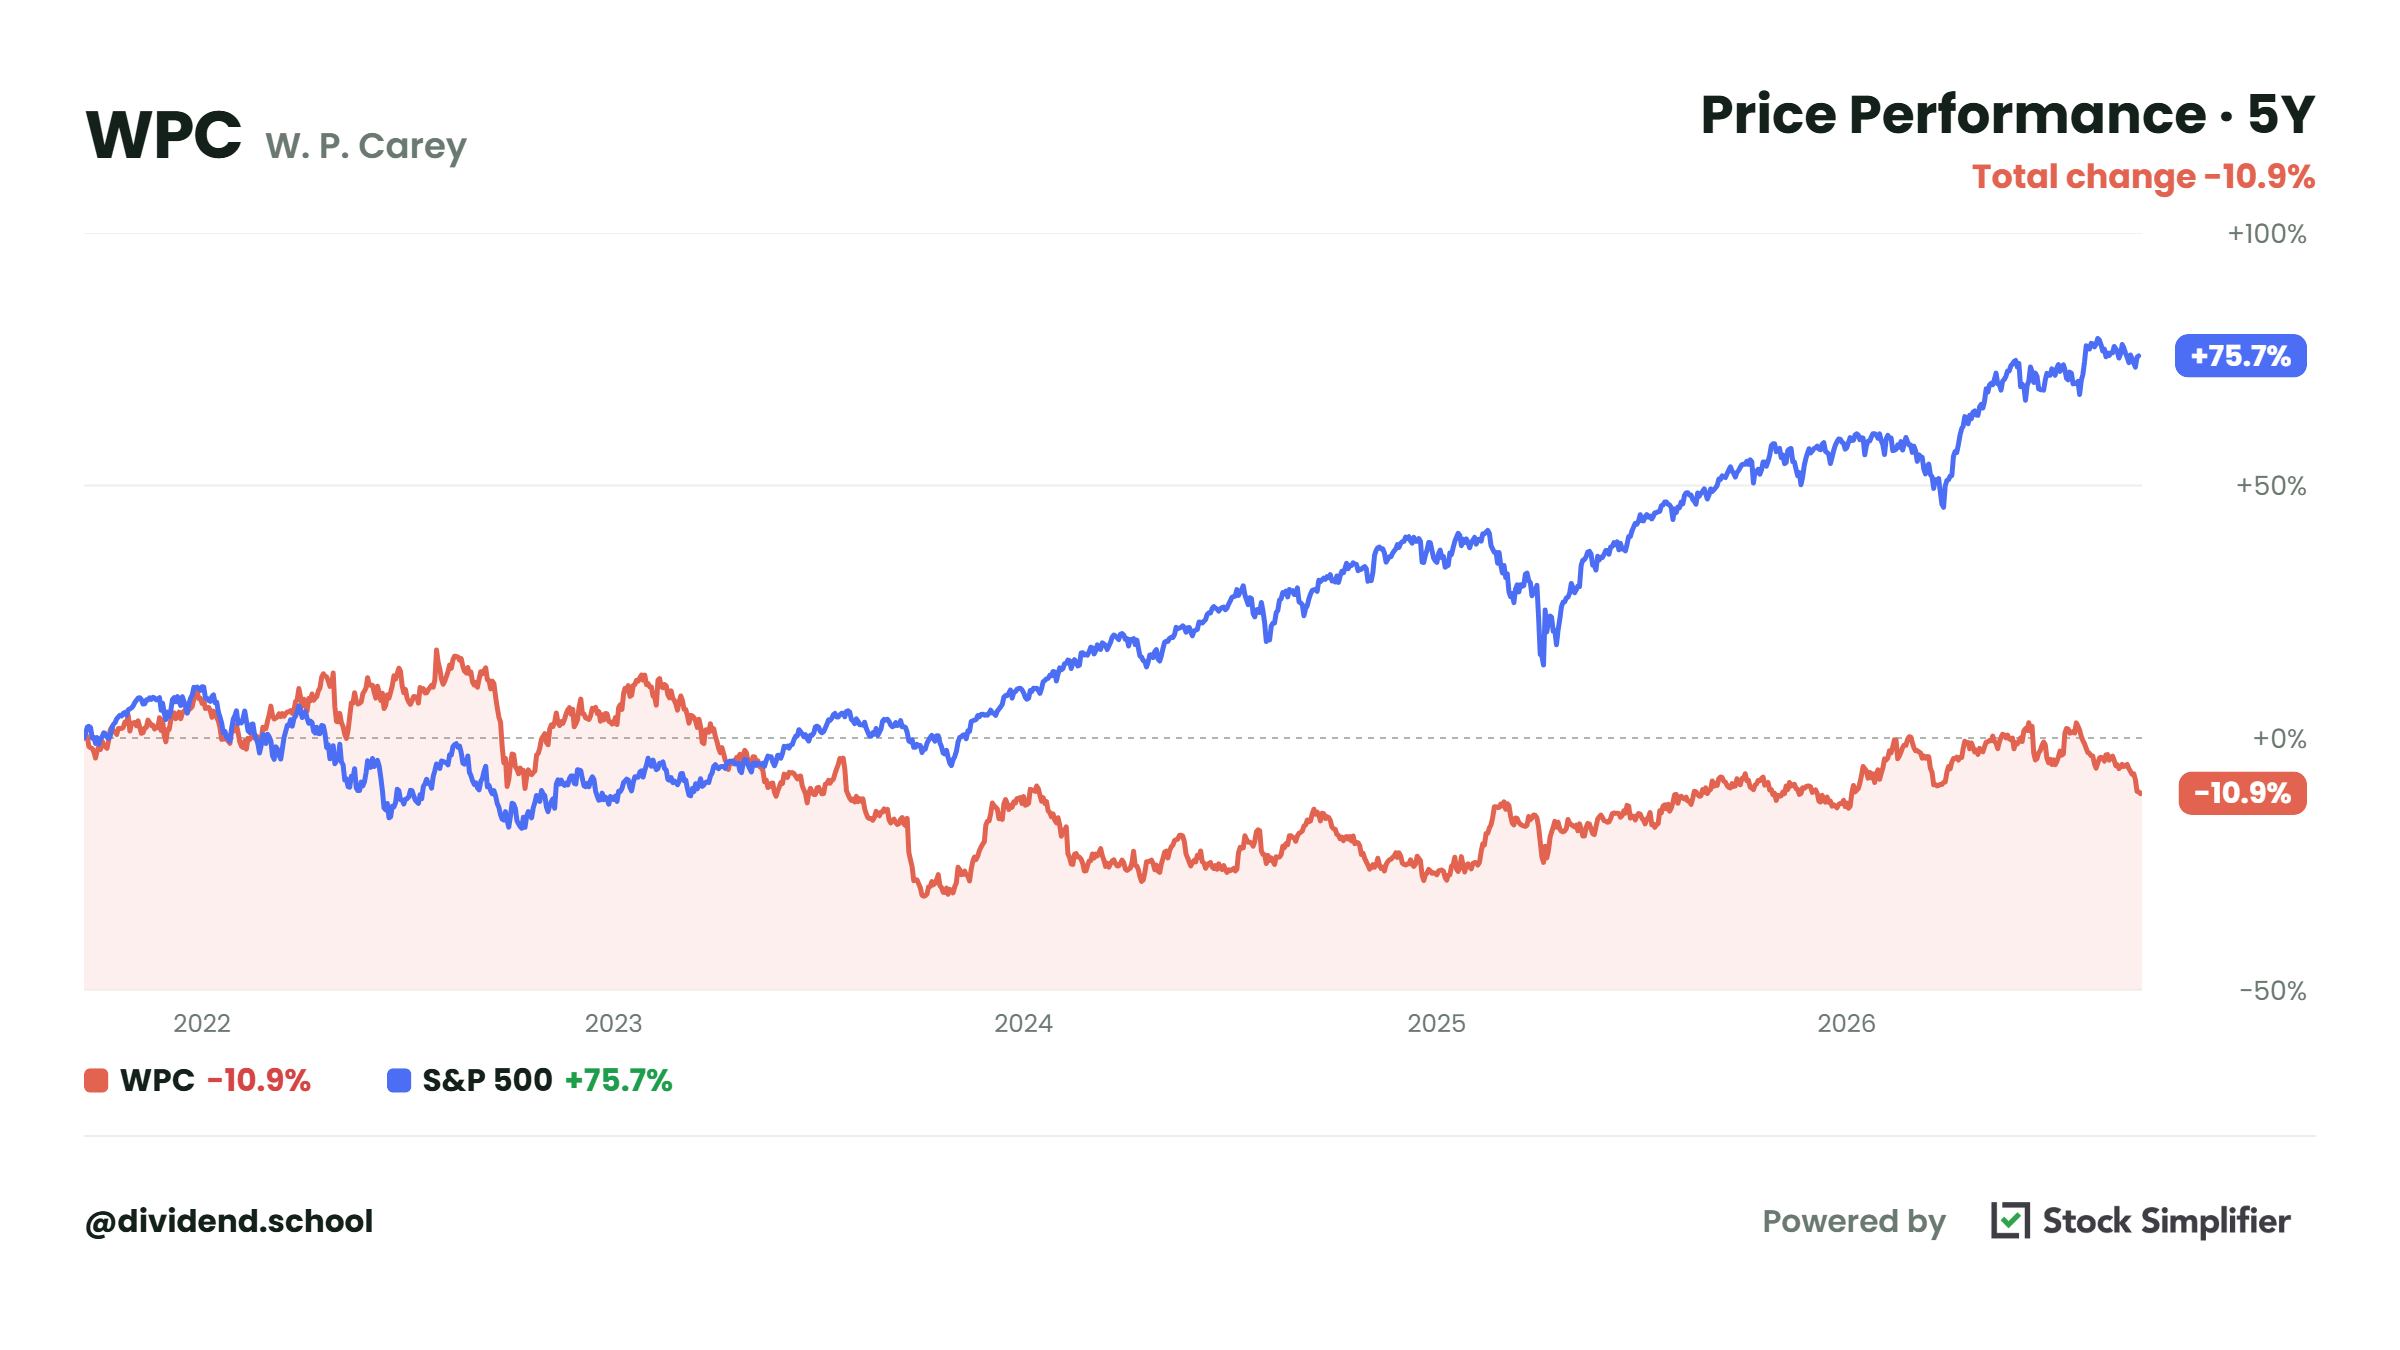
In December 2023, W.P. Carey cut it’s dividend 19%, from $1.071 a quarter to $0.86. This happened right after spinning its office building into a seperate company. Many dividend investors left and haven’t come back.
But what has it done since:
3Q 2025: $0.910
4Q 2025: $0.920
1Q 2026: $0.930
2Q 2026: $0.940
They have grown the dividend by a penny every quarter, like clockwork; not great. Ten raises in a row, which looks great on paper, but digging into it gives off GE earnings-beat vibes: a penny quarter after quarter. WPC’s annual rate is $3.76, which is up 4.4% from a year ago, which is better than Verizon, Omega, or Enbridge. But that’s not a high hurdle to step over, is it?
How’s the coverage?
AFFO: $1.34 a share
Dividend: $0.940
AFFO payout: 70.1%
Full-year AFFO guidance: raised to $5.19 to $5.27
Forward payout: 71.9%
How is the business performing? Occupancy is 98.5% across a portfolio with an average lease term of 12.2 years remaining, and 47.8% of rent is tied to inflation. So WPC is offering rent that goes up on its own.
The lesson: Sometimes a dividend cut is information, not a verdict. We need to ask: What did the dividend cut reset? Often, a company resetting itself and growing from a different base is better than the prior one.
Trap or not: On paper, this looks like a great dividend payer, with a great AFFO payout ratio and ten raises in a row. But if you dig into the actual numbers, you can see the raises are paper raises and not much to write home about. And the dividend safety is a bonus. But to me, this is a trap at the moment. It needs more time to move away from the spinoff and to reset itself.
#6 Altria (MO), 6.4% yield
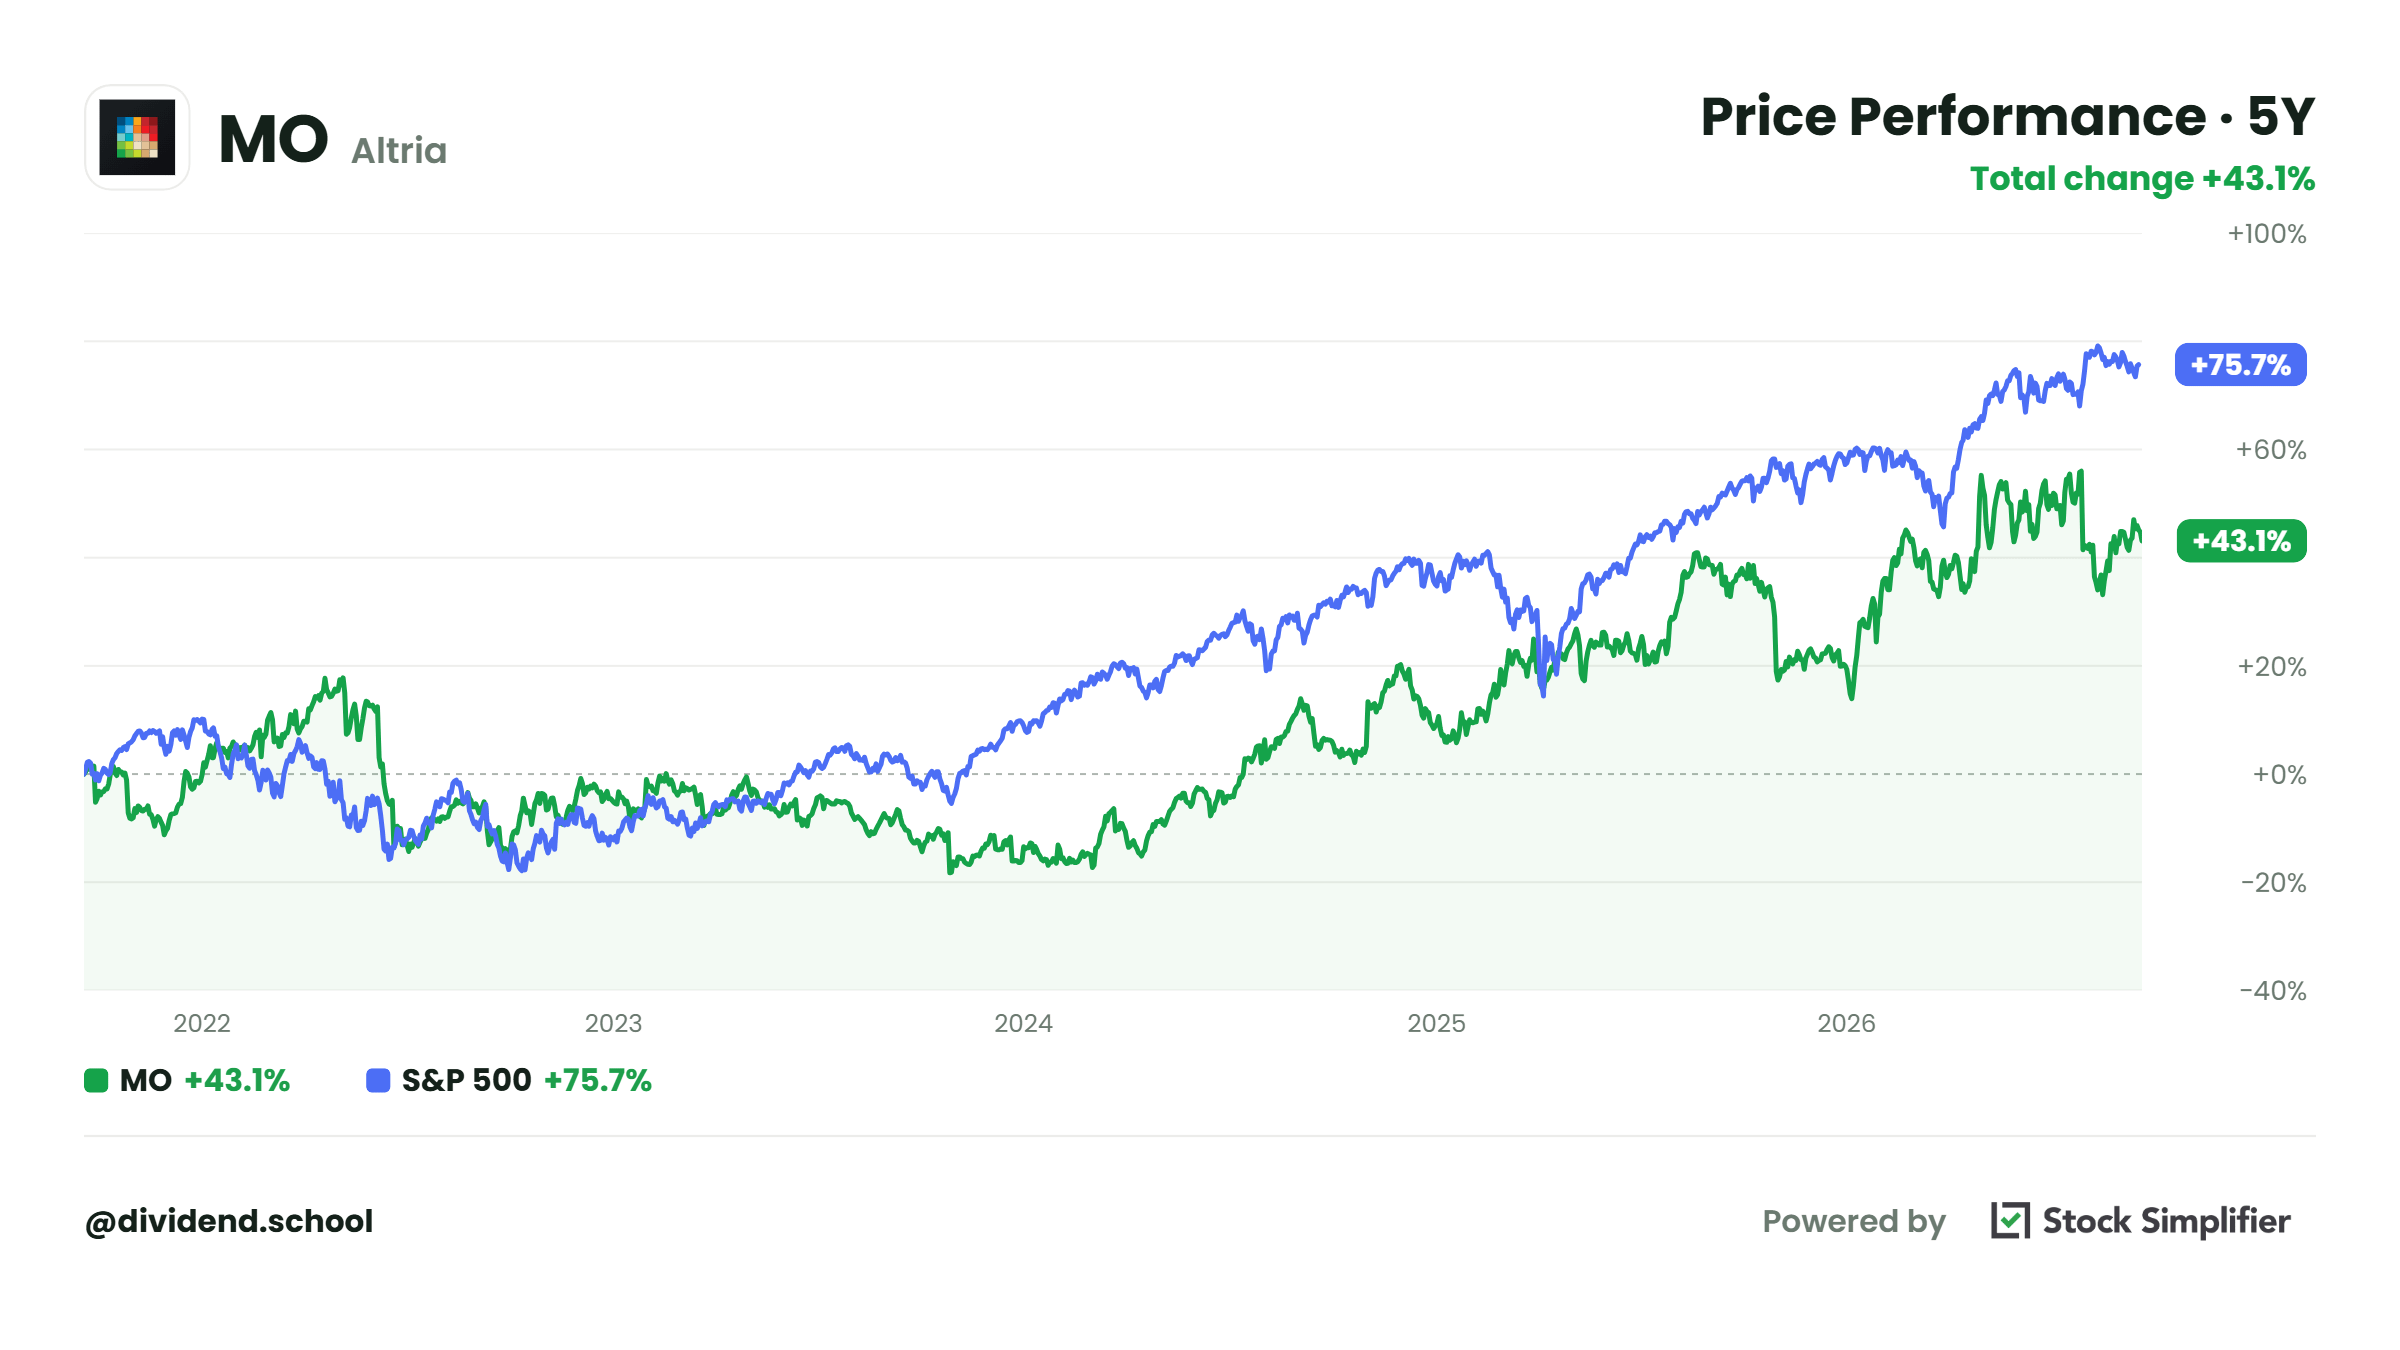
Altria has been on the struggle bus for years as smoking loses its hold here in the US, and it keeps paying a growing dividend anyway. The board raised it 4.7% on August 27, to $1.11 a quarter. That’s the 61st increase in 57 years.
The first half of the year makes the dividend look dangerous, because Altria paid out more than its first-half free cash flow. That’s seasonal, and it happens most years, so the honest look is the full year:
2023: 74.6%
2024: 79.5%
2025: 76.7%
Three years in the seventies, and the dividend grew every year. Pricing power is what powers this. Cigarette shipments fell 3.2% last quarter and adjusted earnings per share still grew 2.8%, to $1.48. Full-year guidance is $5.61 to $5.72 a share.
A payout ratio in the seventies is only as safe as the cash flow underneath it. Altria’s cash flow grows because it raises prices faster than volumes fall. What happens the day that stops being true? The payout climbs to 100% or more while the dividend continues. But as we know, that is not sustainable.
The lesson: the free cash flow payout ratio is a snapshot, but digging deeper into what drives it for Altria pricing power. That works until it doesn’t. Always understand the business and what drives any growth. It won’t always be pricing power.
Trap or Not: we’re betting the decline stays slow and orderly. The on! brand is growing fast, but not fast enough to cover the gap in slowdown in the core business. The on! pouch brand lost 1.7 points of share of the nicotine pouch category last quarter, down to 14.4%. At the new dividend and the higher capital spending plan, the payout ratio moves toward 83% next year. Watch the shipments every quarter. For me this is a hard pass, I am not a fan of smoking.
#5: Hercules Capital (HTGC), 10.7% yield
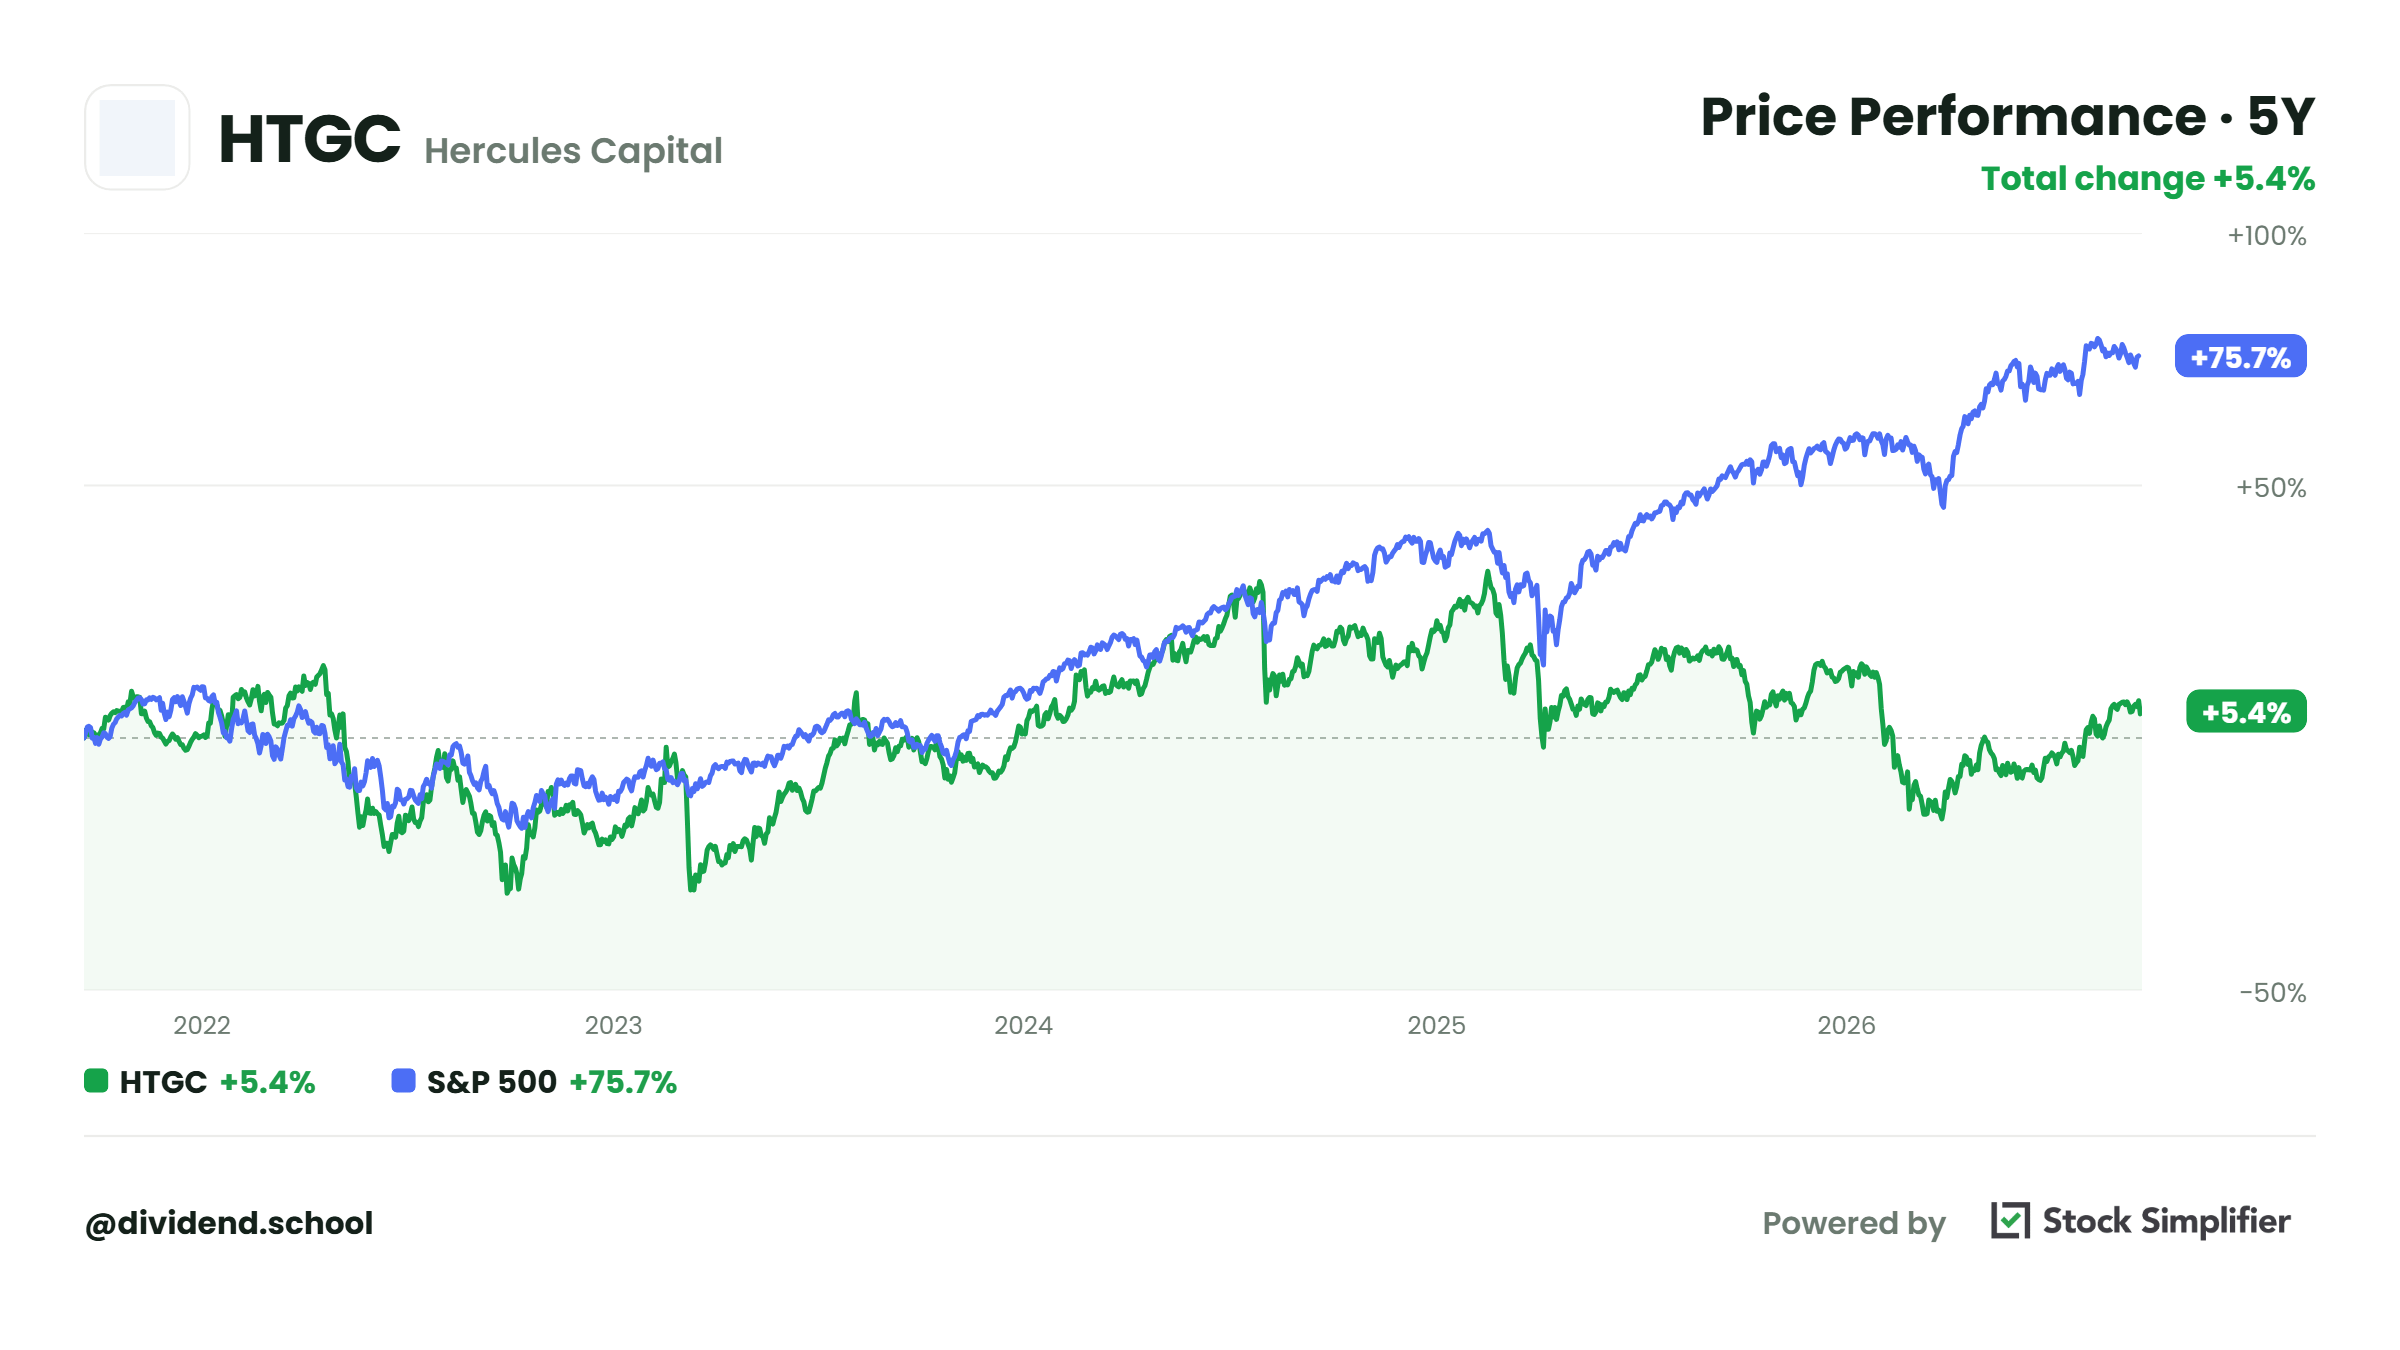
Hercules lends to venture-backed technology and life science companies, which sounds terrifying until we read the loan book.
What’s the first number on a BDC? Not the yield. It’s the non-accrual rate, the slice of loans that have stopped paying:
Non-accruals: under 0.5% of the portfolio at cost, 0.1% at fair value
Net investment income: $0.50 a share
Base dividend: $0.40, covered 1.25 times ($0.50 ÷ $0.40)
Supplemental dividend: $0.07
NAV per share: $12.15
The payout structure is doing something clever here, and it’s worth copying as a way to read any BDC.
Hercules pays a $0.40 base plus a $0.07 supplemental. The base is the stable part. The supplemental is the variable part. If falling rates squeeze lending income, the supplemental flexes first and the base stays protected, which is why I'd underwrite the base-only yield of 9.07% and the screens show the 10.66% total. An easy way to visualize it: the base yield is the foundation we should expect. The supplement difference is a bonus if it delivers.
The lesson: with a BDC, read the non-accrual line before the yield, then find out which part of the payout can flex. A dividend with a built-in shock absorber behaves differently in a bad year.
Trap or not: everybody knows this is a quality lender, so the stock trades at 1.45 times NAV ($17.64 ÷ $12.15). We’re paying 45% over the value of the loan book, and premiums like that compress in bad markets even when the loans keep paying.
Our September 5 issue graded eight BDCs on five checks each, and this one scored 5 out of 5.
BDC’s are still on my too-hard pile, but I am studying this company and others to get a better understanding.
#4: NNN REIT (NNN), 5.7% yield
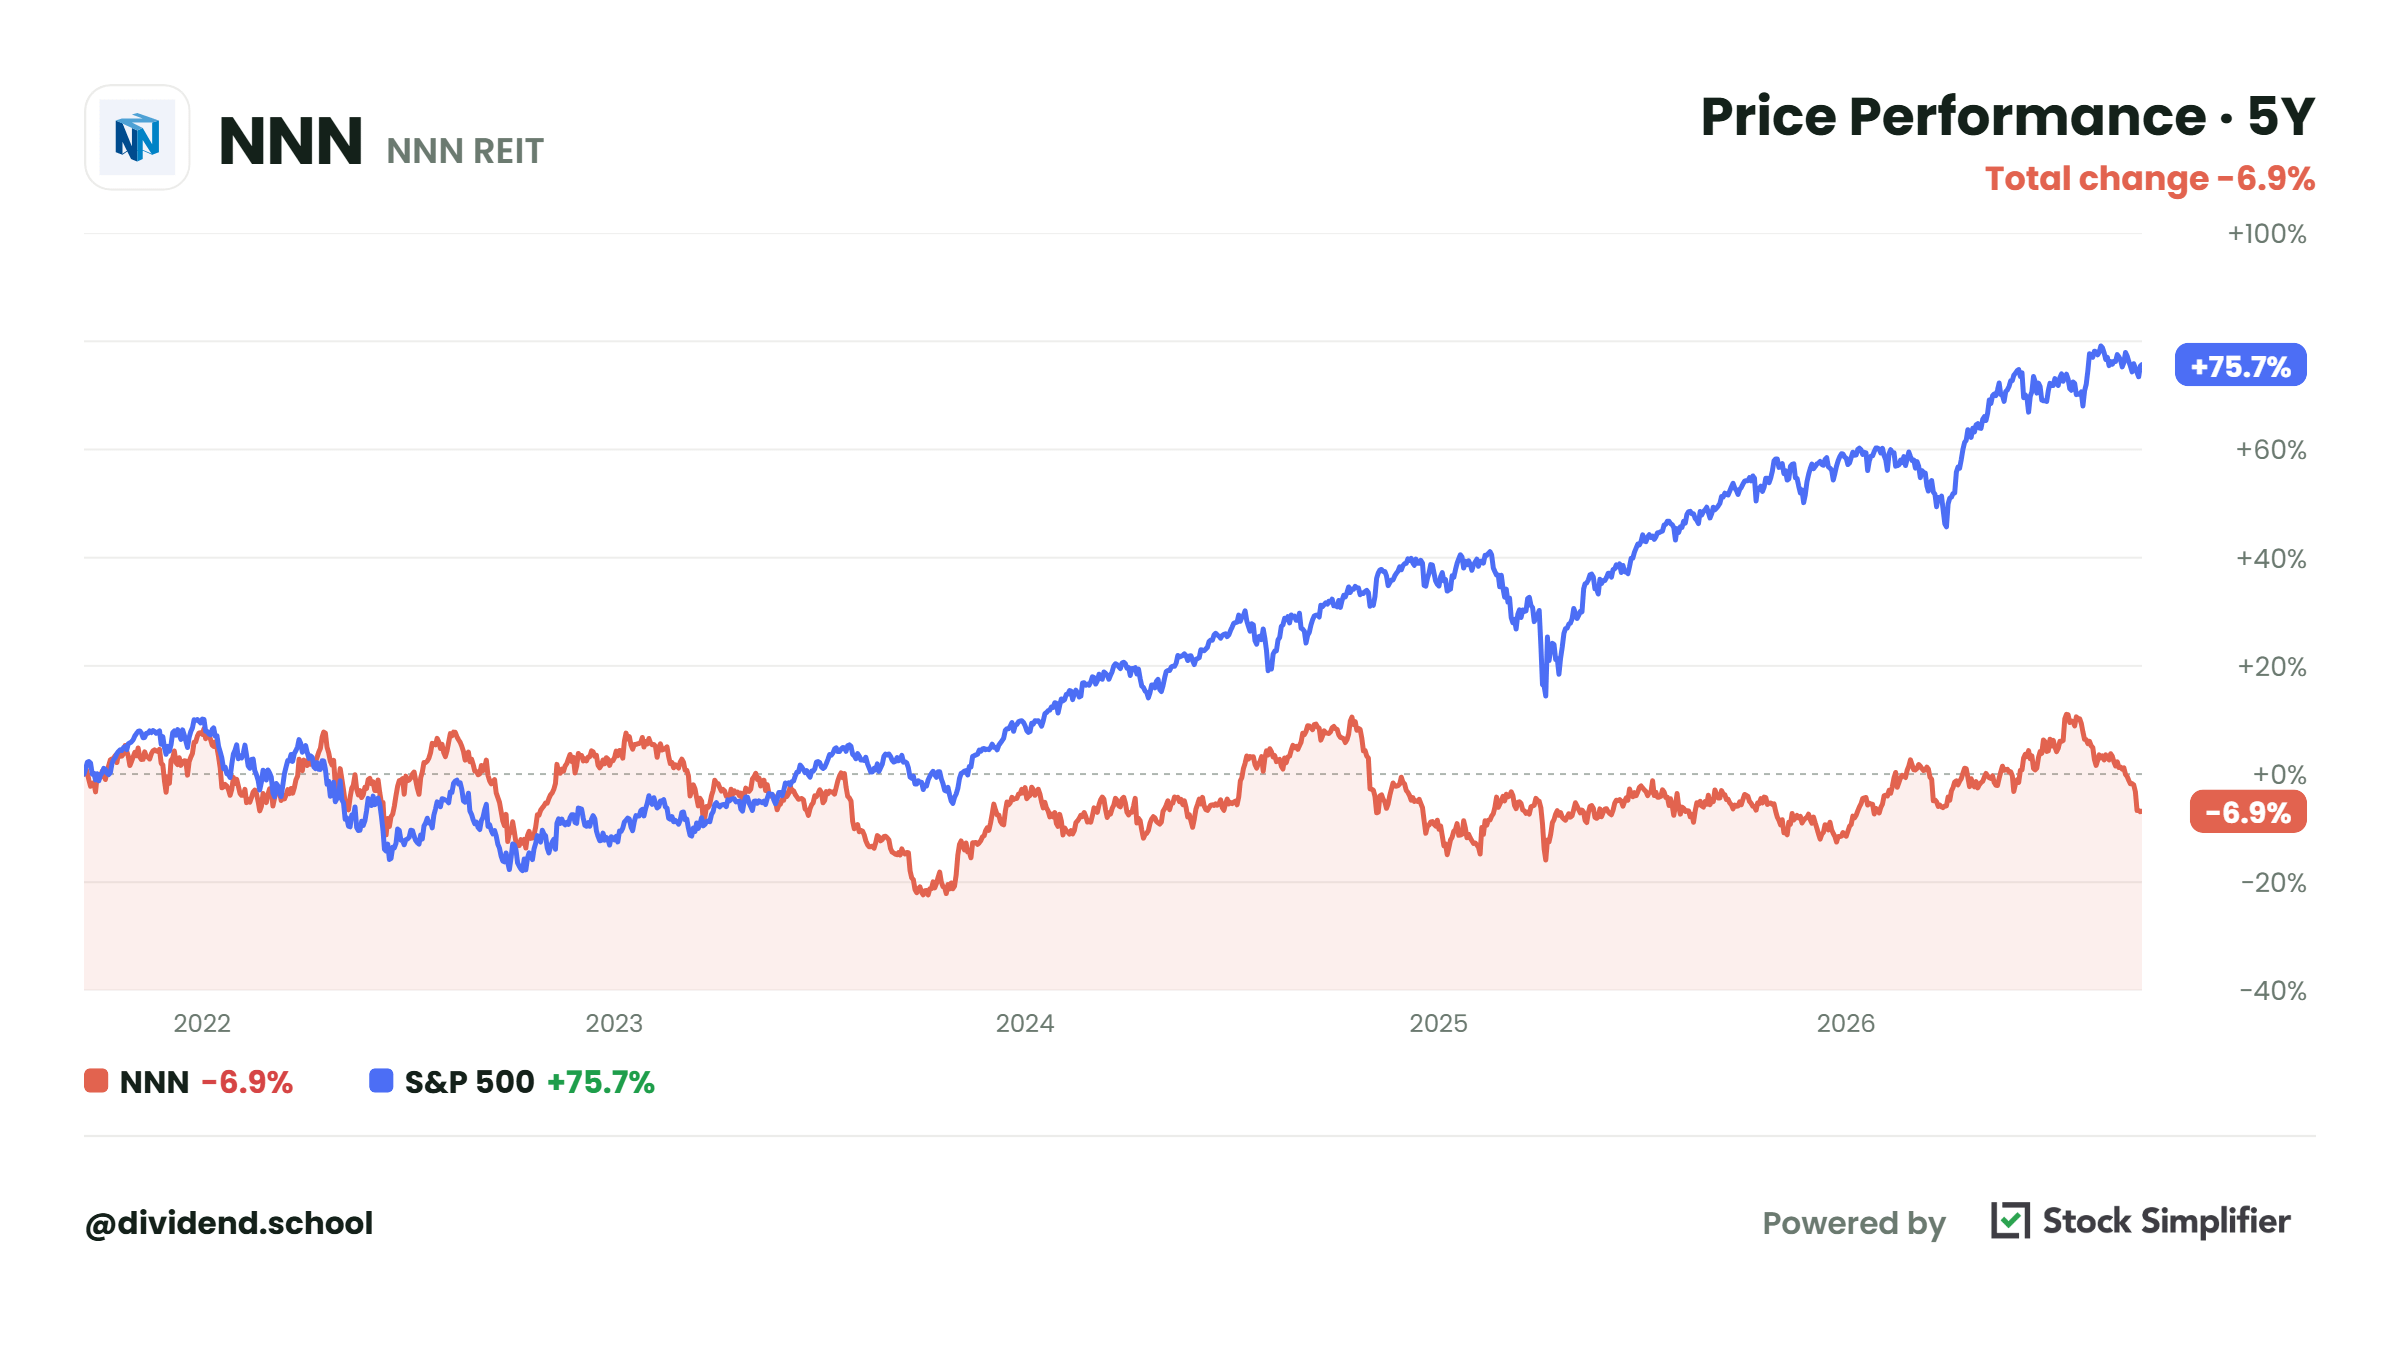
Thirty-seven consecutive annual dividend increases, and this is the REIT that gets zero love, and nobody talks about.
NNN buys freestanding retail buildings, convenience stores, car washes, auto parts shops, and leases them on long terms where the tenant pays the taxes, insurance, and maintenance. Boring on purpose.
AFFO: $0.90 a share
Dividend paid in the quarter: $0.60
AFFO payout: 66.7%
Raised to $0.62 a quarter on July 15, the 37th straight annual increase
Full-year AFFO guidance: raised to $3.55 to $3.59
Forward payout: 69.5% ($2.48 ÷ $3.57)
Occupancy: 99.1%
So why does NNN sit four spots above Omega on nearly the same yield?
A 5.7% yield at a 67% payout, against Omega’s 5.8% at 82%. Same asset class, nearly the same yield, but a 15-point difference in the payout ratio. That’s why it’s rated higher. Plus, the business model is far more stable, and they aren’t under regulatory and legal fire.
The lesson: despite asset classes, we need to determine the strength of the payout ratio on an individual company basis. Using blanket statements, like REITs under an AFFO payout of 85% are safe, can get us in trouble. We also need to understand the business model, drivers, and risks of that particular business. Not all REITs are the same.
Trap or not: this REIT carries some familiar names on its roster sheet, some for the wrong reasons. Dave & Buster’s is 3.6% of rent, and AMC Theatres is 2.4%. Leverage of 5.7 times is at the high end of where NNN runs, and dividend growth is slow, 3.3% on the last raise. This one isn't a trap, but I'm not sure about the length of the runway. With debt higher and slower dividend growth, this belongs on a watch list.
[PAYWALL]
That’s the check, free. One coverage number per asset type, seven names that pass it, and two that don’t.
What’s below the line is the part I can’t give away. Three more picks, and they’re where the yield and the safety stop trading against each other: a 7.9% payer covered 1.4 times whose entire customer list is one company, a 6.3% REIT that suspended its dividend in 2020 and now covers it 1.5 times, and my number one, a 6.5% partnership whose next scheduled raise would break its own coverage rule, which is either the catch or the whole opportunity.
Plus the third failed yield: a 14% payer whose dividend is covered right now and whose book value is down 45% since 2021.
And the recheck on August’s top three, including the one whose earnings just crossed under its dividend by a penny.
Members, keep scrolling. Everyone else, seven days free. Membership is $369 a year or $35 a month, with a 30-day money-back guarantee either way.