

Hi everyone!
Every stock on this month’s list looks cheap next to something.
S&P Global trades at 22.9 times free cash flow, against a five-year average of 34.2. Alexandria Real Estate trades at 7.1 times its funds from operations and yields 6.33%. Enterprise Products yields 6.21% at 12.5 times earnings.
So this month's question is simple. Cheap compared to what?
We use three yardsticks, and a stock can pass one and fail the other two:
Its own history. What investors paid for this business over the last five years.
Its peers. What investors pay for the same kind of business today.
What we think the business is worth. For Universe names, that’s our Buy Below.
The first two tell us where the price sits. Only the third tells us whether to buy, and this month it disagrees with the first two more often than it agrees.
First, a quick look at last month’s five.
Last month’s board, revisited
Here is where our September five sit, from the prices in that issue to the October 9 close:
TELUS (TU): $9.10 to $7.72, down 15.2%
Nike (NKE): $37.05 to $34.71, down 6.3%
Home Depot (HD): $310.87 to $290.74, down 6.5%
Novo Nordisk (NVO): $43.45 to $38.64, down 11.1%
Comcast (CMCSA): $24.88 to $20.66, down 17.0%
All five went down, and I’m grading my own calls here.
Nike was the trap. It reported after the close on October 1, missed on sales, and guided lower; the next day it hit a 13-year low. That call held. TELUS was the pass and the case study; it’s down another 15%.
Comcast is the one that hurts.
I called it the only name on the list I’d keep working on, and it fell the most. Comcast hasn’t reported since July. Since our issue, KeyBanc downgraded it to Underweight with an $18 target, citing the theme parks and subscriber losses. It reports on October 22, and that’s when we find out whether the broadband losses the CFO warned about in September are worse than the cash flow can carry. In September, the dividend took 27% of free cash flow. (Price changes here leave out dividends.)
Okay, let’s dive in and grade this month’s batch.
1. Alexandria Real Estate (ARE)
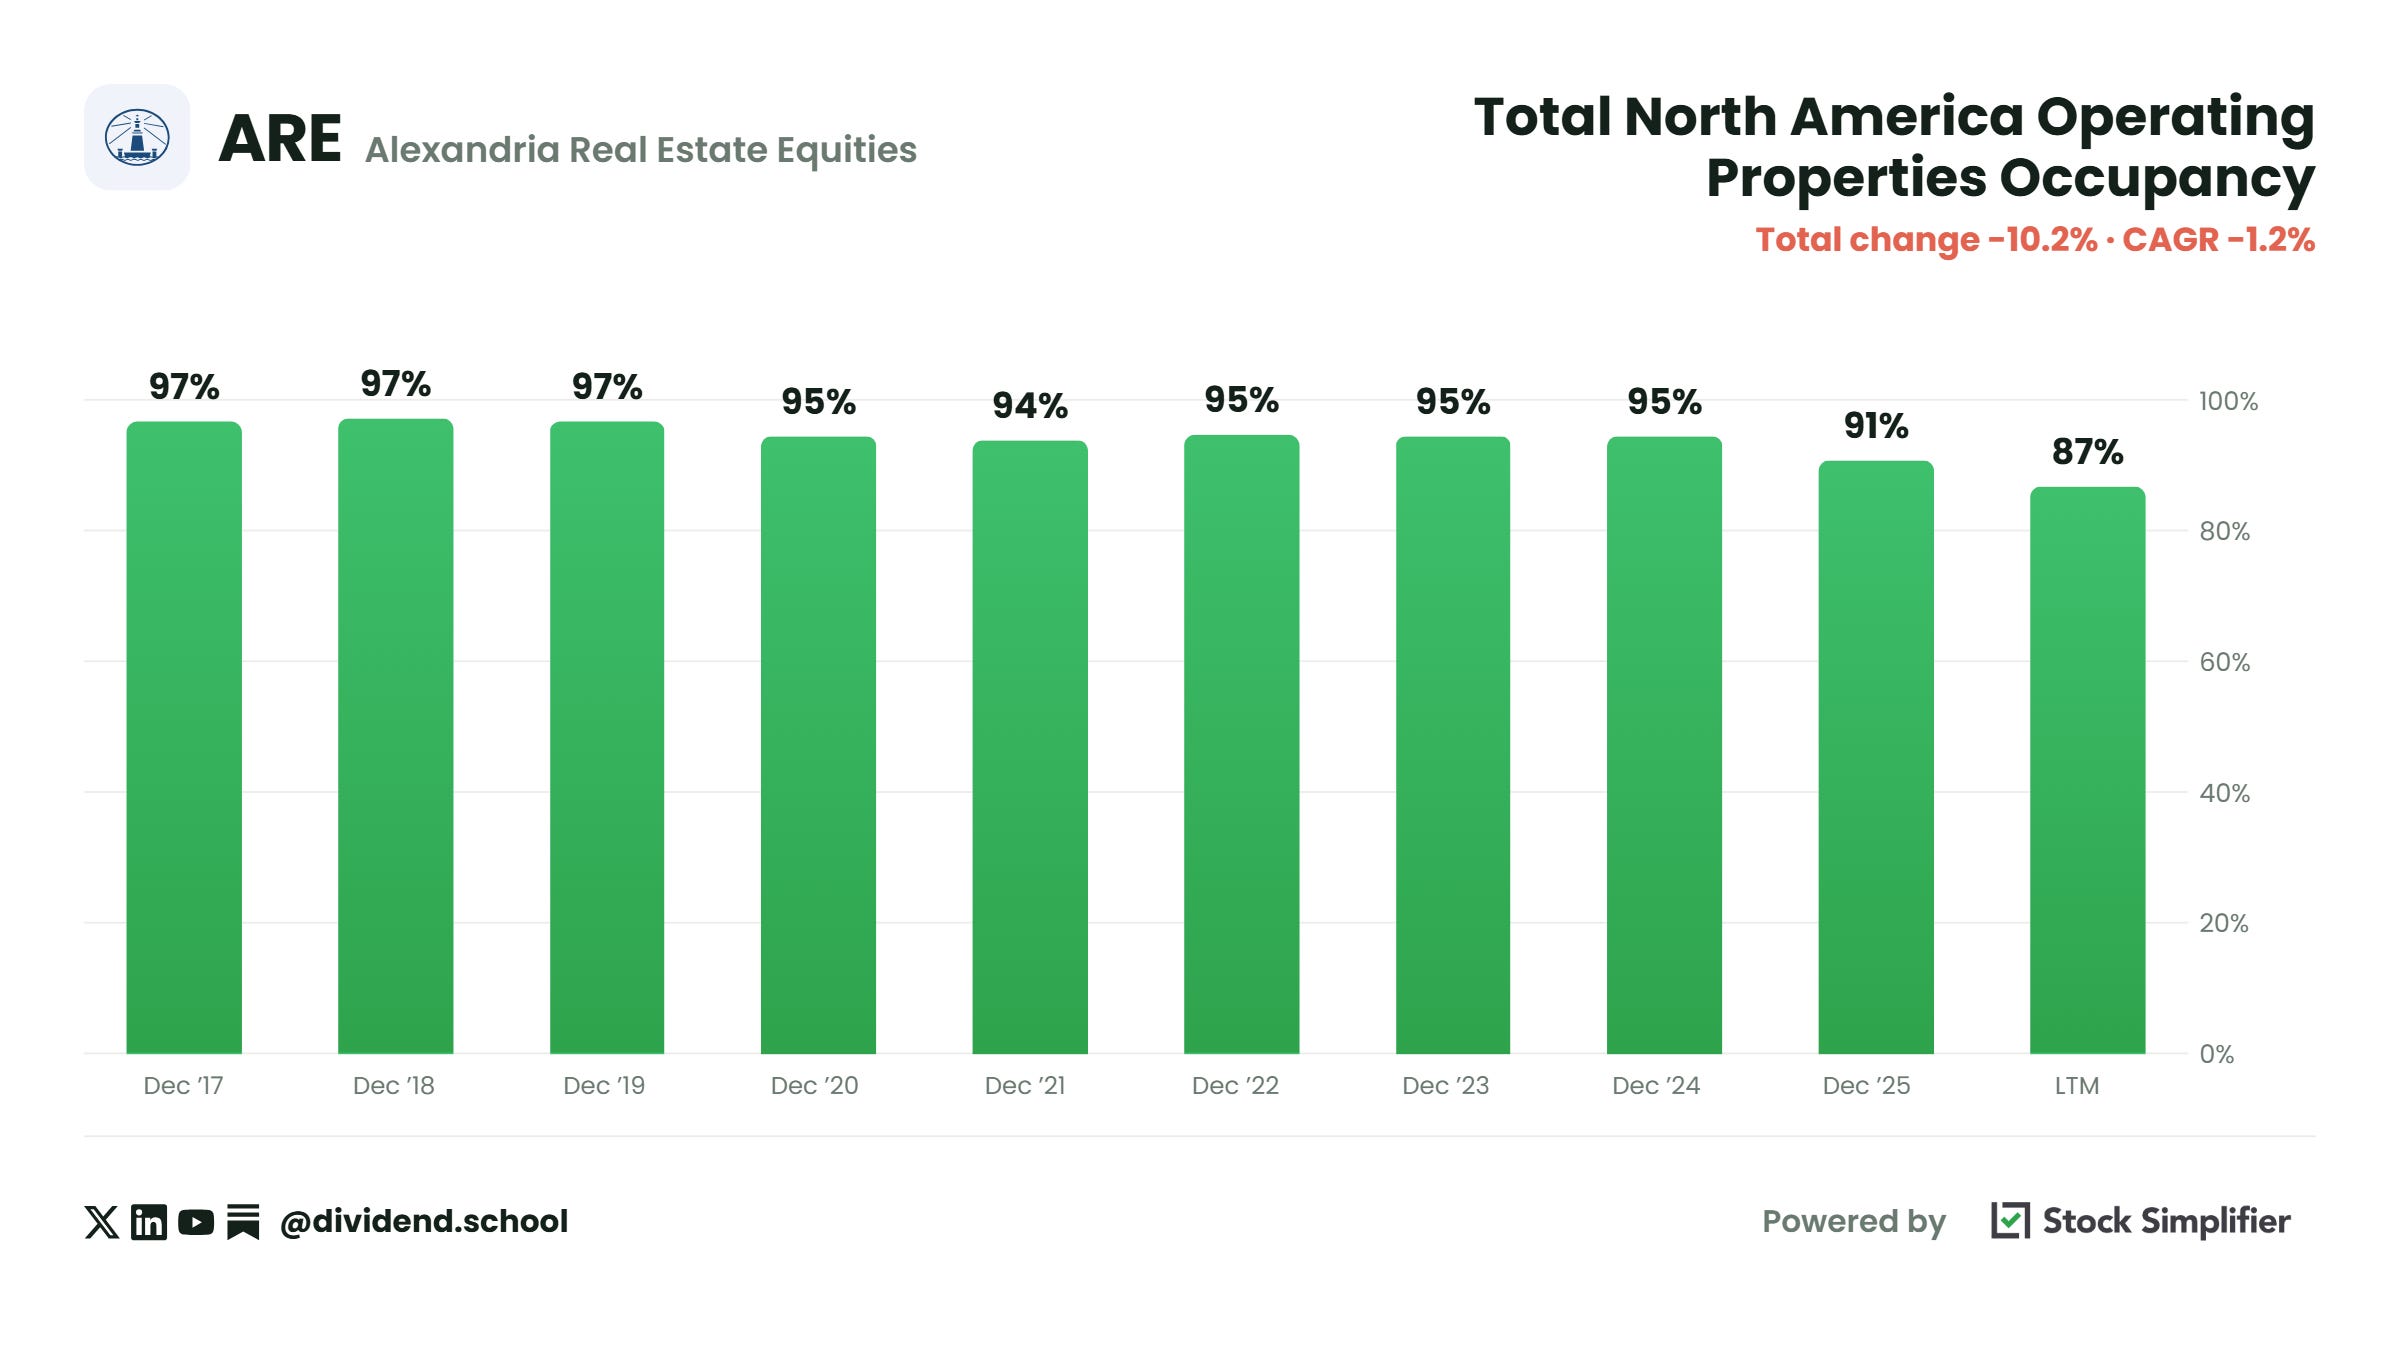
Alexandria owns lab buildings. Drug companies and biotech start-ups rent them, mostly in Boston, San Francisco, and San Diego, in clusters the company calls Megacampuses.
At $45.51, the stock pays us 6.33% and sits 42.1% below its 52-week high of $78.54.
The number that puts it on every cheap list is FFO. Alexandria guides to $6.40 per share from operations this year, on an adjusted basis. FFO is how a REIT reports earnings; it adds back the depreciation on buildings, which usually hold their value better than the accounting says.
$45.51 / $6.40 = 7.1 times FFO.
The dividend is $2.88 a year, so the payout is 45% of FFO. A REIT at 7 times earnings paying out less than half of them. On our screens, that’s the bargain of the sector.
So why is it this cheap?
The dividend already got cut
On December 3, 2025, Alexandria cut its quarterly dividend from $1.32 to $0.72. That’s a 45% cut, and it has held at $0.72 since.
Same setup as TELUS last month: the cut is behind us, and the question is whether the reset dividend is the floor.
We think the dividend is the safe part. At 45% of FFO, there is room. The question is the FFO.
The FFO is still shrinking
What does the business underneath look like?
FFO per share, as adjusted: $9.01 in 2025, guided to $6.40 this year, down 29%
Operating occupancy: 86.9% at the end of June, down from 90.8% a year earlier
Same-property net operating income, second quarter: down 10.6%
Guidance for rent changes on renewals this year: down 9% to down 1% (down 15% to down 7% in cash)
Guidance for occupancy at year-end: 86.2% to 87.8%
In plain English, Alexandria has fewer tenants, and the ones renewing pay less. Some tenants are winding down altogether, and Alexandria’s guidance carries $25 million to $30 million of lost FFO from tenant wind-downs this year.
A 7.1 multiple on a number that’s still falling won’t last long.
The interest that hasn’t hit the income statement yet
Most of us skip this line in a REIT’s numbers. For Alexandria, it was worth $1.94 a share last year.
When a company builds something, the interest on the money it borrows to build it doesn’t hit the income statement. Instead, it gets added to the cost of the building. That’s called capitalized interest, and it’s normal accounting. But while a building is under construction, its interest bill is invisible to us in earnings, and FFO looks higher than it will once the building is finished.
Alexandria capitalized $330.4 million of interest in 2025, or $1.94 a share, against FFO of $9.01. This year’s midpoint, $240 million, works out to $1.40 a share, or 22% of the $6.40.
What does this year’s guidance tell us?
Capitalized interest: $220 million to $260 million, down from $330.4 million
Interest expense: $260 million to $300 million, up from $226.7 million
The interest bill isn’t going away; it’s moving from the balance sheet to the income statement. Every building that finishes without a tenant, or gets paused, moves more of it. That’s a headwind for the FFO number we’re valuing, even if occupancy stops falling.
And the newest money costs more. In August, Alexandria sold $1 billion of junior subordinated notes at 7.250%, which is $72.5 million in annual interest.
Where the cash comes from
Is the business paying for itself?
Over the last twelve months, operating cash flow was $1,279 million. Development spending was $1,739 million. That’s $460 million short before a single dividend gets paid, and the dividend costs $492 million a year at the new rate.
So where does the rest come from? Selling buildings. The 2026 plan is $2.9 billion in sales, partial sales, and other capital, at the midpoint. As of August 3, $170 million was done, $1.16 billion was under deposit, letter of intent, or sale negotiation, and $471 million was still “multiple alternatives under evaluation.” We’ll get an update on October 26. Leverage sits at 7.0x net debt and preferred to EBITDA, versus a year-end target of 5.6 to 6.2.
We have nothing against selling assets to fix a balance sheet. But selling buildings in a weak lab market means selling at weak prices; Alexandria wrote down $2.2 billion of real estate in 2025 alone. And every building sold takes its rent and FFO with it.
Is any of this fatal? No. We are not predicting another cut. Occupancy counting signed leases that haven’t started yet is 90.9%, the payout leaves room, and the board authorized a $500 million buyback it hadn’t touched as of June.
Verdict for our process: Alexandria is cheap against its own history and on any screen, and both measure a business that earned $9.01 of FFO last year and is guiding to $6.40 this year. The FFO in the denominator is falling; it still carries interest the company hasn’t expensed yet, and the balance sheet depends on asset sales that hadn’t closed as of August. JPMorgan moved it to Underweight in September. Results come after the October 26 close, and 2027 guidance comes at Investor Day on December 2.
For me, a trap. Not because of the dividend, but because earnings haven’t bottomed out yet.
2. S&P Global (SPGI)
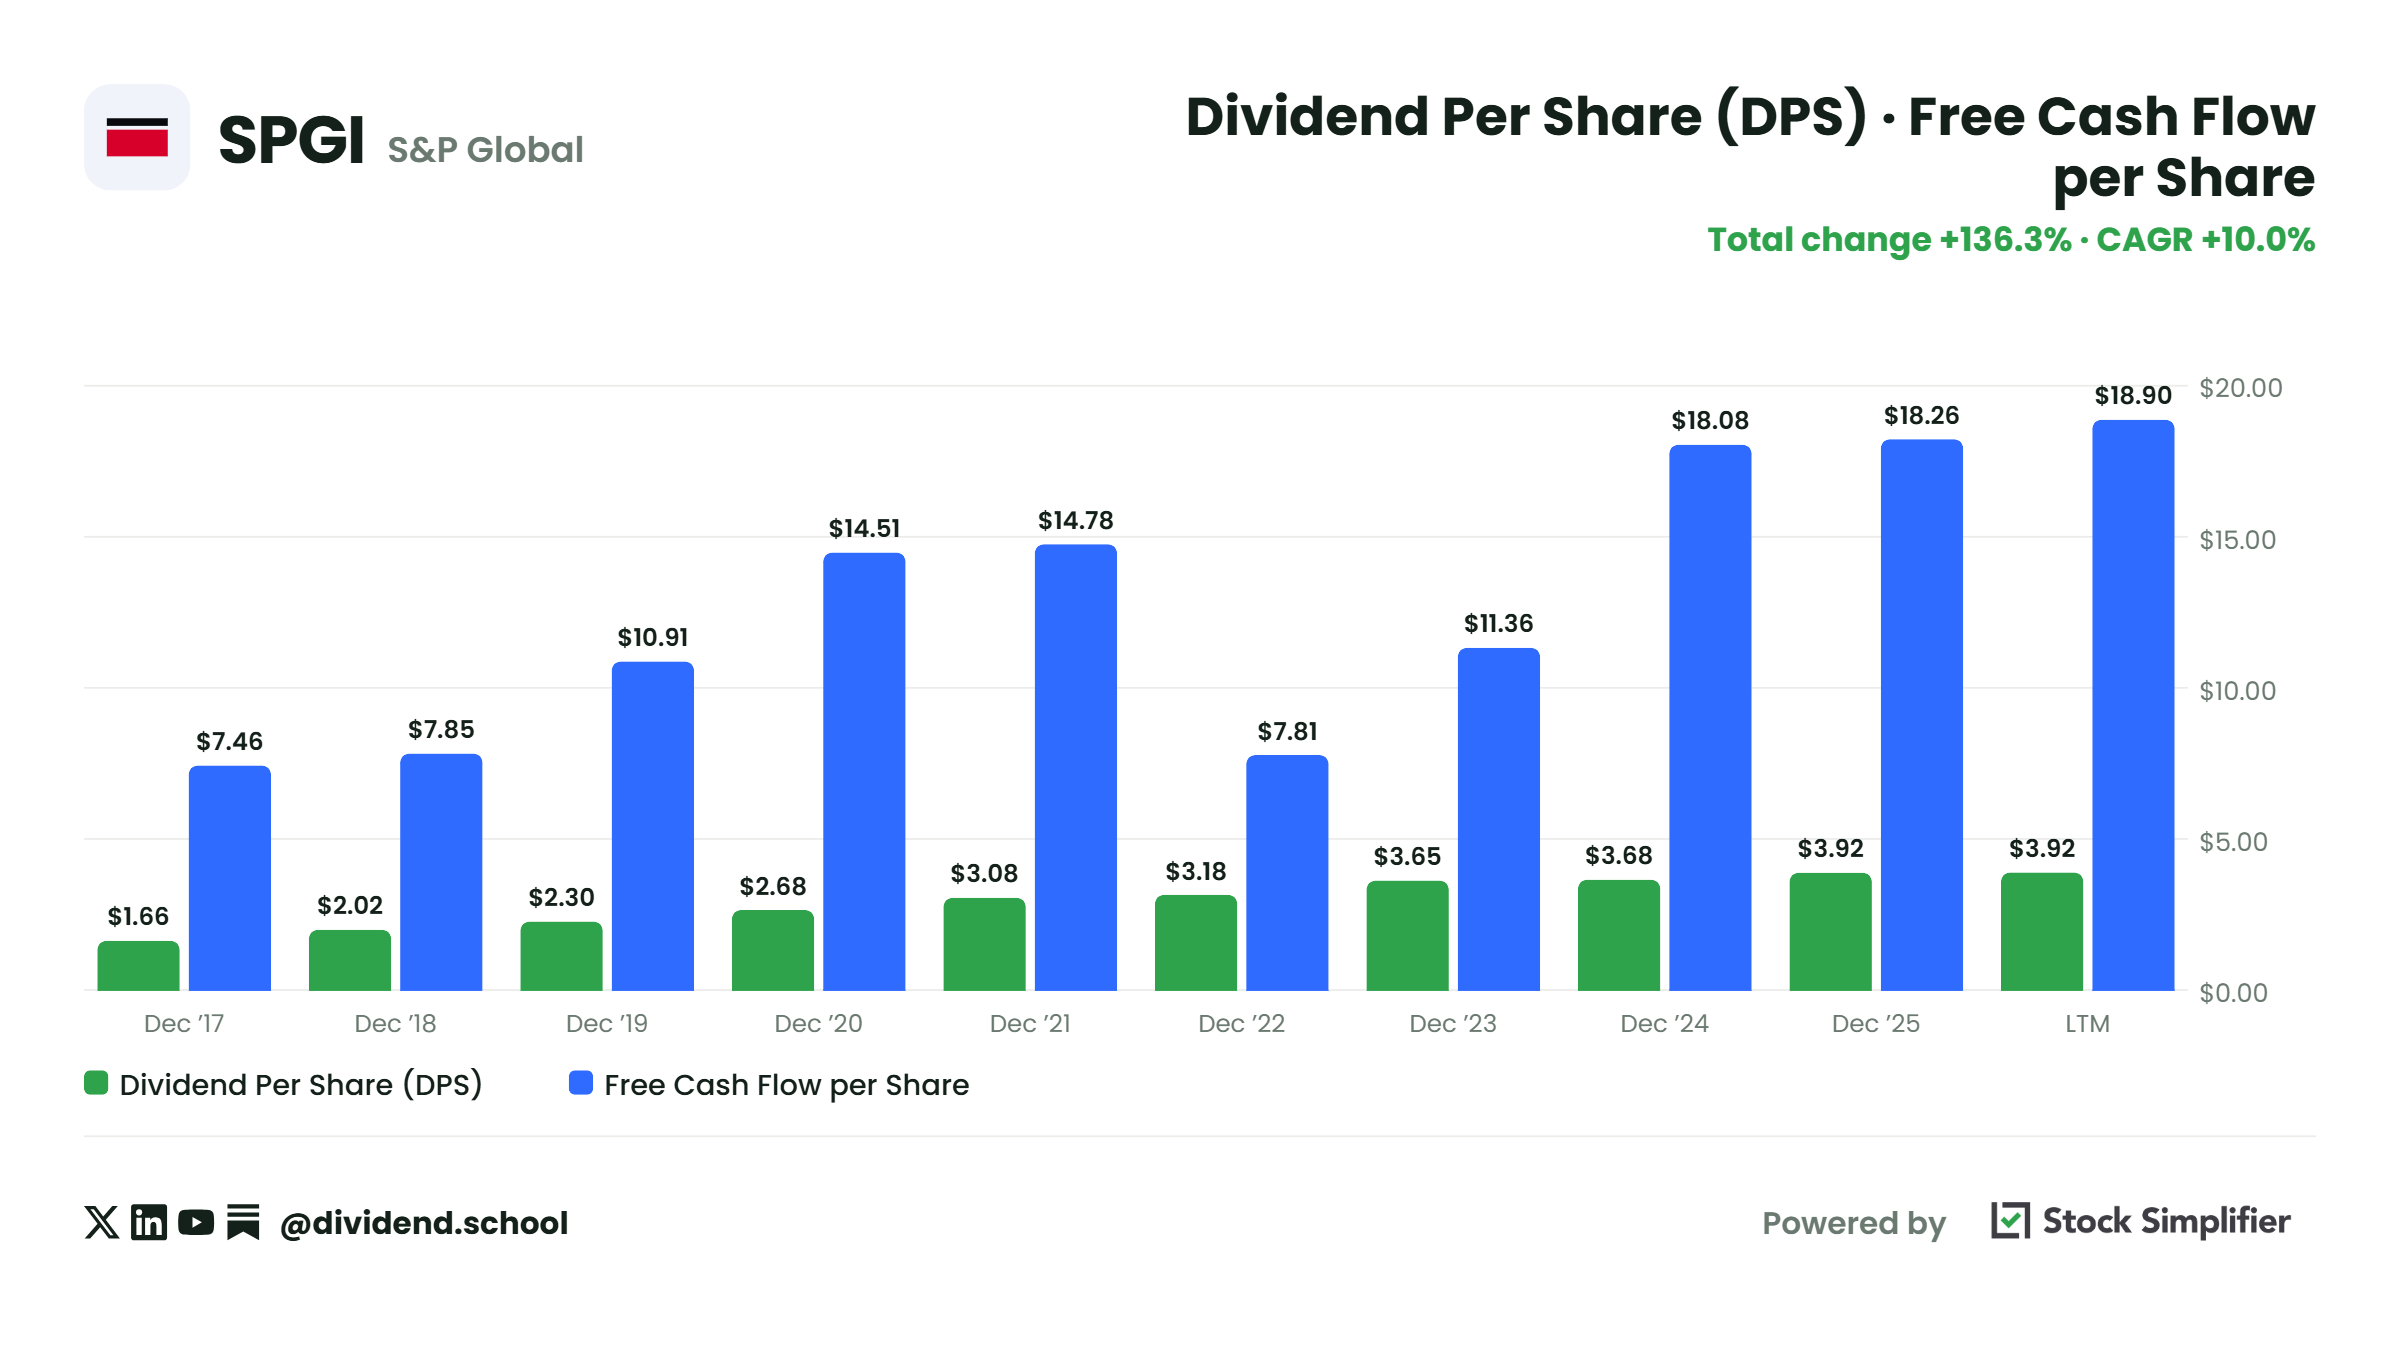
S&P Global sells the plumbing of the financial markets. It rates corporate bonds. Its index business runs the S&P 500 and the Dow, and funds that track them pay it a fee. It sells the data behind Capital IQ and the Platts prices that oil and gas contracts settle against.
At $407.82, the stock pays a 0.95% dividend, and it has fallen from a 52-week high of $552.25.
So what happened?
Two things. In February, S&P guided 2026 below analyst expectations, and the stock fell 9.7% in a day. That came amid market worries that AI will replace data and software businesses, and S&P got sold off with the rest.
The business didn’t get the memo
Look at the second quarter, with the Mobility business (spun off in July) taken out:
Revenue: $3,678 million, up 11%
Ratings revenue: up 17%
Indices revenue: up 20%
Earnings per share, GAAP: $4.08, up 26%
Adjusted earnings per share: $4.83, up 23%
Full-year guidance, excluding Mobility: revenue up 5.9% to $ 7.9 B, and adjusted EPS up to $17.75.
Does that look like a business AI is replacing? Not to me. Revenue grew 11%, and earnings grew 26% while the market priced it like one.
Check the 52-week high before you trust it
On July 1, S&P Global spun off its Mobility division, the automotive data business, as a new company, Mobility Global (MBGL). Every SPGI shareholder got one MBGL share for each SPGI share.
The $552.25 high came before the spin. The $407.82 price comes after it. Those two prices describe two different companies.
MBGL closed at $18.22 on October 9. Add that back at today’s price and the drop from the high is 22.9%, not 26.2%. Still a big drop, just a smaller one than the screen shows.
Any time a stock looks like it fell off a cliff, we check whether it handed out a piece of itself first.
Two yardsticks, two answers
So is it cheap?
Against its own history, yes. Over the last twelve months, S&P generated $5,258 million of free cash flow on its own definition (operating cash flow, minus capital spending, minus payouts to partners in its joint ventures). At a $120.2 billion market cap, we’re paying:
$120.2B / $5,258M = 22.9 times free cash flow, against a five-year average of 34.2.
Big caveat here: that twelve months still includes Mobility through June. Take it out and the free cash flow is a bit smaller and the multiple a bit higher.
On earnings, $407.82 / $17.625 (the guidance midpoint) is 23.1 times adjusted EPS.
Against what the business is worth, no. Our Buy Below for S&P Global is $386.10, and the stock sits 5.6% above it. We cut that Buy Below 5.5% in the September 29 re-run for the same reason we cut NextEra’s: as rates rise, the price we’ll pay for future cash flows falls.
That’s the trap inside the five-year average. The 34.2 includes 2021, when money was cheap, and 2022, when S&P closed the IHS Markit merger, free cash flow dipped, and the multiple spiked to 43.4. Leave 2022 out and the average is 31.9. The discount is still big, but the average reflects the conditions that built it, and rates today are higher than in most of those years.
The dividend is the small part of the return
S&P has raised its dividend every year for more than 50 years and paid one every year since 1937. The payout is 22% of free cash flow ($1,156M of dividends / $5,258M).
But look at the raises:
2023: up 5.9%
2024: up 1.1%
2025: up 5.5%
2026: up 1.0%
So where does the cash go? Buybacks. S&P bought back $5.2 billion of stock over the last twelve months, and it now expects more than $7 billion this year, which is 5.8% of the company at today’s price. Diluted shares are down 3.5% in a year.
For us as income investors, that’s the trade-off: a 0.95% yield growing at 1% to 6%, wrapped around one of the best businesses in the market and shrinking its share count fast.
Verdict for our process: cheap against its past, fairly priced against what we think it’s worth. The history yardstick says buy; the Buy Below says not quite yet. The business is growing double digits, and the market is still pricing it for an AI threat that hasn’t shown up in a single quarter. Results October 27.
For me, a hold, and a close one. At $386.10, it moves back to Buy. Full disclosure, I am a shareholder with a 1.2% position size.
That’s two graded in full, free: what’s inside each multiple, and the verdict.
Below the line, the other three:
A landlord to Walmart and Tractor Supply, 99.8% leased, yielding 4.86% near its 52-week low. It has $1.1 billion of stock already sold at $74.90 a share. The question is what the next share costs at today’s price.
A business we put at the top of a list two weeks ago, now 2% under its Buy Below, at 22.7 times free cash flow against 32.6 for five years. One caveat in that free cash flow shrinks the discount.
A 6.21% yield covered 1.77 times, 9.6% below our Buy Below, and more expensive than its own five-year history on every multiple. Why I’d still buy it first.
Plus the scorecard: all five on all three yardsticks.
The rest of this issue is for paid Dividend School Pro subscribers. Membership is $369 a year or $35 a month, with a 30-day money-back guarantee.
Members, keep scrolling. Everyone else, seven days free.