
The Toll-Road of Miniaturization: A Valuation Monday Walkthrough on ASML

ASML is the toll collector on the road to smaller, denser chips. But even a high-quality toll road is cyclical.
Today’s article shows how to value ASML like a quality investor: start with ROIC and reinvestment runway, then ground scenarios in through-cycle capex and the EUV adoption curve, without getting whipsawed by next quarter’s bookings.
TL;DR
ASML’s economic moat rests on EUV leadership, dense supplier/customer lock-in, and long-lived installed-base economics.
Quality lens: ROIC sustainably above WACC, rising installed-base mix, strong FCF conversion, and rational capital allocation.
Through-cycle: Build scenarios around WFE base rates, lithography intensity, and EUV/High-NA timing rather than point-in-time upcycles.
Base case: Anchor 2025 on company guidance, fade margins to mid-cycle, extend EUV layers in logic/DRAM, and add measured High-NA from late decade.
Decision rules: Prefer sustained ROIC – WACC > 5%, FCF conversion > 80% over cycle, and per-share value growth via disciplined buybacks.
Outputs: Sensitivity to EUV units/ASP and service mix typically dominates multiple drift.
Why it matters
ASML sits at the heart of leading-edge chipmaking. Its EUV tools enable patterning for the most advanced logic and increasingly DRAM. Investors often err by:
Extrapolating peak orders and margins rather than modeling through-cycle capex, which is lumpy.
Treating EUV adoption as linear; in reality, layers and litho intensity vary by node and end-market.
Ignoring the installed base: upgrades, field options, metrology/software, and services often smooth cash flows.
Underestimating capital allocation’s role in per-share value—particularly buybacks aligned with mid-cycle economics.
Industry base rates help tether expectations. Industry association SEMI expects global semiconductor equipment sales to reach ~$125.5B in 2025, with WFE around ~$111B and further growth into 2026 (as summarized by Bits&Chips, as of July 31, 2025). Longer-term, Yole Group sees total WFE (equipment + services) approaching $184B by 2030, with patterning remaining the largest segment (as of July 29, 2025).
For ASML specifically, 2025 guidance calls for around 15% net sales growth vs. 2024 and gross margin around 52% ASML Q2 2025 press release, as of July 16, 2025. That anchors the near-term.
Core concepts (quality-investing angle)
ROIC vs WACC and value creation
ROIC: Return on invested capital. Use NOPAT over invested capital. For toolmakers, invested capital includes working capital plus PP&E and capitalized R&D where applicable.
WACC: Blended cost of equity and debt. For large, investment-grade European tech, 7–9% is a reasonable working range in low-rate regimes; adjust for current rates.
Decision rule: Prefer businesses that sustain ROIC – WACC > 5% through the cycle, not just at the top.
Evidence proxies for ASML (as of 2025): gross margin ~53% in Q2’25; installed base management revenue ~€2.1B of €7.7B quarterly sales (~27%), which tends to be high-margin and recurring ASML Q2 2025. These support the case that ROIC likely clears WACC by a healthy spread over time.
Reinvestment runway and capital intensity
Reinvestment runway in lithography is tied to node transitions (logic), layer count (DRAM/NAND), and the EUV-to-High-NA roadmap.
Capital intensity is high at the tool level, but ASML’s installed base and services create annuity-like elements that dampen volatility.
Watch the EUV layer roadmap for logic and DRAM; High-NA timing/uptake is critical to the late-decade runway.
Unit economics and per-share metrics
Unit economics: tool ASPs, throughput, and field upgrades drive lifetime economics per system.
Per-share framing: track buybacks vs. dilution. ASML is running a 2022–2025 program worth up to €12 billion; it expects to repurchase up to 2.0 million shares to cover employee plans, canceling the remainder. In Q2’25 alone, ASML bought ~€1.4B of stock and declared an interim dividend ASML Q2 2025.
Moat durability and evidence (not claims)
Network effects: EUV requires a tightly integrated supply chain (e.g., Zeiss optics).
Switching costs: deep process integration and long qualification cycles.
Data advantage: installed base learnings feed upgrades and computational lithography.
Pricing power shows in margins and limited competitive alternatives at the leading edge.
Valuation: frameworks and scenarios
We’ll focus on a scenario-based DCF with cross-checks to EV/EBIT and EV/FCF versus historical data.
Key drivers to structure scenarios:
WFE base rates through-cycle (SEMI/Yole as outer bounds).
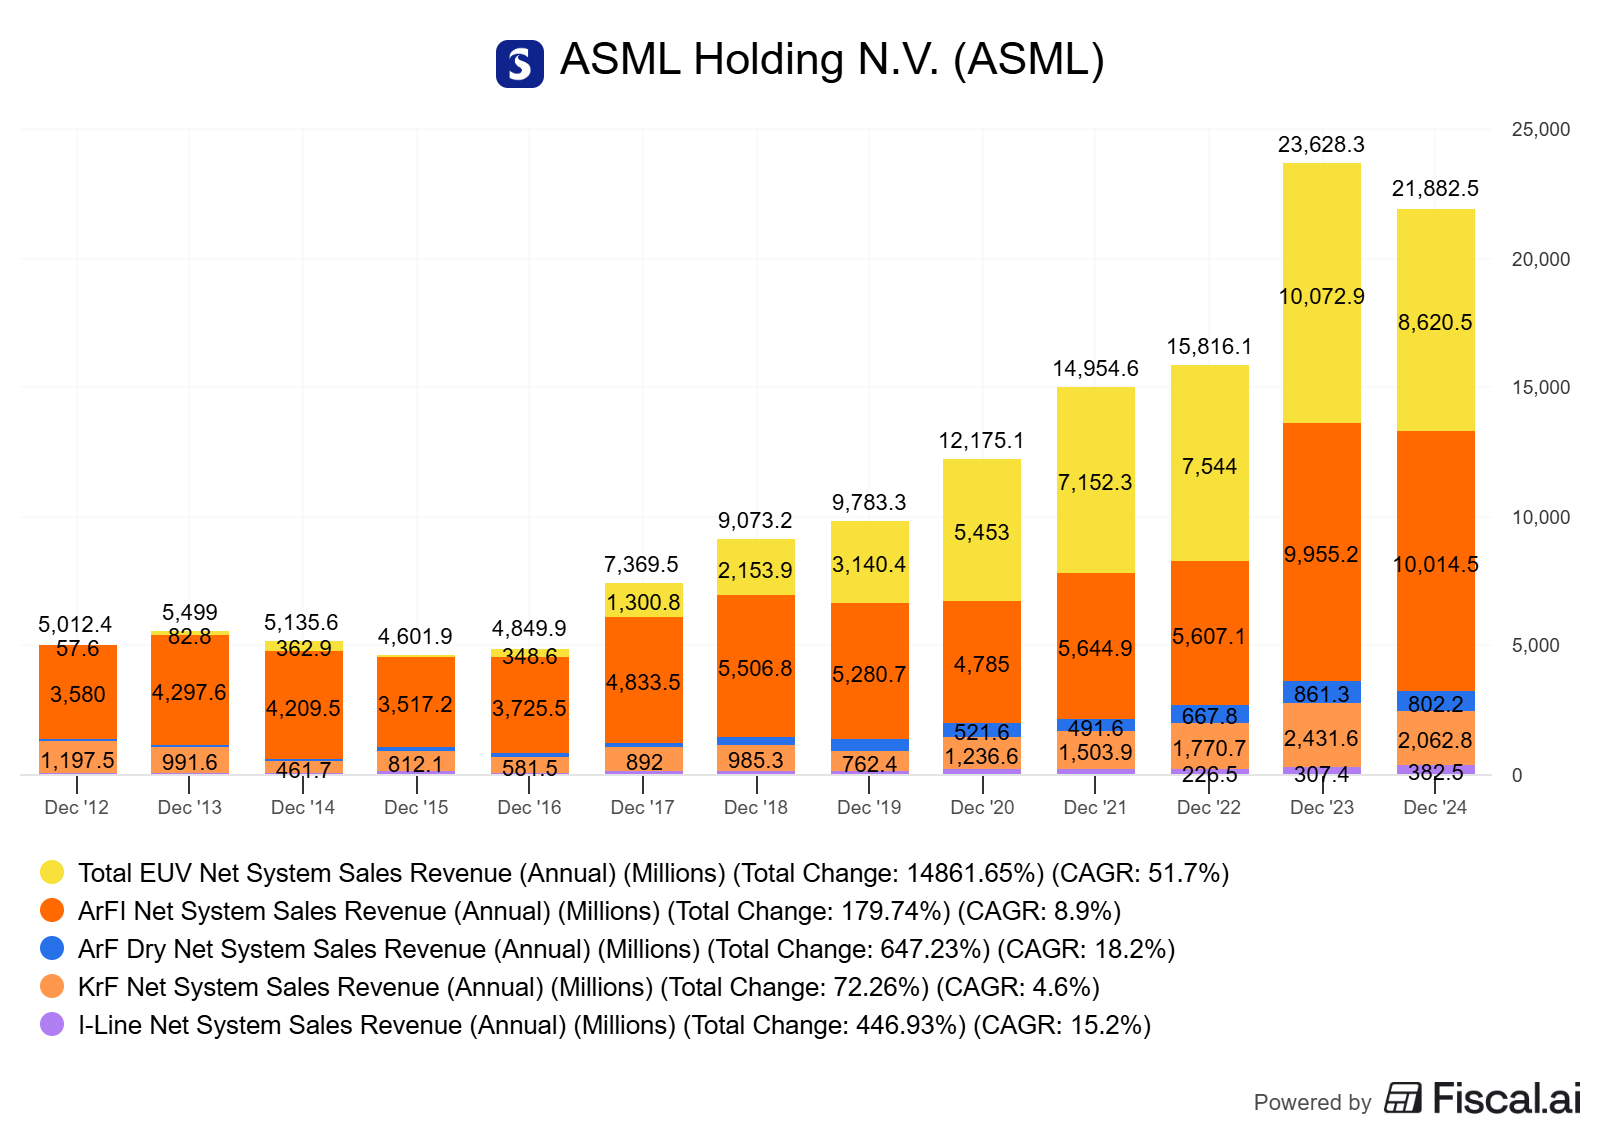
EUV layers per logic/DRAM node; litho intensity trends (management commentary points to rising intensity, especially in DRAM) ASML Q2 2025.
High-NA adoption timing and productivity ramp.
Installed base management mix and margin.
Export controls/China exposure.
FX and tariffs (management flagged tariff uncertainty in 2025).
Mid-cycle margins (normalize gross margin to ~50–52% over time, not peak every year).
Mode-specific deliverables:
Three-scenario table (Bear/Base/Bull).
Sensitivity to two variables: (1) EUV system units/ASP and (2) installed base mix.
Tornado chart on valuation drivers (FCF margin, WACC, terminal growth, EUV units).
Worked example: ASML scenario valuation
Company setup
ASML is the sole provider of EUV lithography; it also sells DUV, metrology/inspection, computational lithography, and services.
2025: guidance for ~15% net sales growth vs. 2024 and ~52% gross margin; Q2’25 bookings €5.5B with €2.3B EUV; first EXE:5200B High-NA system shipped ASML Q2 2025.
Shareholder returns: robust. Ongoing buybacks under a 2022–2025 program up to €12B; regular progress updates show purchases throughout 2025 ASML Share Buyback page.
Five-to-ten-year trends (qualitative summary)
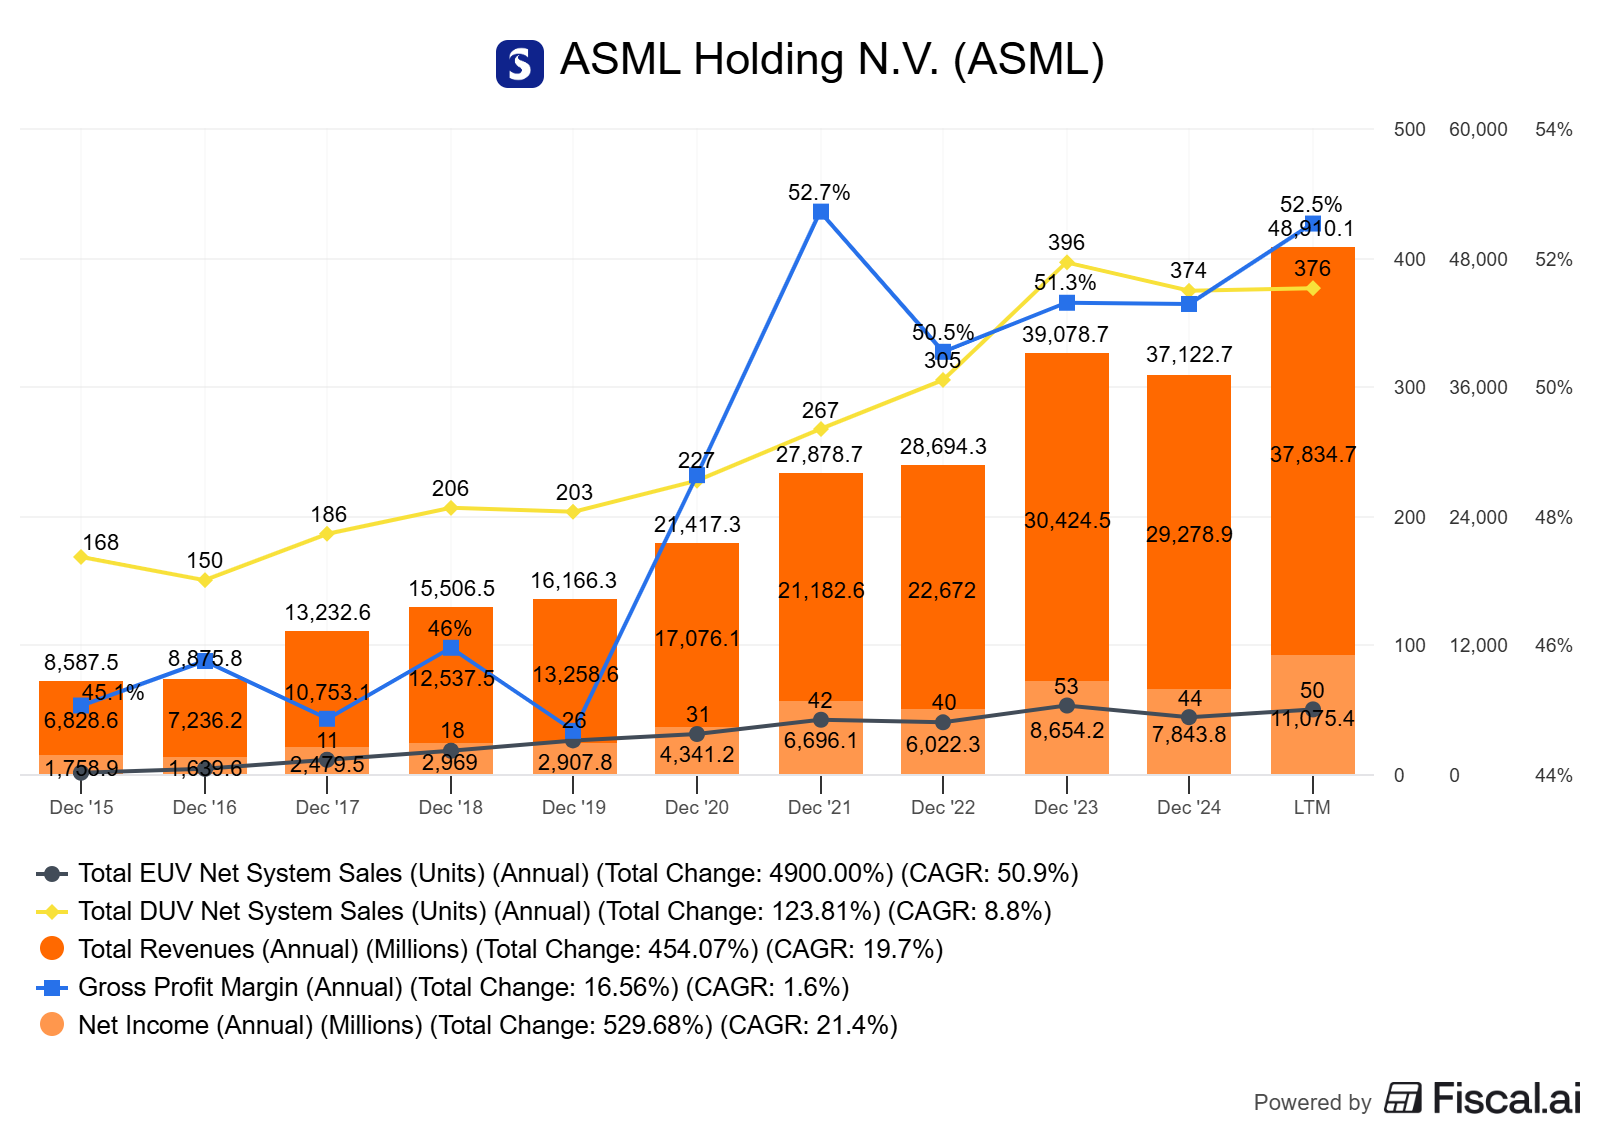
Margins: gross margin has stepped up into low-50s recently; management guides ~52% for full-year 2025 ASML Q2 2025.
Mix: installed base management sales (services/upgrades) now a meaningful share (circa a quarter-plus of quarterly sales in Q2’25).
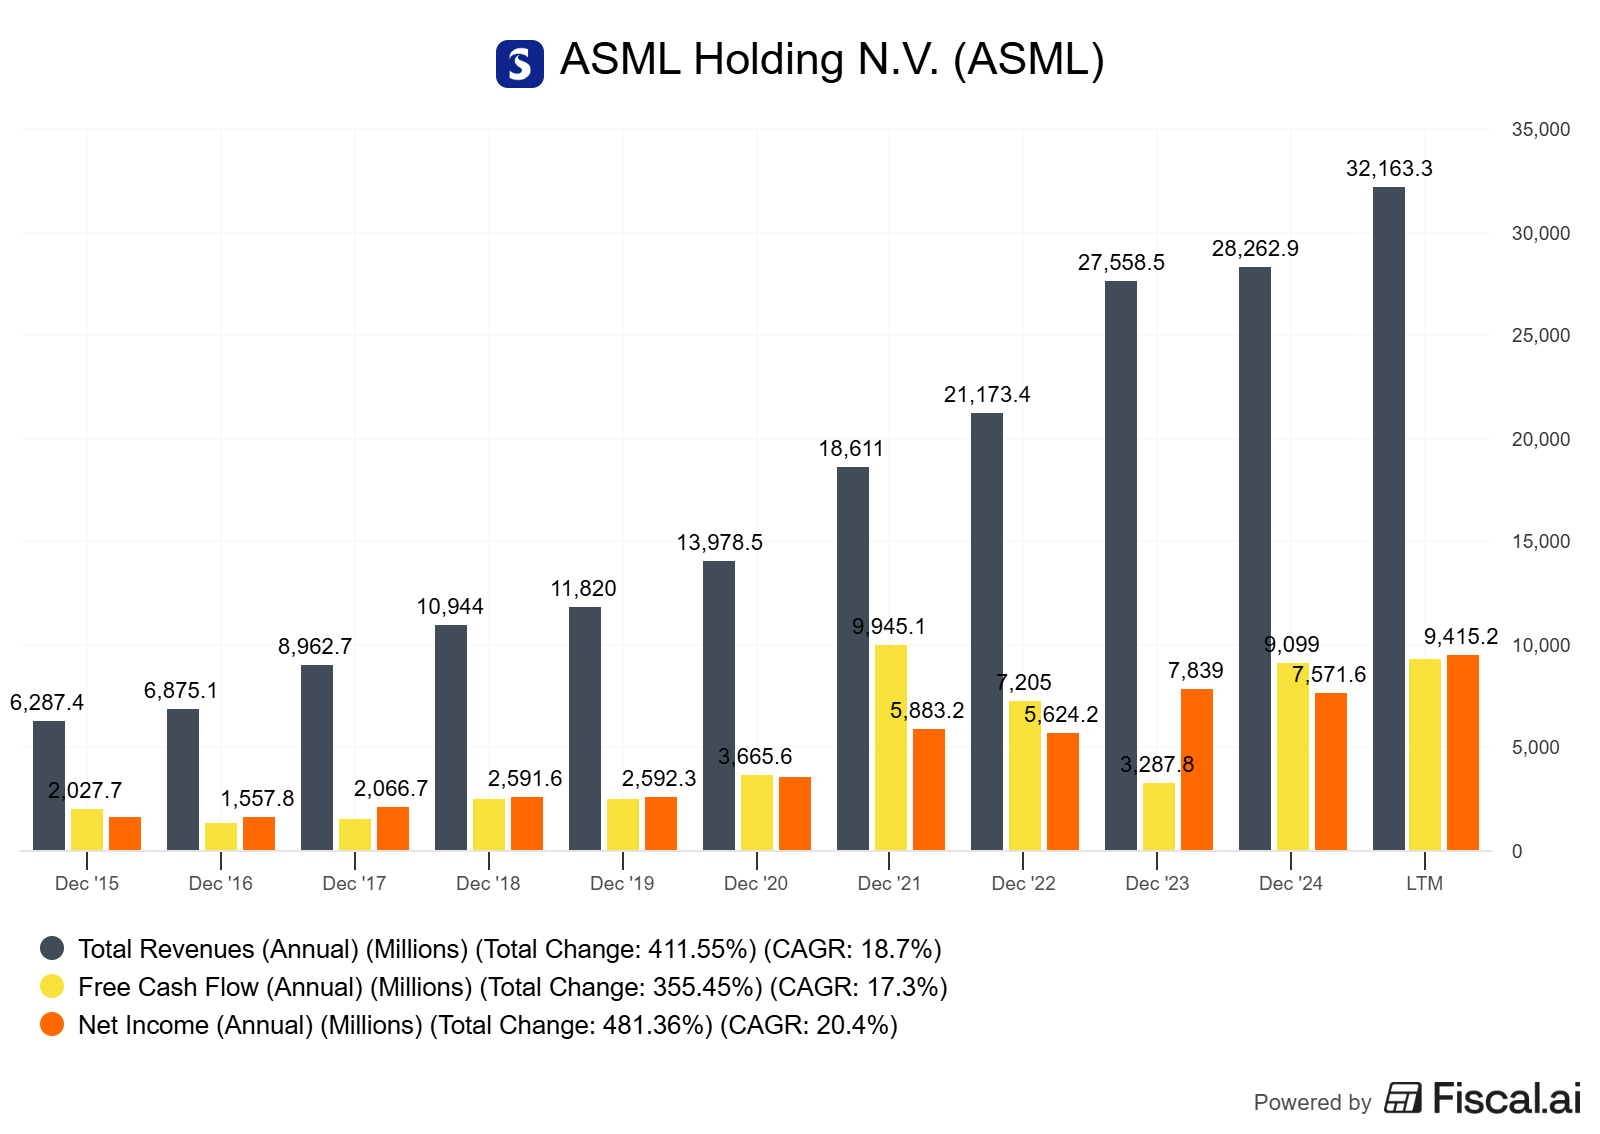
Per-share: cumulative buybacks and rising EPS over the decade (see Annual Report archive; highlights available) ASML Annual Reports hub.
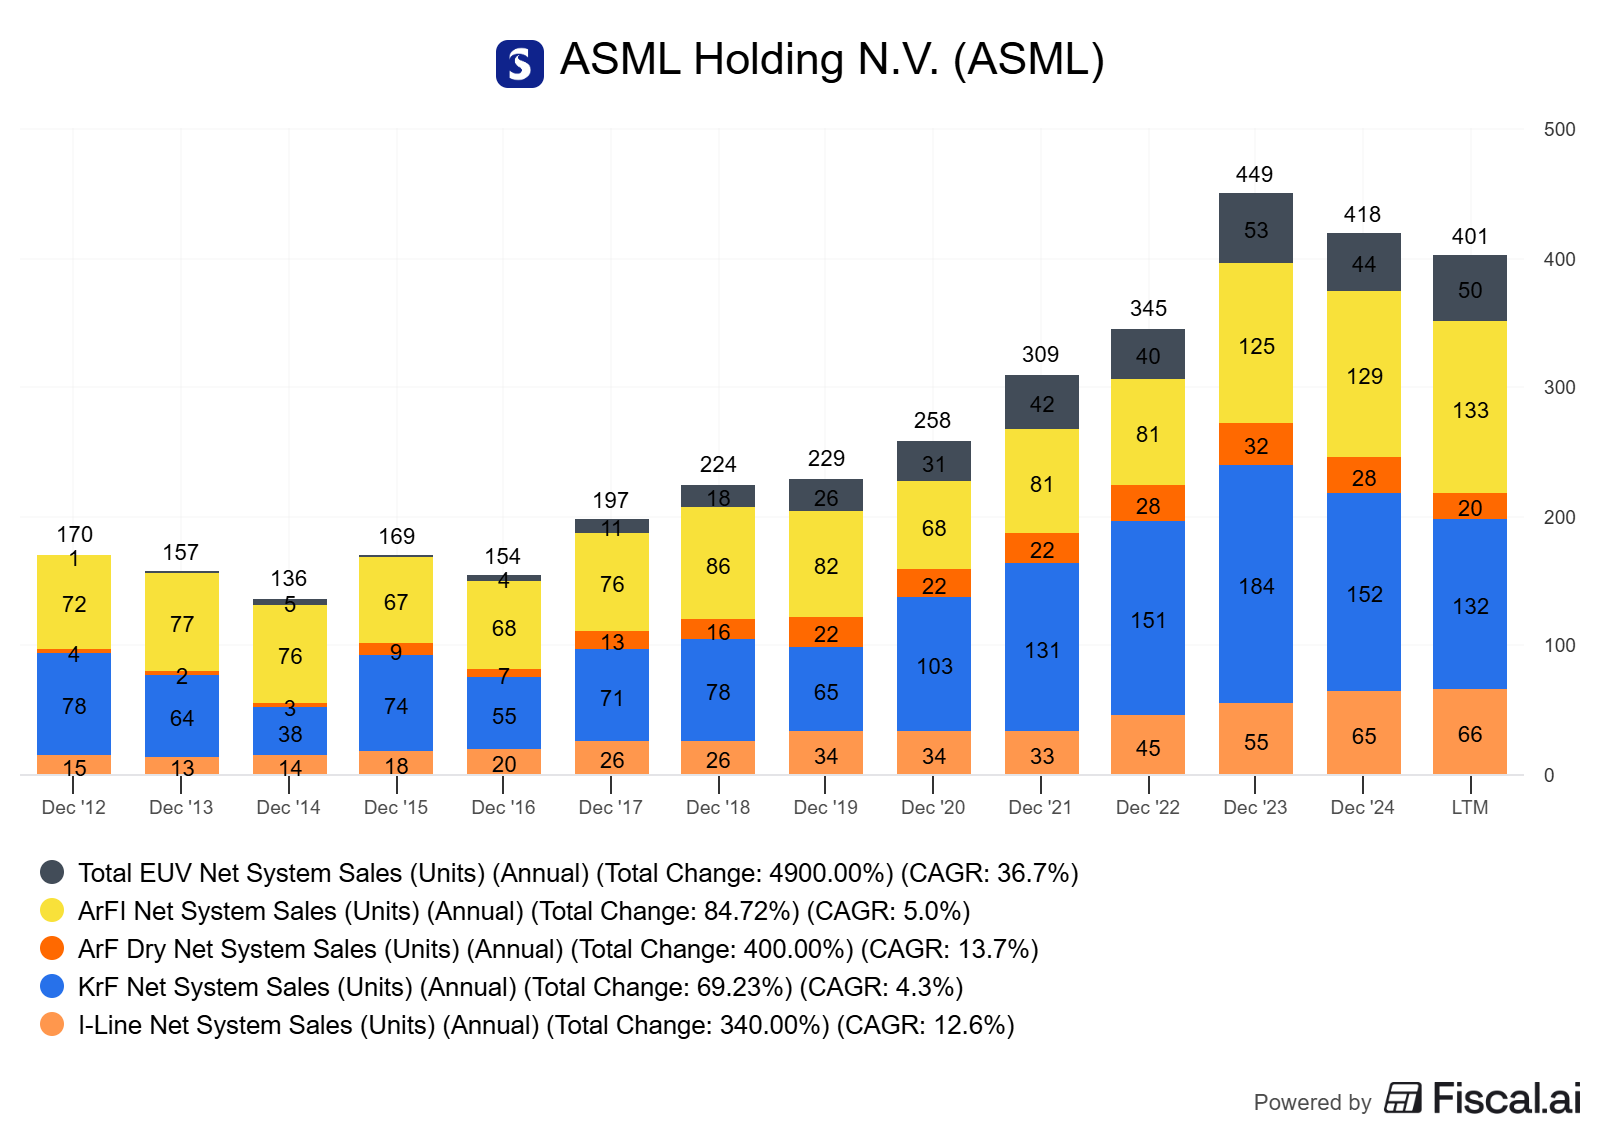
Product cycle: EUV units and layer adoption broadened beyond logic into DRAM; High-NA entering early shipments.
Caveats and alternative interpretations
Some analysts argue lithography intensity moderates mid/late decade as materials engineering gains share; others see continued layer additions tied to AI workload demands.
High-NA adoption timing and layer count per node remain key unknowns; delays shift value to later years.
China export controls and tariff regimes may alter near-term mix and margins.
Assumptions for scenarios (illustrative, mid-cycle framing)
WACC: 8% (sensitivity ±1.5pp).
Long-run revenue growth: Base 8%, Bear 4%, Bull 10% (2026–2030 CAGR after anchoring 2025 on guidance).
FCF margin: Base 25%, Bear 20%, Bull 28% (reflecting mix and working-capital cadence).
Terminal growth: Base 3%, Bear 2%, Bull 4%.
2025 revenue anchor: midpoint of company’s 2025 net sales outlook range (€30–35B) [ASML Q1/Q2 2025 releases].
Installed base share of sales: trending mid/high-20s% over cycle in Base (higher in Bull), with above-corporate-average margins.
Three-scenario summary table (illustrative, not a price target)
Bear: EUV units underwhelm; services grow slower; FCF margin ~20%; WACC 9.5%; terminal 2%.
Base: EUV steady; services mix rises; FCF margin ~25%; WACC 8%; terminal 3%.
Bull: EUV + High-NA layers expand; services mix higher; FCF margin ~28%; WACC 7%; terminal 4%.

Sensitivity
Tornado: EV most sensitive to FCF margin, WACC, and EUV units/ASP; secondarily to terminal growth and installed-base mix.
Capital allocation scorecard (2015–2025)
Dividends + buybacks consistent. 2022–2025 buyback authorization up to €12B; Q2’25 repurchases ~€1.4B; routine weekly buyback disclosures (as of July 2025) ASML Q2 2025, ASML buyback updates.
Per-share framing: net reduction in share count over time; up to 2.0M shares earmarked to cover employee plans, remainder canceled ASML Share Buyback page.
How to do this yourself
Data to gather
Company: 2024 Annual Report (US GAAP and IFRS versions), quarterly press releases (Q1/Q2 2025), buyback updates ASML Annual Reports, ASML Q2 2025, Share Buyback.
Industry: SEMI equipment forecasts (2025–2026), Yole Group 2030 view Bits&Chips on SEMI, Yole Group.
Financials: Build 10-year history of revenue, gross/operating margin, capex, working capital, SBC, buybacks, dividends.
Per-share: Shares outstanding, EPS, FCF/share.
Exact checks/calculations
ROIC: NOPAT / invested capital; compute over multiple years to get a range.
FCF conversion: FCF / net income; also FCF margin = FCF / revenue.
Installed base mix: service + field options + upgrades share and margin (proxy if needed).
Mid-cycle margin: normalize to 50–52% gross margin; 26–32% EBIT as a cross-check (assumption if not disclosed).
WACC: use market cap, net cash/debt, beta range, current rates; test 7–9.5%.
Decision rules and thresholds
Prefer ROIC – WACC > 5% sustained; FCF conversion > 80% through-cycle.
Favor an installed base mix rising toward high-20s%+ of revenue.
Margin of safety: require Base–Bear valuation downside within tolerable band before acting.
Avoid paying multiples that imply Bull scenario as the only way to win.
Pitfalls and false positives
Peak bookings extrapolation: Bookings can be pulled forward or pushed out; scenario around WFE base rates instead.
Overconfidence in High-NA timing: Value depends on adoption depth and productivity realized in HVM.
Export controls and tariffs: Mix and margins can shift quickly; build a “policy shock” hair-cut.
Ignoring working capital: Customer prepayments/advances can mask cyclicality; watch CCC trends.
Per-share blind spots: Buybacks that only offset SBC are not accretive.
Checklist / one-pager
ROIC – WACC > 5% (multi-year average)
FCF conversion > 80% through-cycle
Installed base mix rising; stable gross margin band ~50–52% mid-cycle
Scenario base anchored to company guidance with realistic fades
High-NA contribution delayed by 1–2 years in downside
Sensitivity run on EUV units/ASP and service mix
Valuation cross-check vs 5–10y EV/EBIT and EV/FCF medians
Per-share growth: net reduction in share count; dividends growing prudently
Glossary
EUV: Extreme ultraviolet lithography for leading-edge patterning.
High-NA: Higher numerical aperture EUV enabling tighter features and fewer exposures.
WFE: Wafer fab equipment; the capex buyers use to build or upgrade fabs.
Installed base management: Services, field options, parts, upgrades on deployed systems.
ROIC: Return on invested capital; value-creation yardstick vs WACC.
FCF conversion: Free cash flow vs net income or revenue; cash quality.
Litho intensity: Exposure steps per wafer; rises with node complexity.
ASP: Average selling price per system or tool family.
Further reading
ASML Annual Reports hub (US GAAP and IFRS versions; 2024 report published Mar 5, 2025)
https://www.asml.com/investors/annual-reportASML Q2 2025 results press release (bookings, margins, High-NA shipment)
https://www.asml.com/news/press-releases/2025/q2-2025-financial-resultsYole Group WFE 2030 outlook (press release, July 29, 2025)
https://www.yolegroup.com/press-release/wafer-fab-equipment-wfe-market-to-hit-184-billion-by-2030-for-equipment-and-services-driven-by-specialized-segment-growth-and-global-manufacturing-shifts/Bits&Chips summary of SEMI mid-year forecast (July 31, 2025)
https://bits-chips.com/article/semi-forecasts-7-4-percent-uptick-in-equipment-sales/ASML Share Buyback overview (program details and weekly updates)
https://www.asml.com/investors/why-invest-in-asml/share-buyback
References
ASML Q2 2025 results press release: net sales ~€7.7B, gross margin 53.7%, bookings €5.5B (of which €2.3B EUV); 2025 net sales growth ~15% and gross margin ~52%; first EXE:5200B High-NA system shipped — as of July 16, 2025. ASML
ASML Annual Reports hub; 2024 Annual Report published March 5, 2025, with US GAAP and IFRS versions — as of Mar 5, 2025. ASML
ASML Share Buyback program (2022–2025 up to €12B; up to 2.0M shares for employee plans; ongoing weekly updates) — as of 2025. ASML
SEMI forecast: 2025 global semiconductor equipment sales to ~$125.5B; WFE to ~$110.8B; 2026 growth expected — as summarized by Bits&Chips — as of July 31, 2025. Bits&Chips
Yole Group: WFE (equipment + services) to ~$184B by 2030; patterning remains largest segment — as of July 29, 2025. Yole Group
Disclaimer
Educational content, not investment advice.