
The Dividend Ladder: From Challengers to Kings, Understanding Every Level of Dividend Growth

Most investors have heard of the Dividend Aristocrats. Fewer know that there are five distinct tiers of dividend growth companies, each with different requirements, risk profiles, and implications for your portfolio.
Understanding this hierarchy matters because it gives you a built-in quality filter. A company that has raised its dividend every year for 50 consecutive years has survived recessions, wars, oil crises, financial meltdowns, and a pandemic. That track record tells you something powerful about the underlying business.
In today’s post, we will learn:
The Five Tiers of Dividend Growth Companies
How Each Tier Is Defined (and Who Maintains the Lists)
Real Company Examples at Every Level
What the Streak Tells You (and What It Doesn’t)
How to Use the Dividend Ladder in Your Investing Process
Common Mistakes Investors Make with Dividend Growth Lists
Okay, let’s dive in and learn more about the different levels of dividend payers.
The Five Tiers of Dividend Growth Companies
Think of dividend growth companies as a ladder. The higher a company climbs, the longer its track record of raising its payout to shareholders year after year. Each rung has a name, a minimum streak requirement, and sometimes additional qualifications.
Here is the complete hierarchy, from bottom to top:
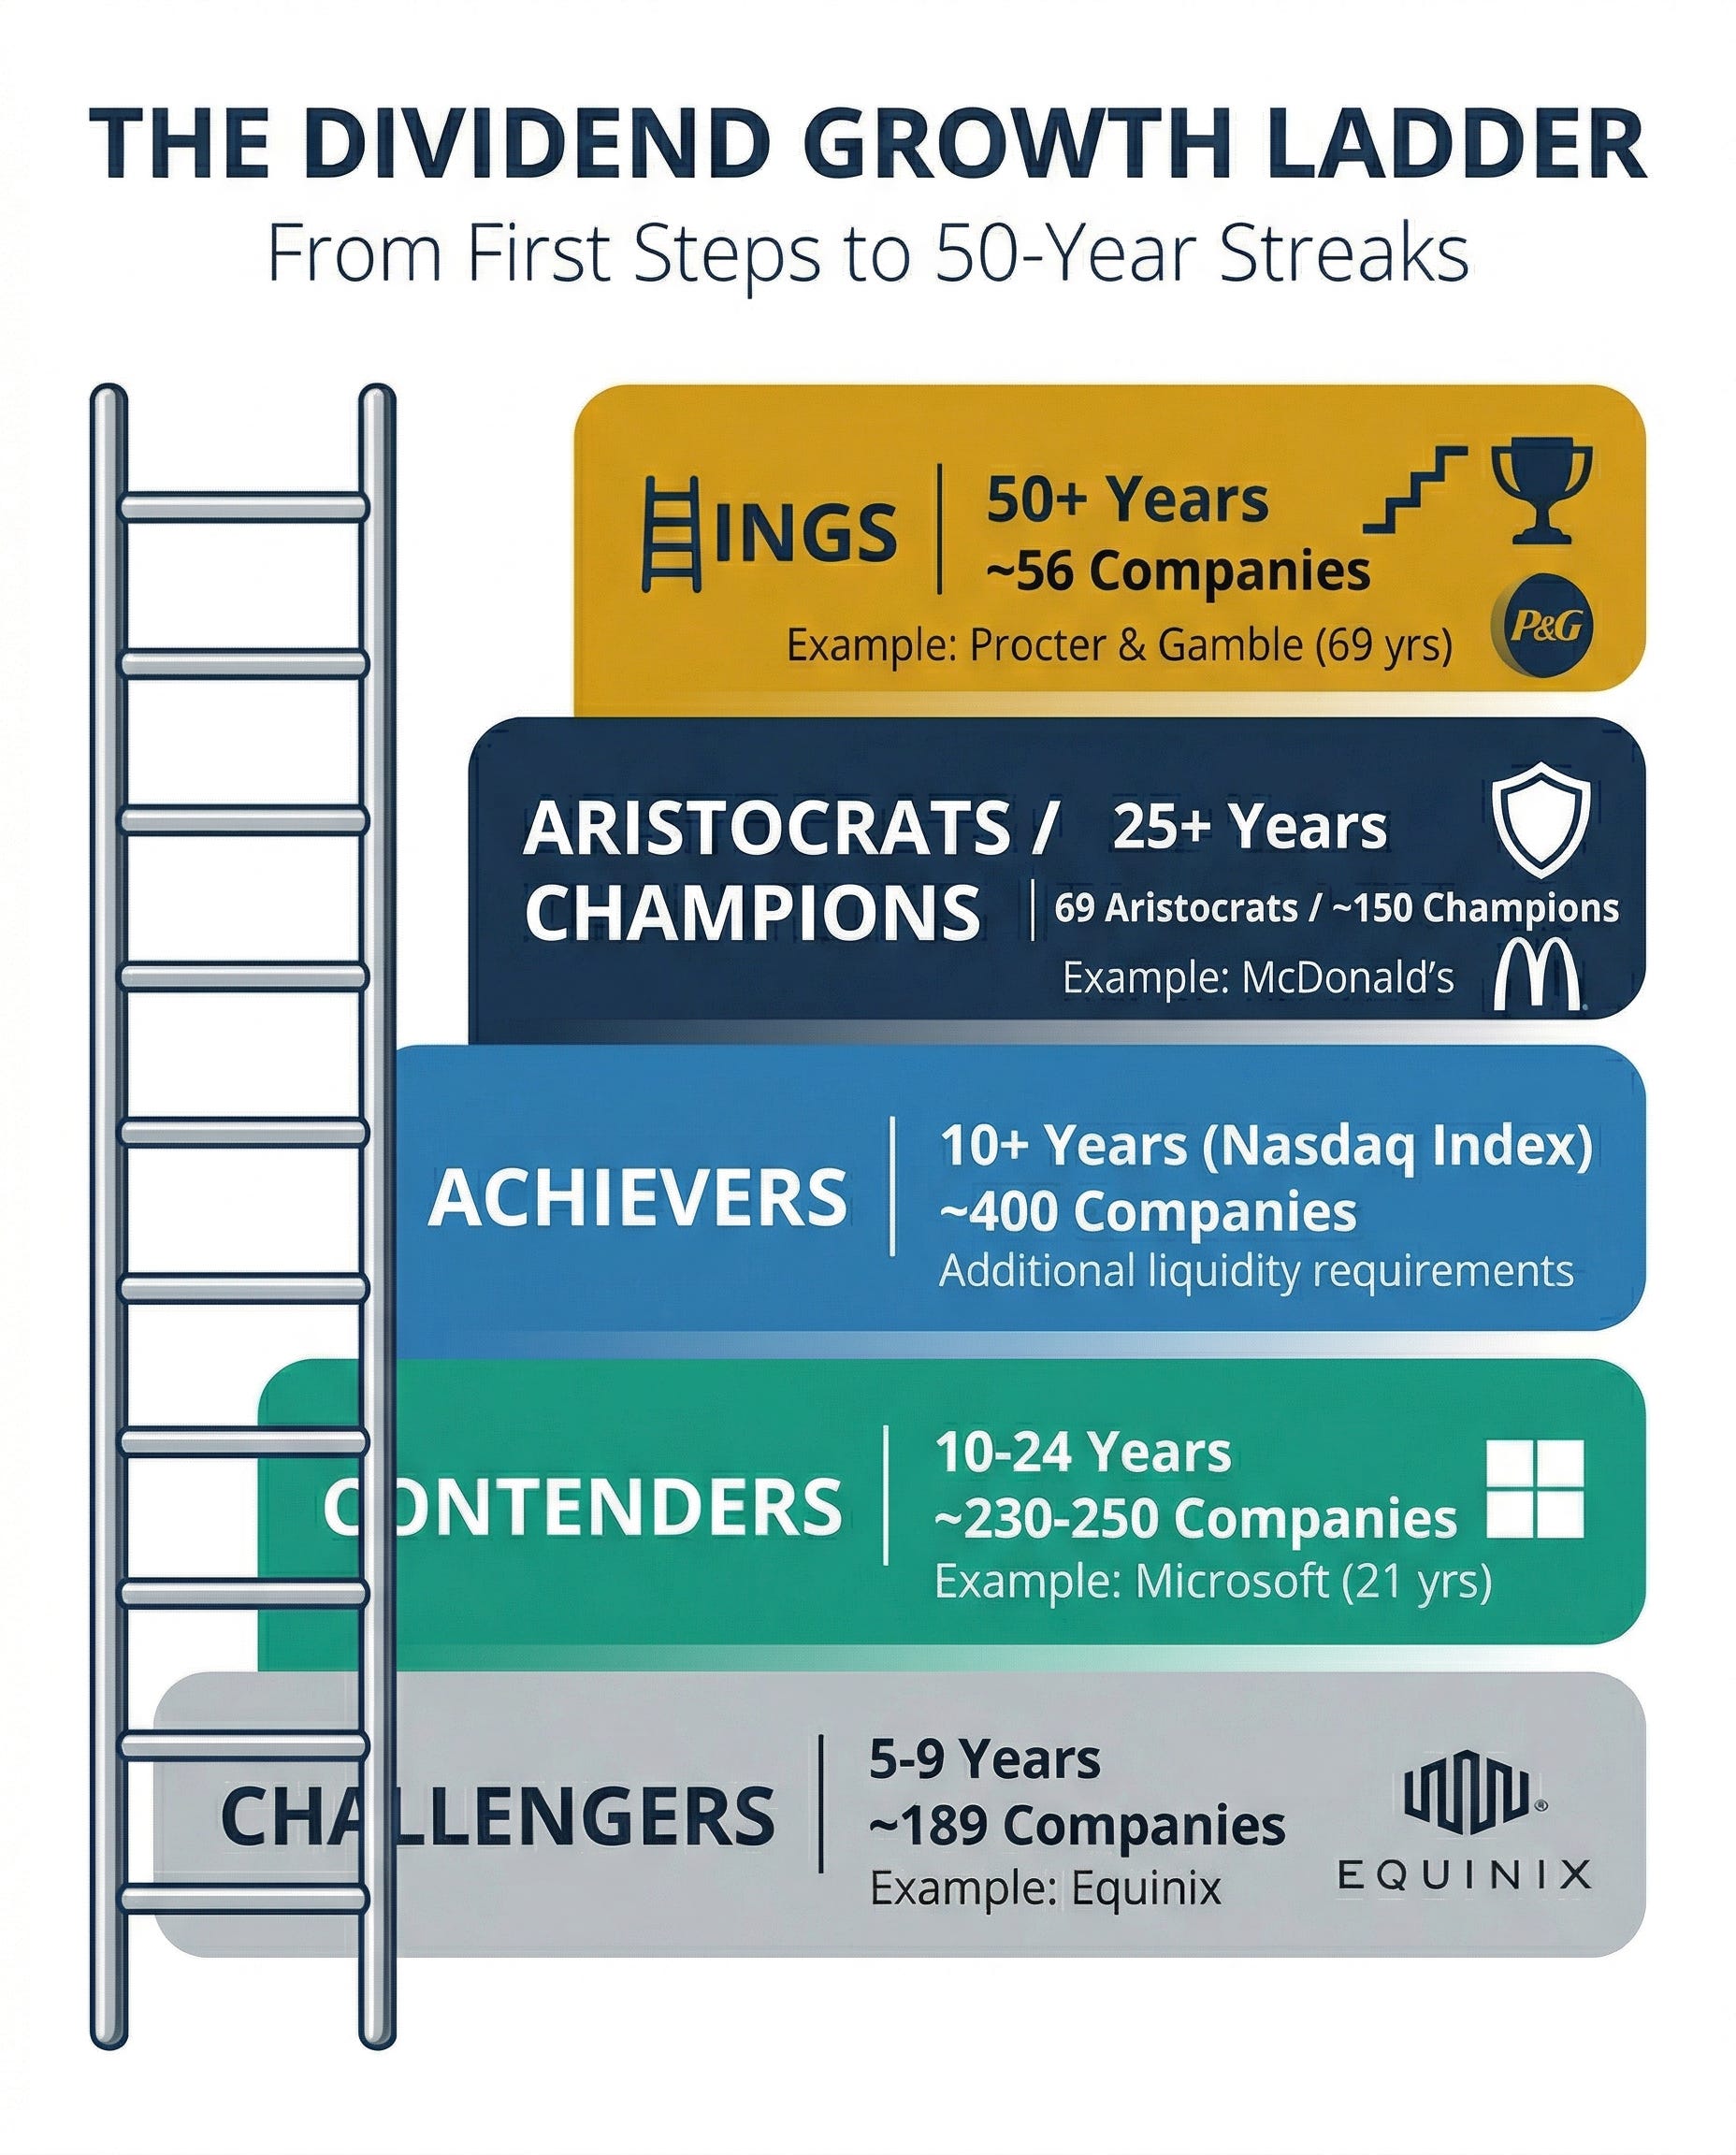
Dividend Challengers require 5 to 9 consecutive years of annual dividend increases. This is the entry point. About 189 companies currently qualify.
Dividend Contenders require 10 to 24 consecutive years of annual dividend increases. These companies have proven they can grow through at least one economic cycle. Roughly 230 to 250 companies sit in this tier.
Dividend Achievers also require at least 10 consecutive years of annual dividend increases, but this is a trademarked index maintained by Nasdaq with additional liquidity requirements (a three-month average daily trading volume of at least $1 million and a listing on the NYSE or Nasdaq). About 400 companies qualify. Think of Achievers as the Contenders list with broader inclusion criteria.
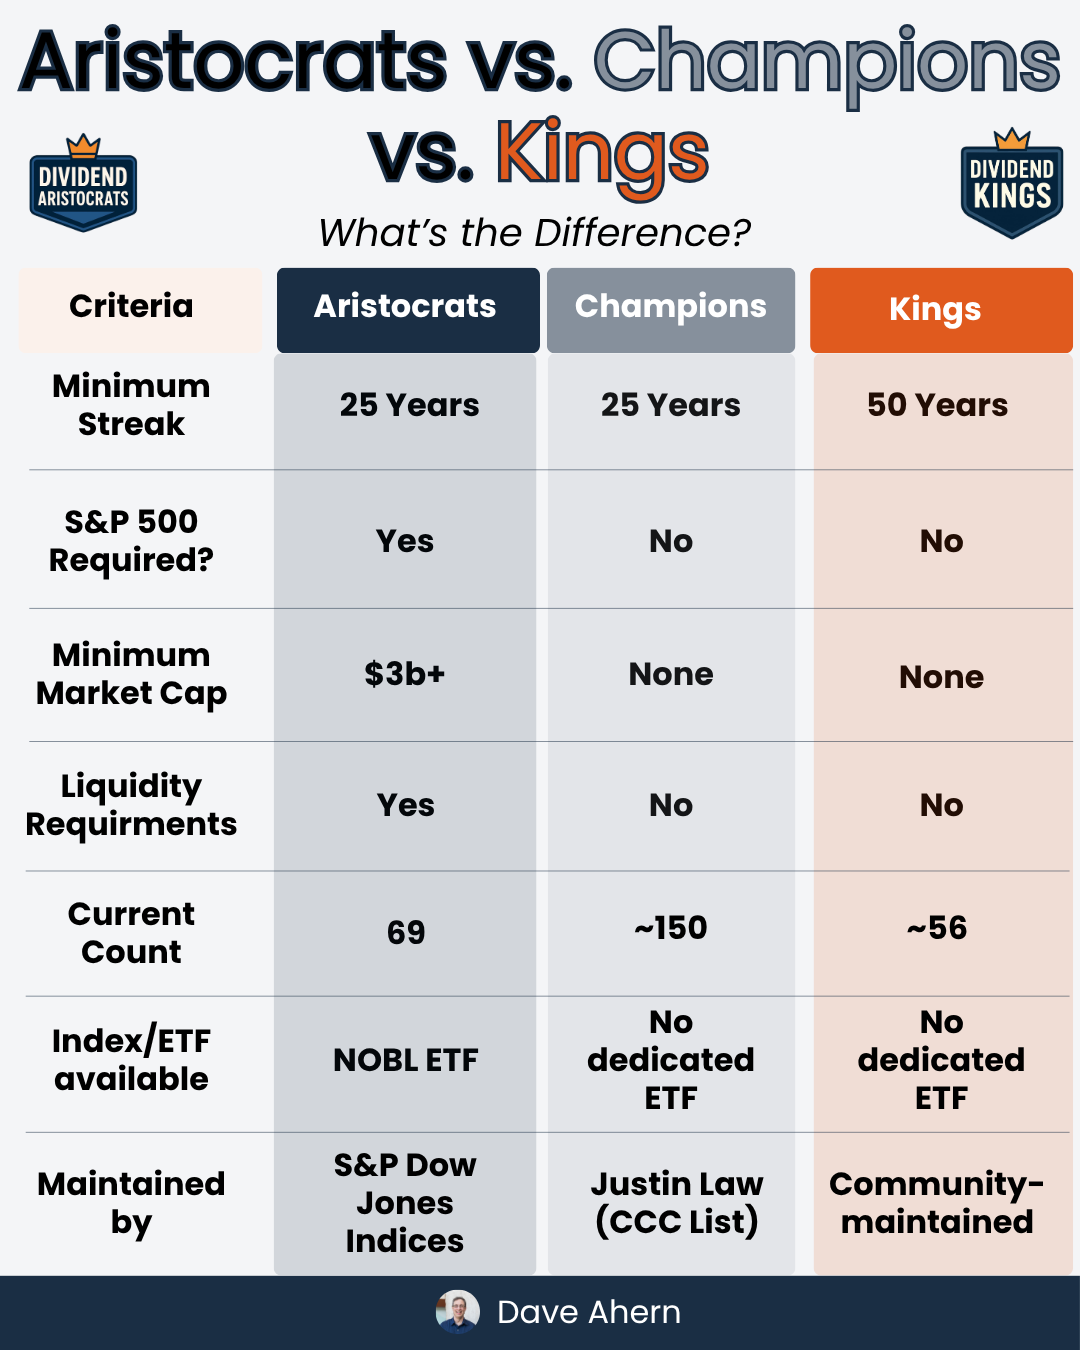
Dividend Aristocrats require at least 25 consecutive years of annual dividend increases. But the Aristocrats come with a critical additional filter: the company must be a member of the S&P 500 and meet minimum market capitalization (at least $3 billion) and liquidity requirements. There are currently 69 Dividend Aristocrats, a record high for the index.
Dividend Champions also require 25 or more consecutive years of dividend increases, but they drop the S&P 500 membership requirement. Any U.S. company that hits 25 years qualifies. This makes the Champions list significantly larger at roughly 150 companies. All Dividend Aristocrats are Dividend Champions, but many Champions are not Aristocrats because they are too small or not in the S&P 500.
Dividend Kings sit at the top. They require 50 or more consecutive years of annual dividend increases. No other qualifications. Currently, roughly 56 companies hold this status.
A quick note on terminology. You will sometimes see the Challengers, Contenders, and Champions grouped together as the “CCC list.” This list was originally created by the late David Fish, a pioneer in dividend growth investing, and is now maintained by Justin Law, who updates it monthly. The CCC list is one of the most comprehensive resources for dividend growth investors.
How Each Tier Differs (and Why It Matters)
The differences between these tiers go beyond the number on the streak counter. Let’s break down what separates them.
The Challengers (5 to 9 Years)
Five years is not an especially high bar, but it does separate companies that are actively growing their dividends from those that have kept payouts flat or inconsistent. Challengers tend to be younger dividend payers or companies that recently began prioritizing shareholder returns.
Apple (AAPL) is a perfect example. The company reinstated its dividend in 2012 after a 17-year hiatus and has increased it every year since, giving it roughly 14 consecutive years of increases. That streak places Apple in the Contender tier today, but it sat in the Challenger tier for years after restarting its dividend program.
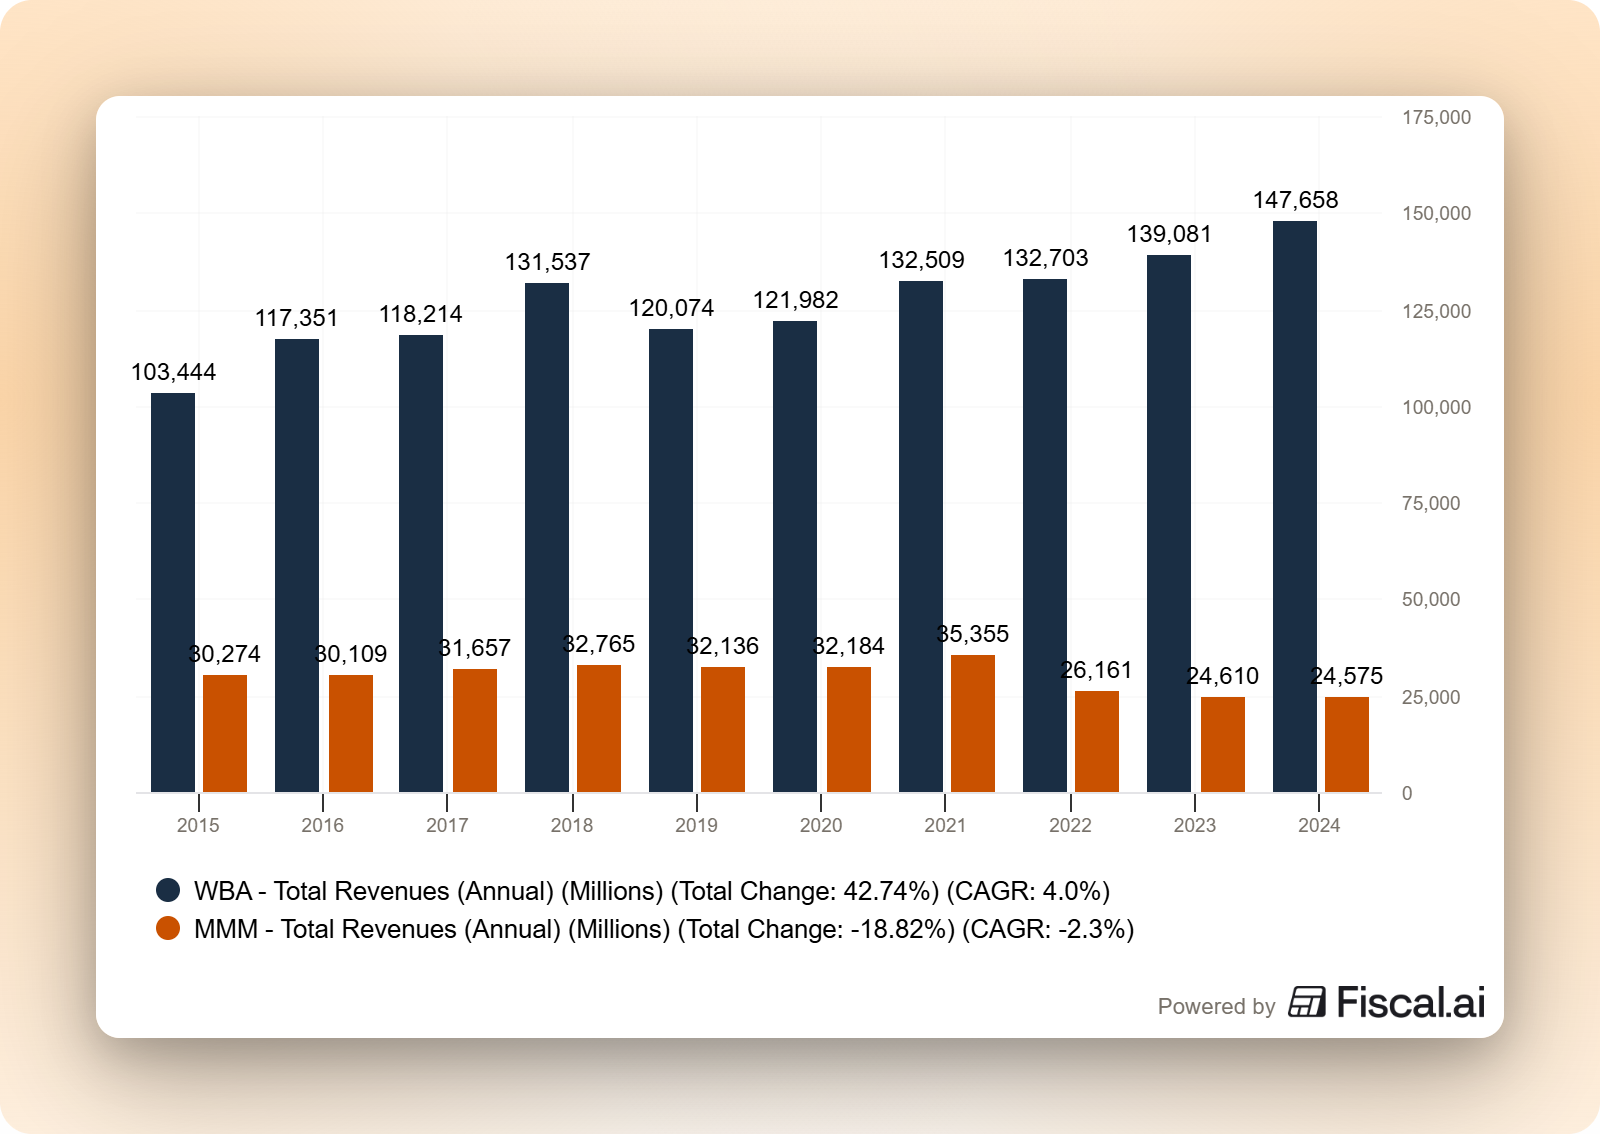
Apple’s case illustrates something important. A company can be one of the most profitable businesses on earth and still be a relative newcomer to the dividend growth ladder. Apple generated $111.5 billion in operating cash flow in fiscal 2025, yet its current yield sits around 0.4%. The company returns far more capital through buybacks ($90.7 billion in fiscal 2025) than dividends ($15.4 billion). For Apple, the dividend is a small piece of a much larger capital return strategy.
The Challenger tier is where you find tomorrow’s Aristocrats. Some will make the climb. Others will stumble and reset to zero.
The Contenders and Achievers (10 to 24 Years)
Crossing the 10-year threshold is meaningful. It means the company has navigated at least one full economic cycle while continuing to raise its payout. That requires real earnings durability, not just good intentions.
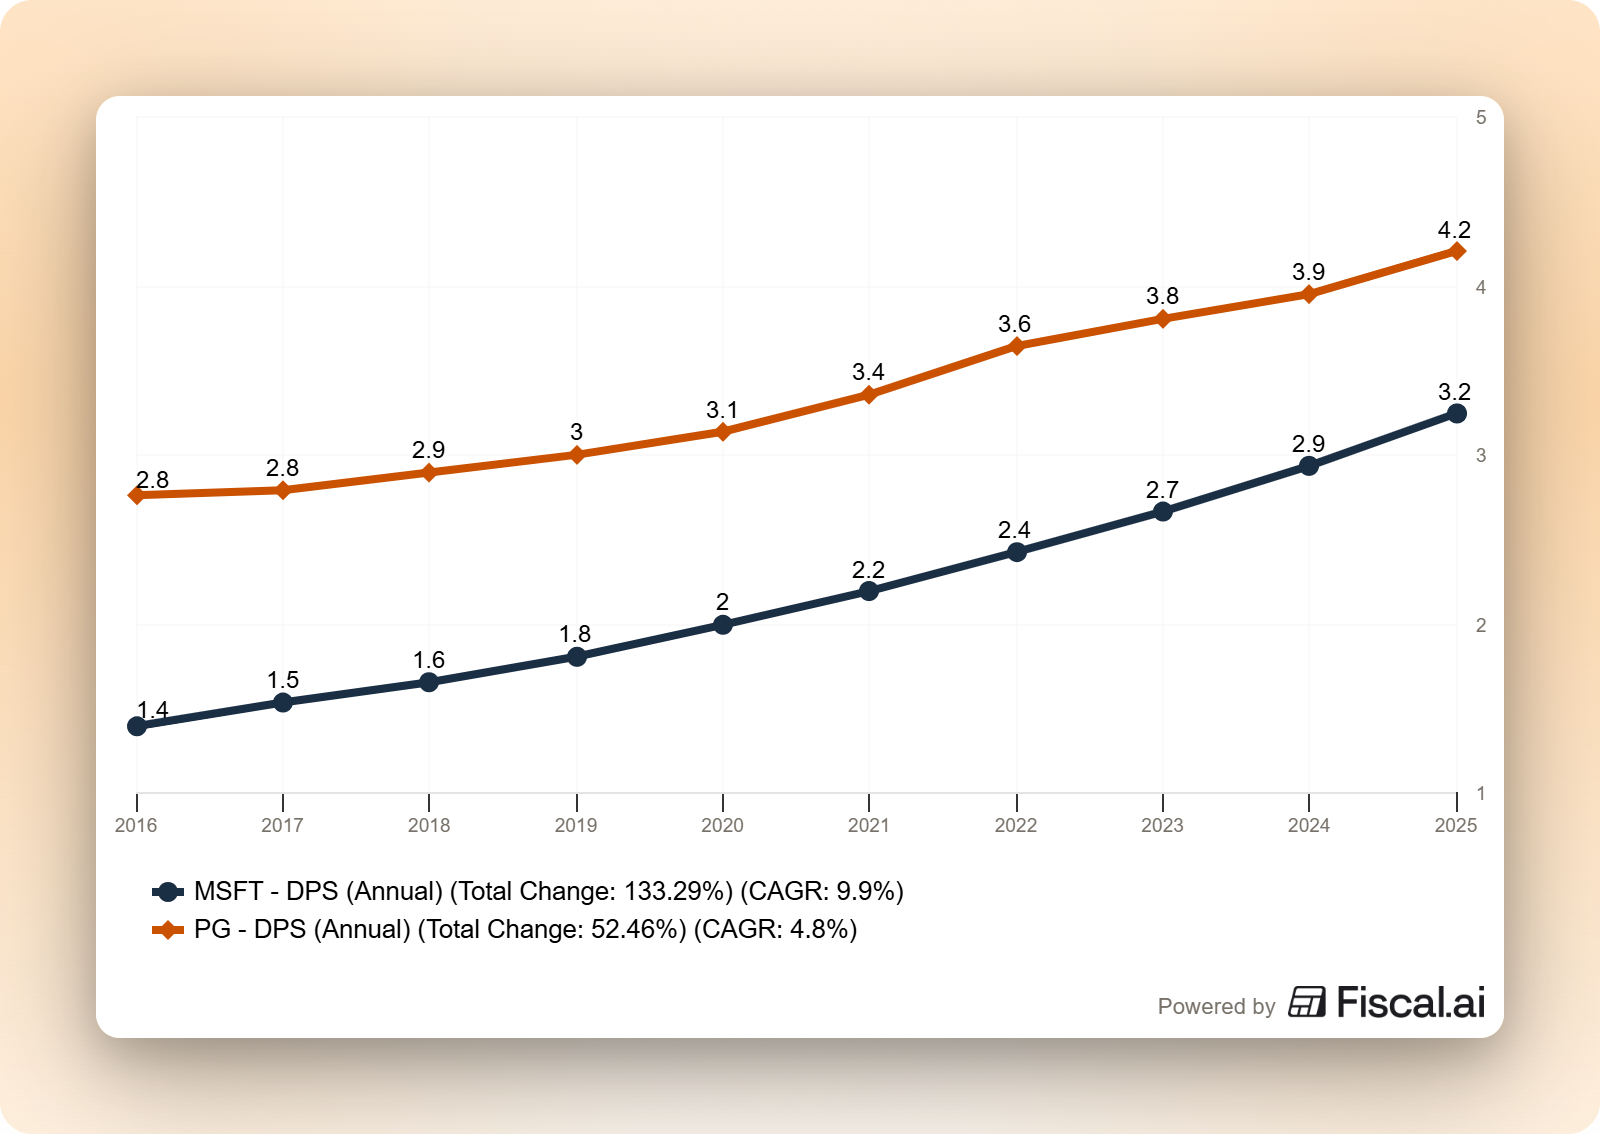
Microsoft (MSFT) sits here with 21 consecutive years of dividend increases. Microsoft raised its quarterly dividend 10% to $0.91 per share in 2025, continuing a streak that stretches back to the mid-2000s. What makes Microsoft’s presence in this tier notable is context: 21 years of consecutive increases is a rare feat for a technology company. Most tech firms either don’t pay dividends at all or haven’t been paying them long enough to qualify for the higher tiers.
The Contender tier is a proving ground. Companies here have demonstrated commitment, but they haven’t yet been tested by the full range of economic environments that a 25 or 50-year streak demands.
The Aristocrats and Champions (25+ Years)
This is where things get serious. Twenty-five consecutive years of dividend increases mean a company has grown its payout through multiple recessions, interest rate cycles, and market crashes.
The key distinction between Aristocrats and Champions is the S&P 500 filter. The Aristocrats index, maintained by S&P Dow Jones Indices, requires membership in the S&P 500, along with minimum size and liquidity thresholds. This means smaller companies with outstanding 25-year streaks get excluded.
For example, the Champions list includes companies like MGE Energy (MGEE), a regulated utility in Wisconsin, and Sonoco Products (SON), a packaging company. Both have excellent dividend growth records, but neither sits in the Aristocrats index because they don’t meet the S&P 500 criteria.
The Aristocrats index has historically outperformed the S&P 500 by approximately 1% to 2% annually over long periods, with notably lower volatility during bear markets. In 2008, the Dividend Aristocrats index declined about 22%, while the broader S&P 500 fell 37%. That downside protection is part of what makes the Aristocrats list valuable beyond just a screening tool.
The 2026 Aristocrats list includes familiar names: Procter & Gamble, Coca-Cola, Johnson & Johnson, Abbott Laboratories, McDonald’s, and others. These are generally large, stable businesses in sectors like consumer staples, healthcare, industrials, and utilities. You will not find many technology or communications companies on the list. Only two Aristocrats (IBM and Roper Technologies) are classified as tech stocks.
This framework works. But running it from memory every time you evaluate a stock is slow and easy to get wrong. Paid members get the tools that turn what you just learned into a repeatable 10-minute process.
The Dividend Safety Spreadsheet. The Reverse DCF Calculator. The ROIC model. They do the heavy lifting so you can spend your time thinking about the business, not wrestling with formulas.
The Dividend Kings (50+ Years)
The summit of the dividend ladder. To earn the title of Dividend King, a company must have raised its dividend every single year for at least half a century. Think about what that means. Fifty years encompasses the stagflation of the 1970s, double-digit interest rates in the 1980s, the dot-com bust, the 2008 financial crisis, near-zero interest rates for a decade, and a global pandemic. A company that grew its dividend through all of that has proven something fundamental about the durability of its business model.
There are currently around 56 Dividend Kings. The longest streak belongs to American States Water (AWR) at approximately 70 consecutive years. Other notable Kings include Procter & Gamble (PG) with 69 consecutive years, Emerson Electric (EMR) with 69 years, and Coca-Cola (KO) with 64 consecutive years.
According to P&G’s own investor relations filings, the company has been paying a dividend for 135 consecutive years since its incorporation in 1890 and has increased its dividend for 69 consecutive years. In April 2025, P&G announced a 5% dividend increase and returned over $16 billion to shareholders through dividends and share repurchases in fiscal year 2025.
Coca-Cola approved its 64th consecutive annual dividend increase in February 2026, raising the quarterly payment from $0.51 to a higher amount. The company generated $11.4 billion in adjusted free cash flow in 2025, providing strong financial backing for the dividend.
The sector composition of the Dividend Kings tells an important story. You will find the list concentrated in consumer staples, utilities, industrials, and healthcare. No Dividend Kings come from the Information Technology or Communications sectors. This makes sense. The characteristics that enable a 50-year streak (stable demand, pricing power, modest capital requirements, recurring revenue) are more commonly found in “boring” businesses than in fast-changing technology markets.
The Dividend Kings have delivered steady annual dividend growth of around 5% over the last decade. Their total returns have generally matched the S&P 500 over long periods but with lower volatility. In recent years, however, the Kings have lagged the tech-heavy S&P 500 as investors favored growth stocks and AI-related companies.
What the Streak Tells You (and What It Doesn’t)
A long dividend growth streak is a powerful signal, but it is not the whole picture. Let’s separate what the streak genuinely indicates from what it cannot tell you.
What a long streak signals:
A company that has raised its dividend for 25 or 50 consecutive years almost certainly possesses durable competitive advantages. You do not maintain that kind of consistency without a business model that generates reliable cash flows across different economic environments. The streak is a proxy for quality, not a guarantee of it, but a strong indicator.
It also signals disciplined capital allocation. Management teams at these companies prioritize returning cash to shareholders and protecting the dividend even during downturns. There is tremendous institutional pressure to keep the streak alive. No CEO wants to be the one who breaks a 50-year record.
What the streak does not tell you:
First, the streak says nothing about valuation. A Dividend King trading at 35 times earnings may be a poor investment at that price, regardless of its 60-year streak. The track record is about quality, not price. As Buffett says, "Price is what you pay; value is what you get."
Second, the streak does not guarantee future dividend safety. The streak is backward-looking. A company can have a perfect 49-year record and cut its dividend in year 50 if the underlying business deteriorates.
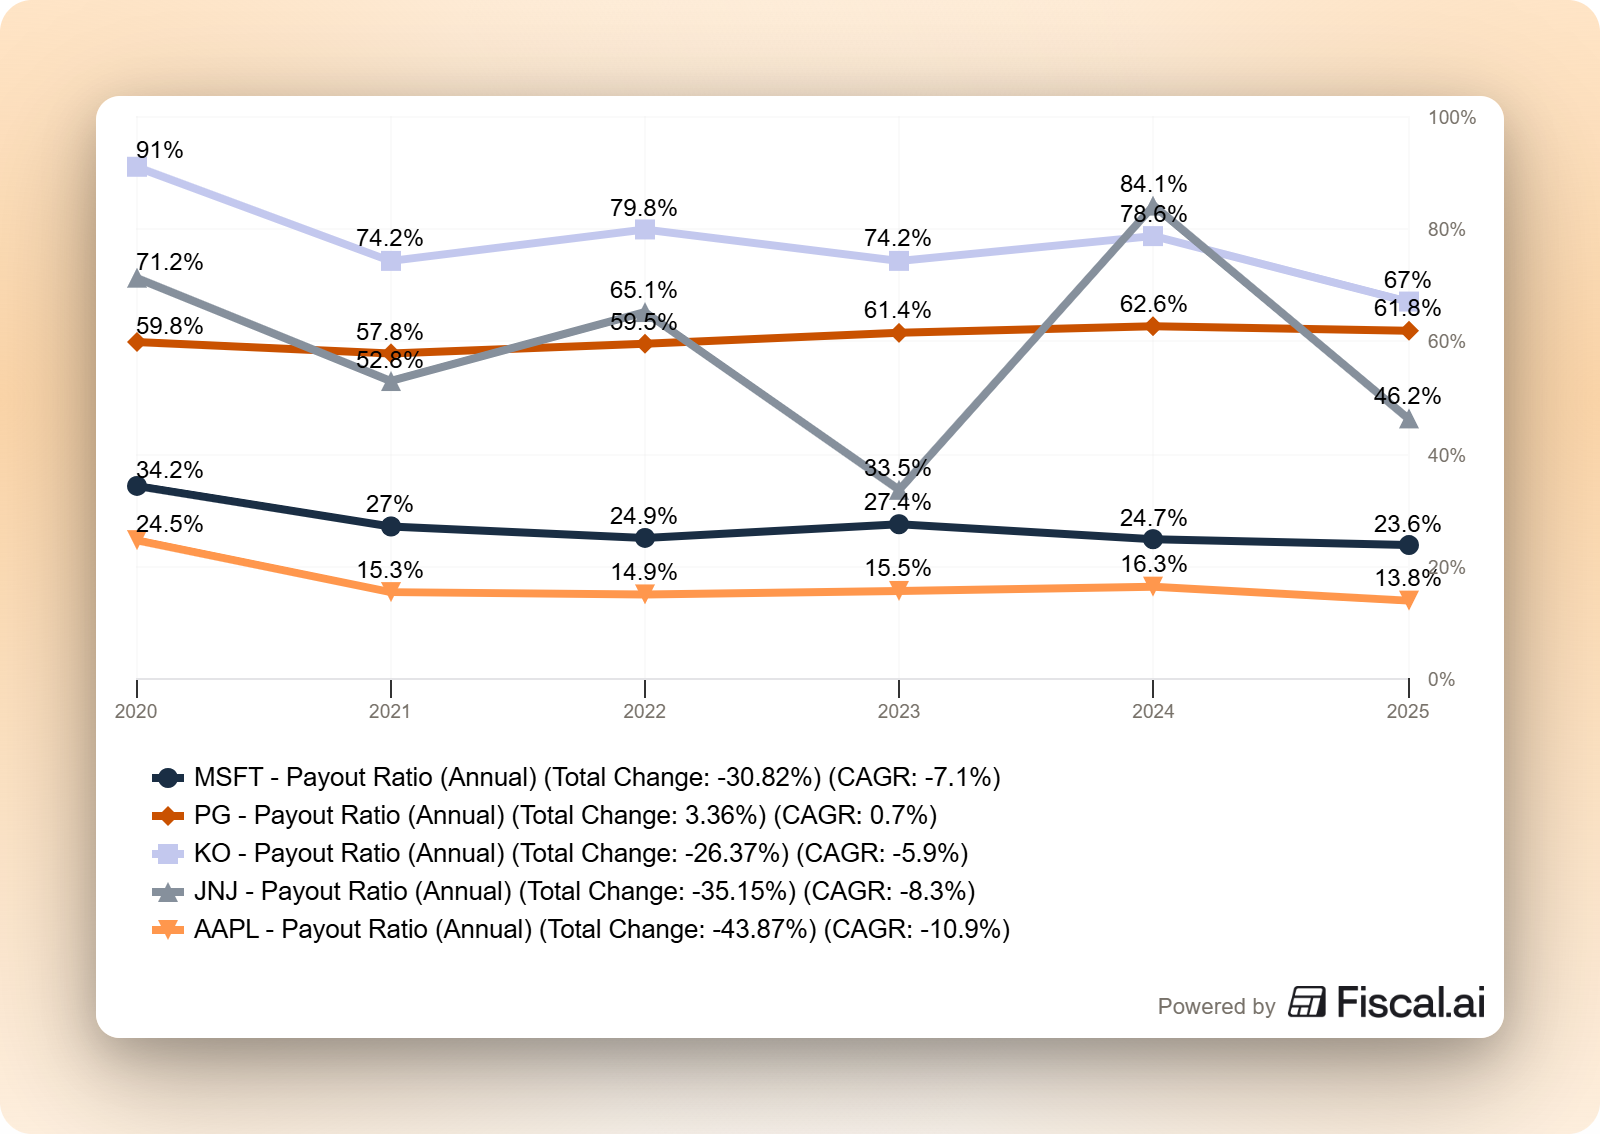
Third, a longer streak does not automatically mean a better investment. A Contender growing its dividend at 15% annually with a 40% payout ratio may deliver better long-term returns than a King growing at 3% annually with an 80% payout ratio. Growth rate and payout sustainability matter alongside the streak length.
Cautionary Tales: When Companies Fall Off the Ladder
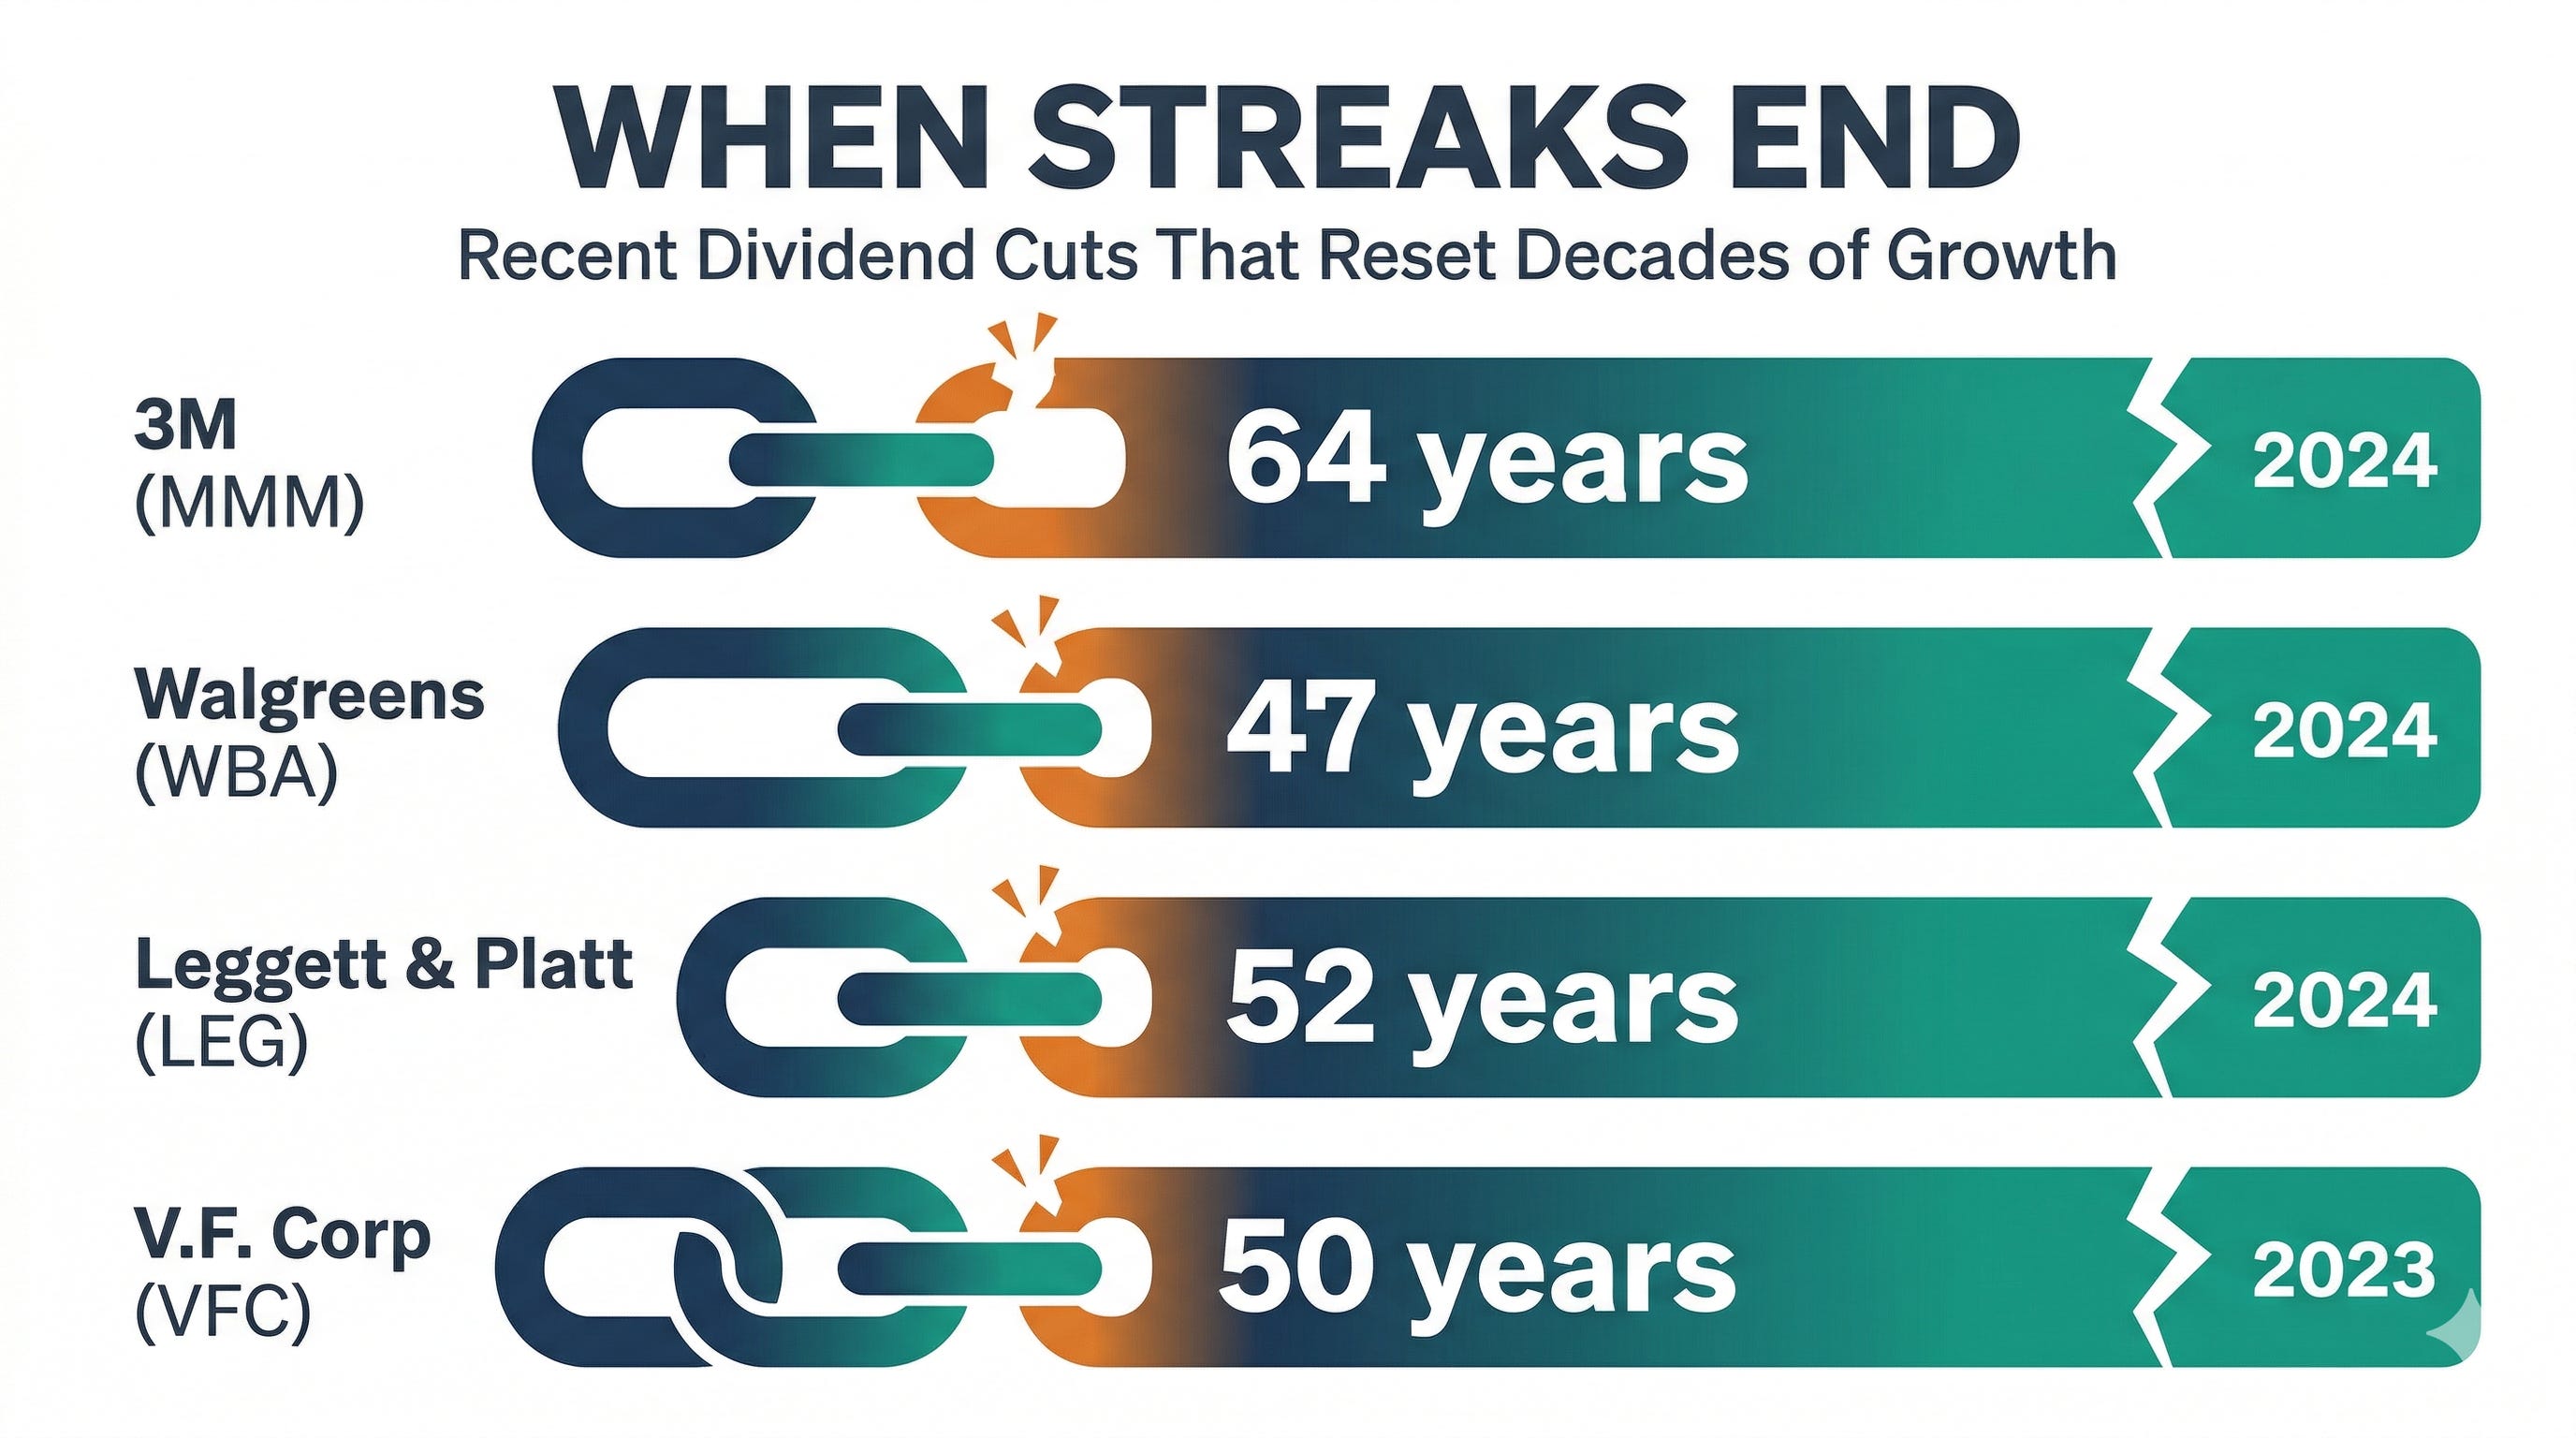
The year 2024 was a brutal one for the Dividend Kings list. Three companies were removed: 3M (MMM), Walgreens Boots Alliance (WBA), and Leggett & Platt (LEG). All three cut their dividends, instantly resetting decades of consecutive increases to zero.
V.F. Corporation (VFC), the parent of The North Face and Timberland, provides perhaps the most dramatic cautionary tale. V.F. Corp achieved Dividend King status in 2022 after 50 years of consecutive increases. Two months later, in February 2023, the company cut its dividend. The fastest fall from King to nothing in the list’s history.
These examples remind us that the streak is earned year by year. Past performance, even 50 years of it, does not guarantee future results. That is why the streak should be one input in your analysis, not the only one.
When evaluating dividend growth companies, always pair the streak with fundamental analysis. Check the payout ratio relative to earnings and free cash flow. Look at the balance sheet. Understand whether the company’s competitive position is strengthening or eroding. The streak tells you where the company has been. Your job as an investor is to assess where it is going.
How to Use the Dividend Ladder in Your Investing Process
Here is a practical framework for incorporating the dividend growth hierarchy into your research.
Step 1: Use the tiers as a starting filter, not an ending point.
The CCC list and the Aristocrats index are excellent starting points for finding quality dividend growth companies. They save you from sifting through thousands of stocks by narrowing the field to companies with proven track records. But don’t stop at the list. Every company still requires individual analysis.
Step 2: Match the tier to your investing goals.
If you are building a portfolio focused on current income and stability, the Aristocrats and Kings offer the longest track records and typically the highest yields in the dividend growth universe. If you are younger and focused on long-term wealth building through dividend growth, the Contenders and even Challengers may offer faster dividend growth rates, even if the starting yields are lower. A company like Microsoft, growing its dividend at 10% per year, will double its payout roughly every seven years.
Step 3: Look beyond the streak at the fundamentals.
For every company on the ladder, ask these questions:
Is the payout ratio sustainable? For most non-REIT companies, a payout ratio below 60% of earnings (or free cash flow) provides a comfortable cushion. Above 80% starts to get stretched.
Is the dividend growth rate accelerating or slowing? A company that has grown its dividend at 8% annually for the last five years but at only 2% for the last two years may be signaling that growth is stalling.
What does the balance sheet look like? Companies that take on excessive debt to maintain their dividend streak are playing a dangerous game. Always check the debt-to-equity ratio and interest coverage.
Is the underlying business growing? Revenue and earnings growth ultimately fund dividend growth. If the business is in structural decline, the streak will eventually end.
Step 4: Diversify across tiers.
A well-constructed dividend growth portfolio might include Kings for stability and reliable income, Aristocrats and Champions for the balance of quality and growth, and select Contenders or Challengers that you believe have the business quality to climb the ladder over time. This gives you a blend of current income, dividend growth, and potential for capital appreciation.
Common Mistakes with Dividend Growth Lists
Chasing the longest streak without checking the fundamentals. A 50-year streak means nothing if the company is drowning in debt or losing market share. 3M had 64 years of consecutive increases before it cut. The streak looked impressive right up until the moment it didn’t.
Ignoring the Contenders and Challengers. Many investors fixate on the Aristocrats and Kings while overlooking companies in the earlier stages of their dividend growth journey. Some of the best future dividend growth investments are Contenders that haven’t yet reached 25 years.
Confusing Aristocrats with Champions. Because the Aristocrats require membership in the S&P 500, smaller companies with longer streaks are excluded. If you only screen the Aristocrats list, you miss roughly 80 additional companies with 25-plus-year streaks that sit on the Champions list.
Assuming the streak will continue automatically. Every year, companies fall off these lists. The pressure to maintain the streak is real, but it does not override financial reality. Always verify that the company can afford its next dividend increase.
Using the tier as your only valuation tool. Being a Dividend King does not make a stock a buy at any price. Valuation still matters. Use the tier to identify quality, then use your valuation tools (DCF, P/E, dividend yield relative to history) to determine the right price.
Investor Takeaway
The dividend growth hierarchy gives you a structured way to think about the quality and reliability of dividend-paying companies. From Challengers just beginning their journey to Kings that have delivered half a century of consecutive increases, each tier tells you something about the durability of the underlying business.
But the tier is a starting point, not a finish line. The real work begins when you dig into the financials: checking payout ratios, evaluating balance sheet strength, assessing competitive position, and determining whether the price is right.
Use the ladder to narrow your search. Use fundamental analysis to make your decisions.
That is going to wrap up our discussion for today.
As always, thank you for taking the time to read this post, and I hope you find something of value on your investing journey.
If I can further assist, please don’t hesitate to reach out.
Until next time, take care and be safe out there,
Dave
I’ve been investing for 13 years and creating content about it for 9. Every tool inside the paid membership exists because I needed it for my own portfolio first.
The Dividend Safety Spreadsheet? I built it because I was tired of manually checking payout ratios across 20 stocks. The calculators? Same thing. I wanted faster, cleaner analysis without opening a dozen browser tabs.
Paid members get access to all of it, plus the 180+ infographic library and hands-on workshops where I walk through real analysis in real time.
If you’re reading this newsletter every week, you’re already doing the work. The toolkit just makes the work faster.