
The Company's Report Card: Meet the 3 Financial Statements

As an investor, it's easy to get caught up in the daily noise. The stock price is up! It's down! A news headline says this, an analyst on TV says that.
But that's like trying to judge a student by only listening to the gossip in the hallway.
If you want to really understand what's going on—if you want to get an edge—you have to look at their report card.
For a public company, this "report card" comes in the form of three simple documents. They are the "Big Three" financial statements. Understanding what they are and what they do is your first step toward becoming a truly confident investor.
Let's meet them.
1. The Income Statement: The Semester Grades
The question it answers: "Did the company make or lose money over a period of time?"
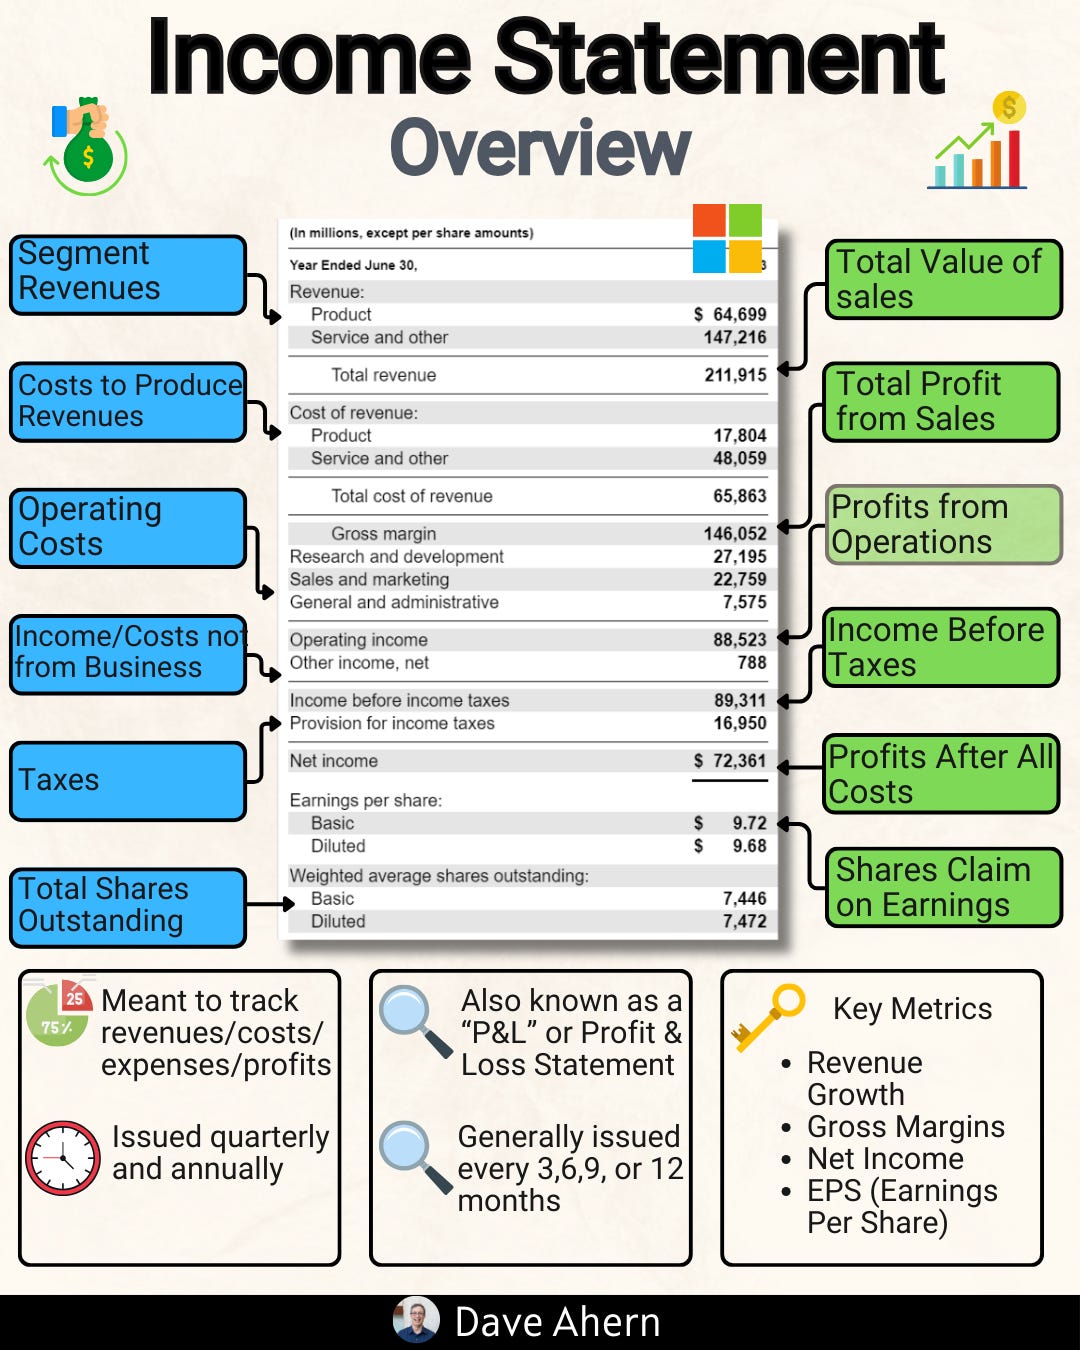
Think of the Income Statement as the grades for the most recent semester (or quarter, or year). It shows performance over a specific period. It starts with all the money the company brought in and then subtracts all the costs of doing business until you're left with the famous "bottom line."
It starts with Revenue: This is the top line, the total sales. It's like the student's perfect score before any mistakes are counted.
It subtracts Expenses: These are all the costs. The cost of making the product, paying employees, marketing, rent, etc.
It ends with Net Income: This is the profit. The final grade. After all the costs are paid, is there anything left over for the owners?
When you look at an Income Statement, you're finding out if the business, at its core, is profitable.
2. The Balance Sheet: The Picture Day Snapshot
The question it answers: "What is the company's financial health at a single moment in time?"
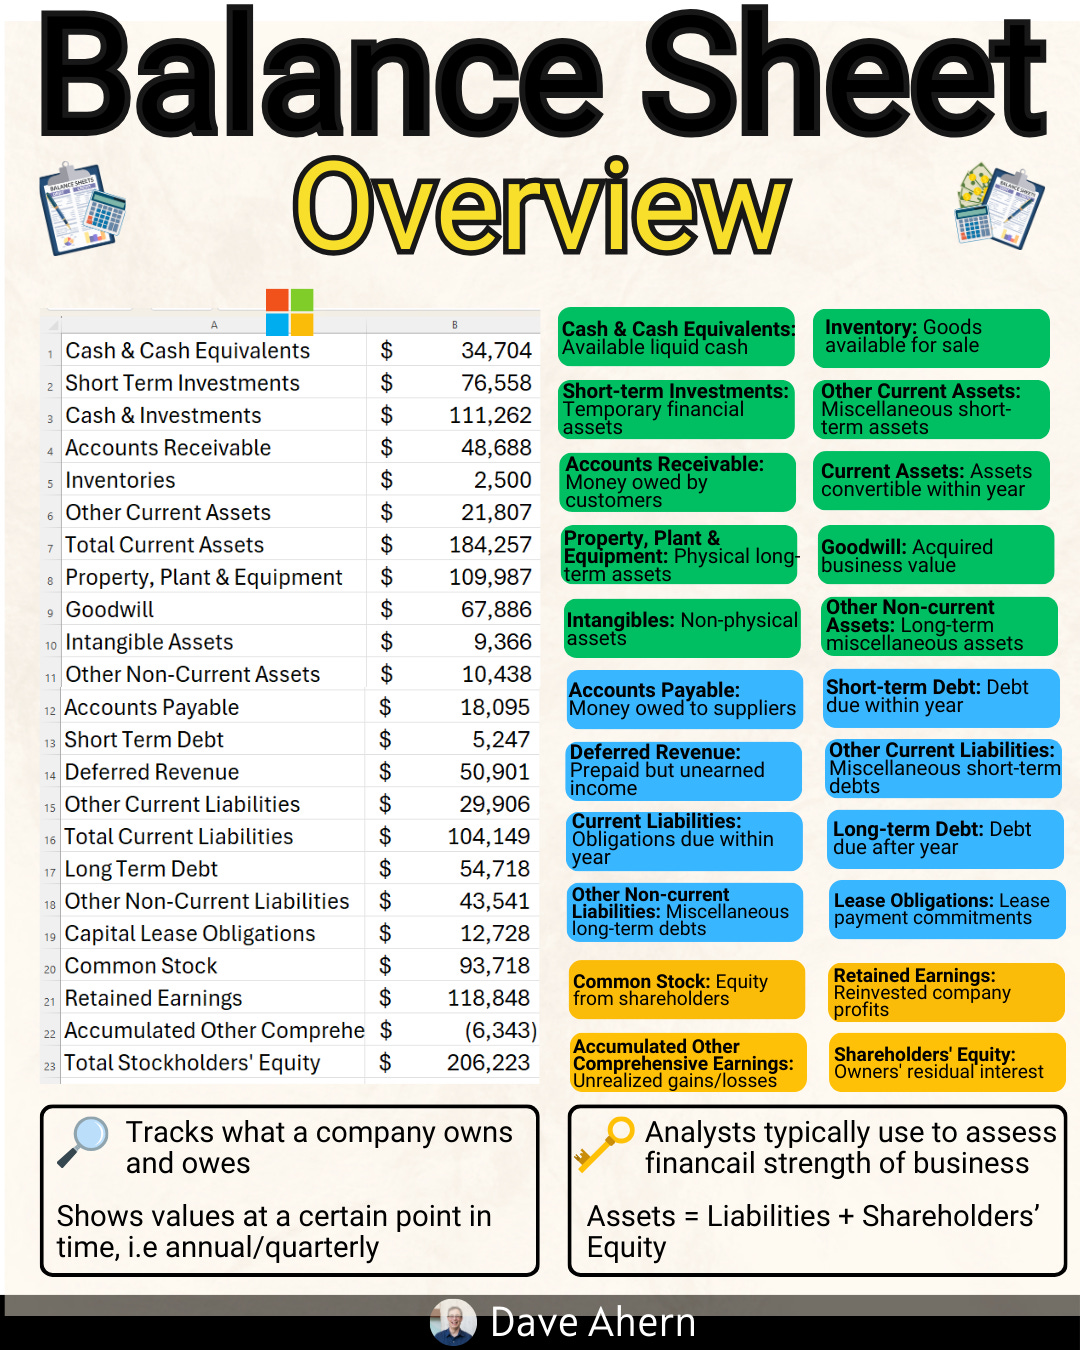
The Balance Sheet is different. It's not about a period of time; it's a snapshot. Think of it like the student's official photo taken on picture day. It captures everything exactly as it was at that one specific moment.
It has two sides that must, by definition, balance out.
One side is Assets: This is all the stuff the company owns. Cash in the bank, buildings, inventory on the shelves, equipment in the factory.
The other side is Liabilities and Equity: This shows who has a claim on all that stuff.
Liabilities are what the company owes to others (like bank loans and bills to suppliers).
Equity is what's left over for the owners (the shareholders).
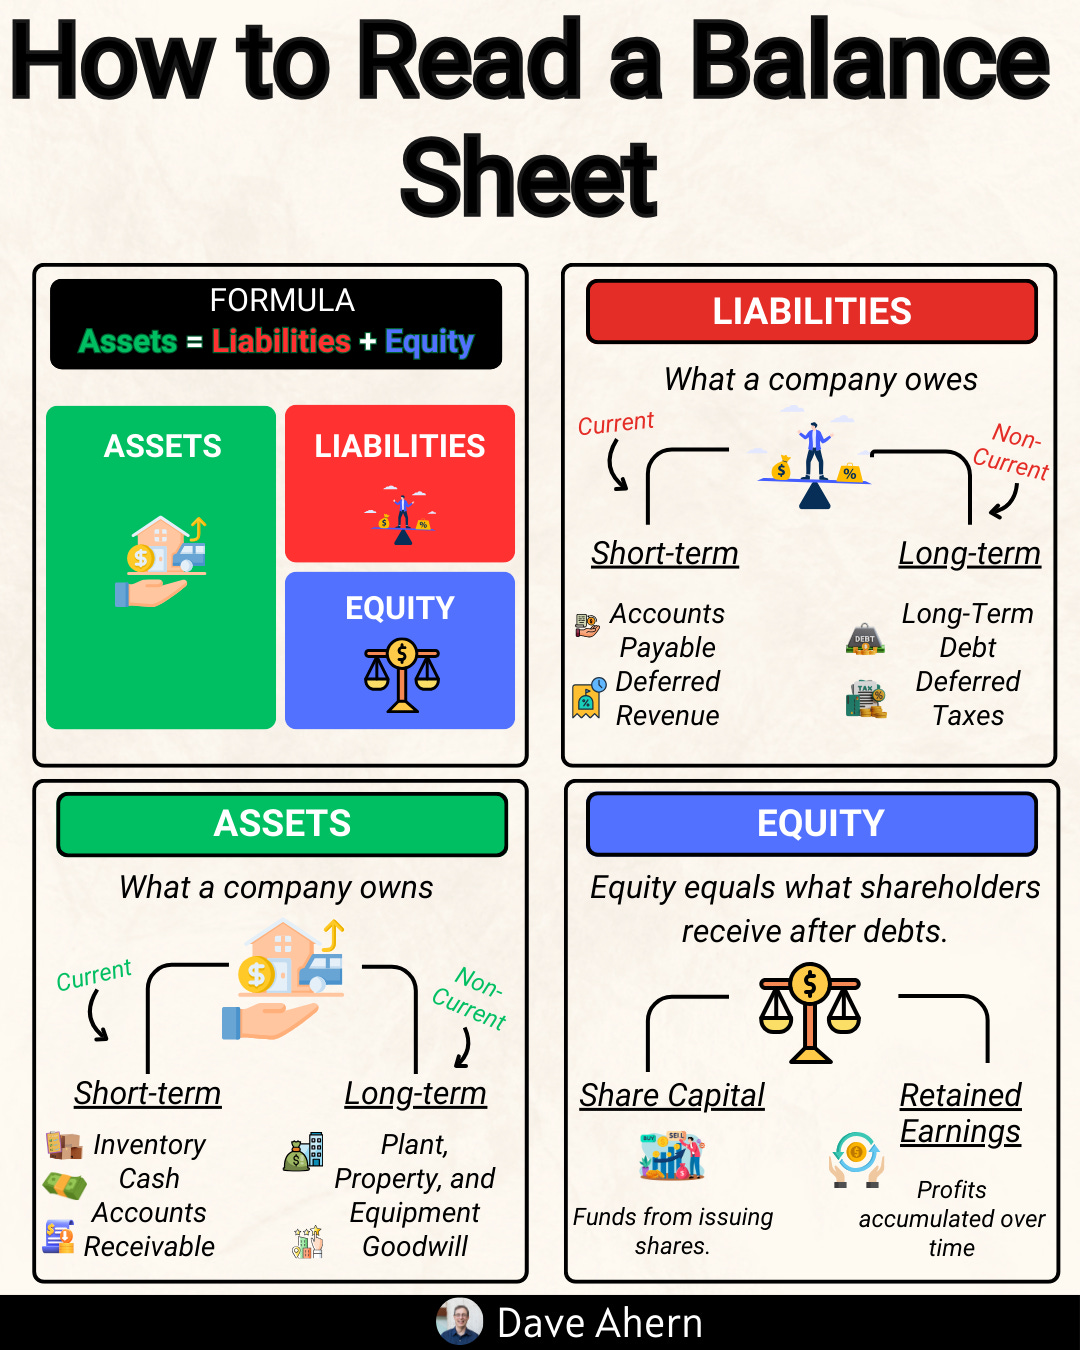
The simple formula is: Assets = Liabilities + Equity.
The Balance Sheet gives you a sense of the company's stability. Does it have a lot of cash? Or is it drowning in debt?
3. The Statement of Cash Flows: The Allowance Tracker
The question it answers: "Where did the company's cash actually come from and where did it go?"
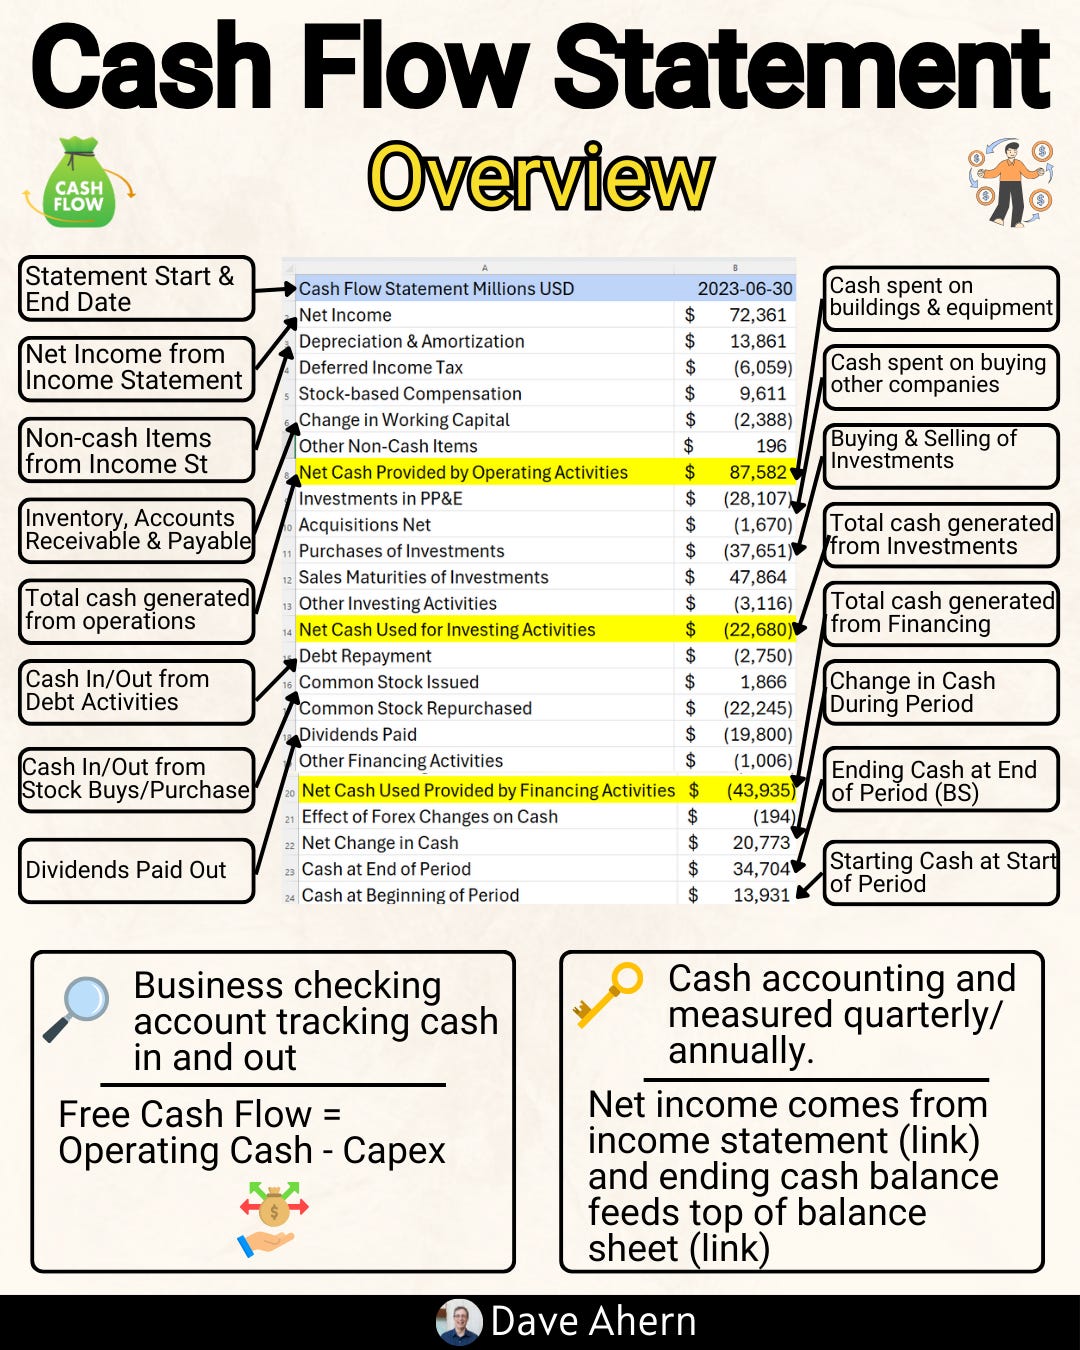
This one might be the most important and the most overlooked. It's the story behind the grades. A student might get an "A" on their report card (Net Income), but what if they cheated? Or what if they got the "A" but their bank account is empty?
Profit on the Income Statement is an accounting concept. It's not the same as cold, hard cash.
The Statement of Cash Flows reconciles the two. It tracks every single dollar that moved in or out of the company's bank account. It breaks the cash movement down into three simple categories:
Operations: Cash from the actual day-to-day business. (Is it making cash from its customers?)
Investing: Cash used to buy or sell long-term assets, like factories or other companies. (Is it investing for the future?)
Financing: Cash from borrowing money or paying it back, or from selling its own stock. (Is it raising money from banks or shareholders?)
This statement tells you the truth. A company can't survive without cash, no matter what its "profit" says.
You Need All Three
You wouldn't judge a student by only looking at their grades. You'd want to see their overall financial situation (the Balance Sheet) and know the real story of how they're managing their money (the Cash Flow Statement), too.
One statement alone gives you an incomplete, and sometimes misleading, picture. Together, they give you a full, 3D view of the business.