
The 5 Financial Metrics That Matter Most (and Why) Visualized
A practical guide to the numbers that separate great businesses from mediocre ones

Here’s a truth that most investing courses won’t tell you: You don’t need to track 47 different financial metrics to analyze a stock.
I’ve been investing for 13 years and writing about fundamental analysis for over 9. In that time, I’ve analyzed hundreds of companies. And you know what I’ve learned? Most investors overwhelm themselves with spreadsheets full of ratios that don’t actually move the needle on their understanding of a business.
The reality? Five core metrics will tell you almost everything you need to know about whether a company can:
Generate cash consistently
Protect itself during tough times
Reinvest for growth
Deliver returns to shareholders
Today, we’re breaking down those five metrics using real numbers from Microsoft’s latest quarterly report. You’ll see exactly how to calculate each one, understand what they’re really telling you, and most importantly, learn how to use them when analyzing your own stocks.
No fluff. No jargon. Just the metrics that matter.
Why These 5 Metrics?
Before we dive in, let’s address the elephant in the room: why these five?
Because they answer the most important questions about any business:
Is the business actually profitable? (Operating Margin)
Can it turn those profits into cash? (Free Cash Flow)
Is it using shareholders’ money effectively? (Return on Equity)
Can it handle short-term obligations? (Current Ratio)
Does it have pricing power? (Gross Margin)
These aren’t arbitrary. They work together to paint a complete picture of business quality. Miss one, and you might invest in a company that looks good on paper but crumbles in reality.
Let’s break them down.
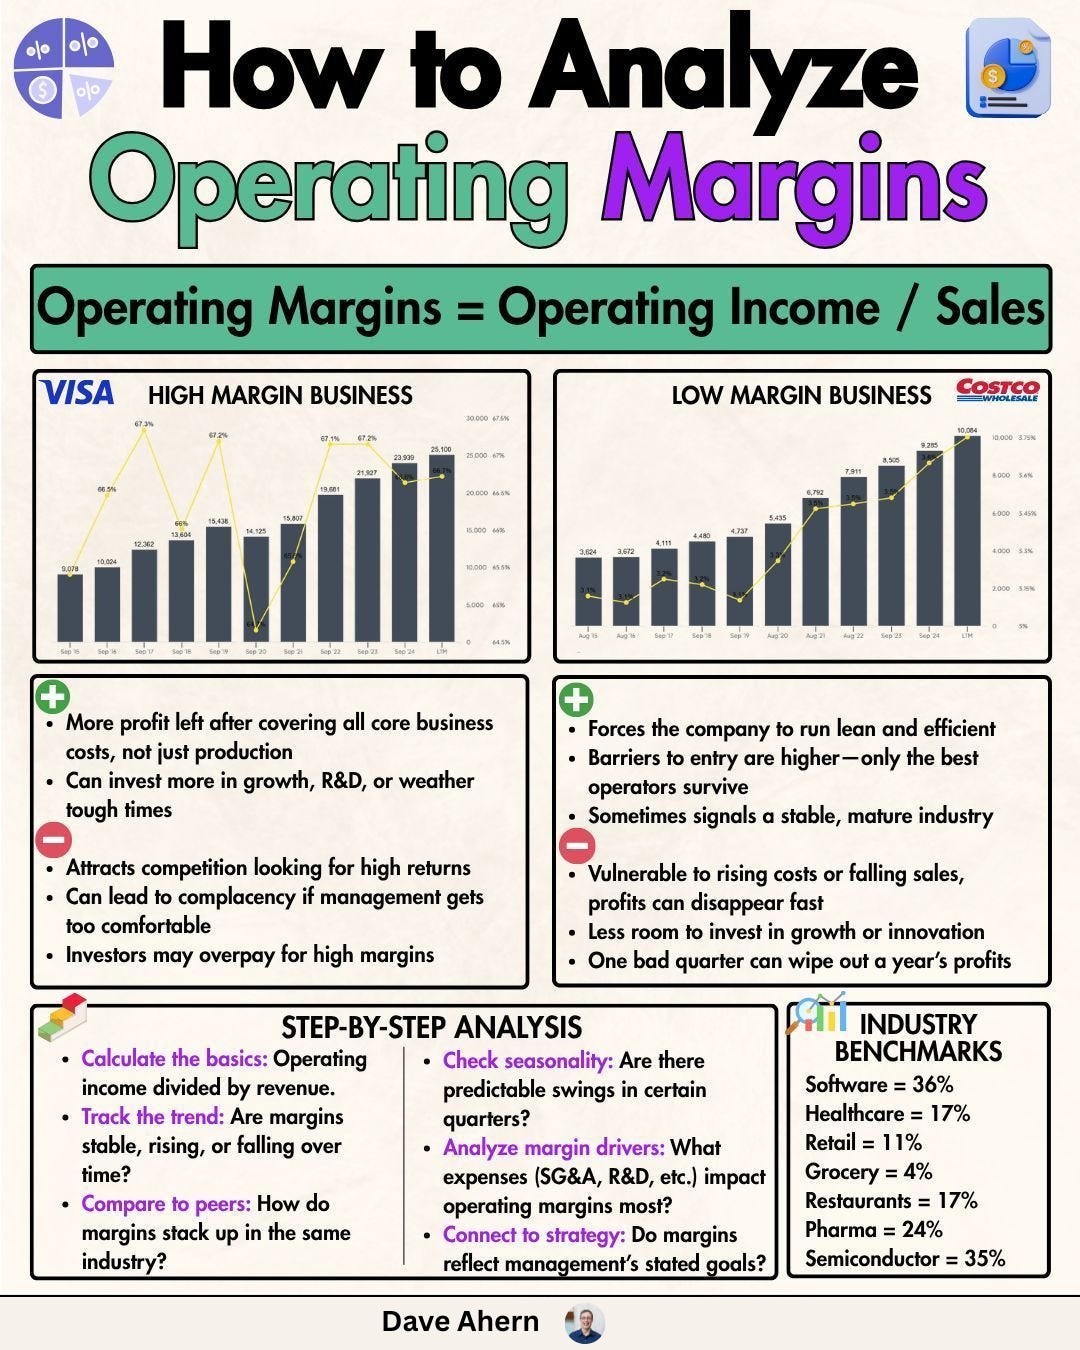
Metric #1: Operating Margin – The Efficiency Test
What it measures: How much profit a company generates from its core operations for every dollar of revenue, before accounting for interest and taxes.
The formula:
Why it matters:
Operating margin tells you whether a company’s actual business model works. It strips away financial engineering, tax strategies, and one-time gains. What’s left is the pure economics of how the company makes money.
A healthy operating margin means the company can:
Control costs relative to revenue
Maintain pricing power
Scale efficiently
Weather industry downturns
Think of it this way: Revenue is vanity. Operating income is reality.
What to look for:
20%+ is excellent for most businesses (indicates strong competitive advantage)
10-20% is solid (decent business with room for improvement)
Below 10% requires investigation (thin margins leave little room for error)
Negative means the company is losing money on operations
Industry context matters. A software company with 20% margins might be struggling. A retailer with 8% margins might be thriving. Always compare to industry peers.
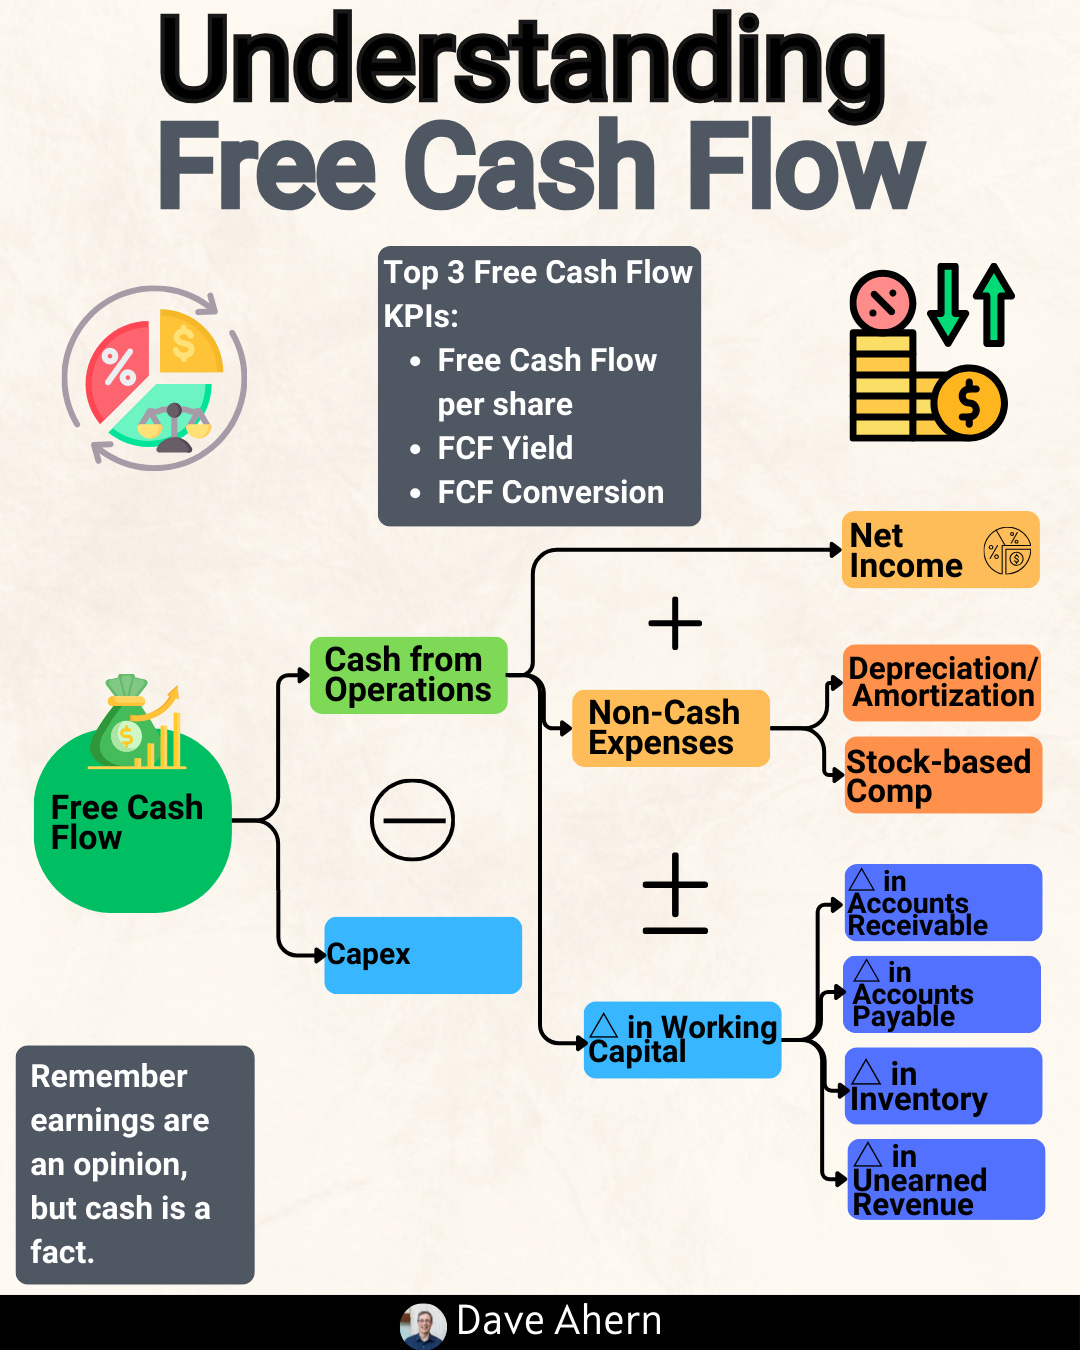
Metric #2: Free Cash Flow – The Truth Teller
What it measures: The cash a company generates after paying to maintain and grow its business (capital expenditures).
The formula:
Why it matters:
This is my favorite metric because you can’t fake cash. Earnings can be manipulated through accounting choices, but cash flow doesn’t lie.
Free cash flow represents the money available to:
Pay dividends
Buy back shares
Pay down debt
Make acquisitions
Build a war chest for opportunities
Without consistent free cash flow, a company eventually runs into trouble, no matter how impressive its revenue growth looks.
Warren Buffett puts it simply: “Cash is king.”
What to look for:
Positive and growing over time (the gold standard)
FCF consistently exceeds net income (high-quality earnings)
FCF as a percentage of revenue trending upward (improving efficiency)
Watch out for: Companies with high earnings but low/negative FCF (often means aggressive accounting)
A quick reality check: If a company reports $1 billion in net income but only $100 million in free cash flow, ask yourself: where’s the other $900 million going?
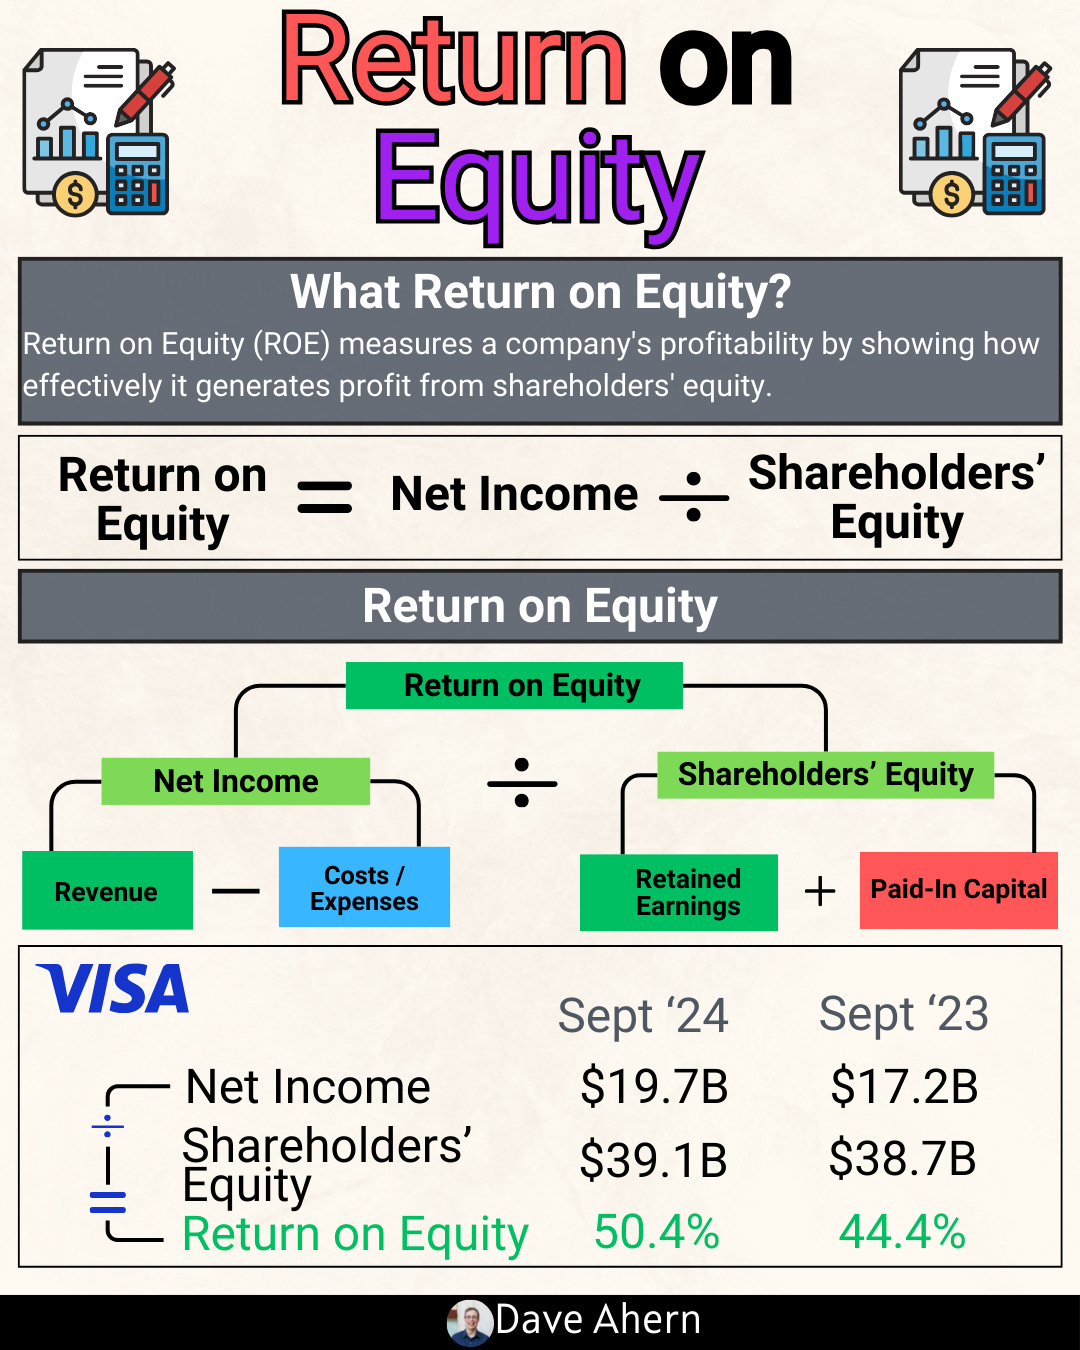
Metric #3: Return on Equity (ROE) – The Shareholder Value Generator
What it measures: How effectively a company uses shareholders’ equity (money) to generate profits.
The formula:
Why it matters:
ROE answers a fundamental question: If I invest $100 in this company, how much profit will it generate?
This metric reflects management’s capital-allocation skills. A high, sustainable ROE means the company doesn’t need to constantly raise new capital to grow—it can reinvest its own profits productively.
Think of it as your scorecard for management effectiveness.
What to look for:
15%+ is strong (the company creates substantial value from shareholders’ money)
10-15% is acceptable (decent returns but not exceptional)
Below 10% is concerning (capital isn’t working hard enough)
Consistency matters more than peaks (sustained 15% beats one year at 40% followed by 5%)
Important caveat: Be wary of companies using excessive debt to juice ROE. A company with $10 in equity and $90 in debt might show a 50% ROE, but that’s leverage-driven, not operational excellence. Cross-reference with the debt-to-equity ratio.
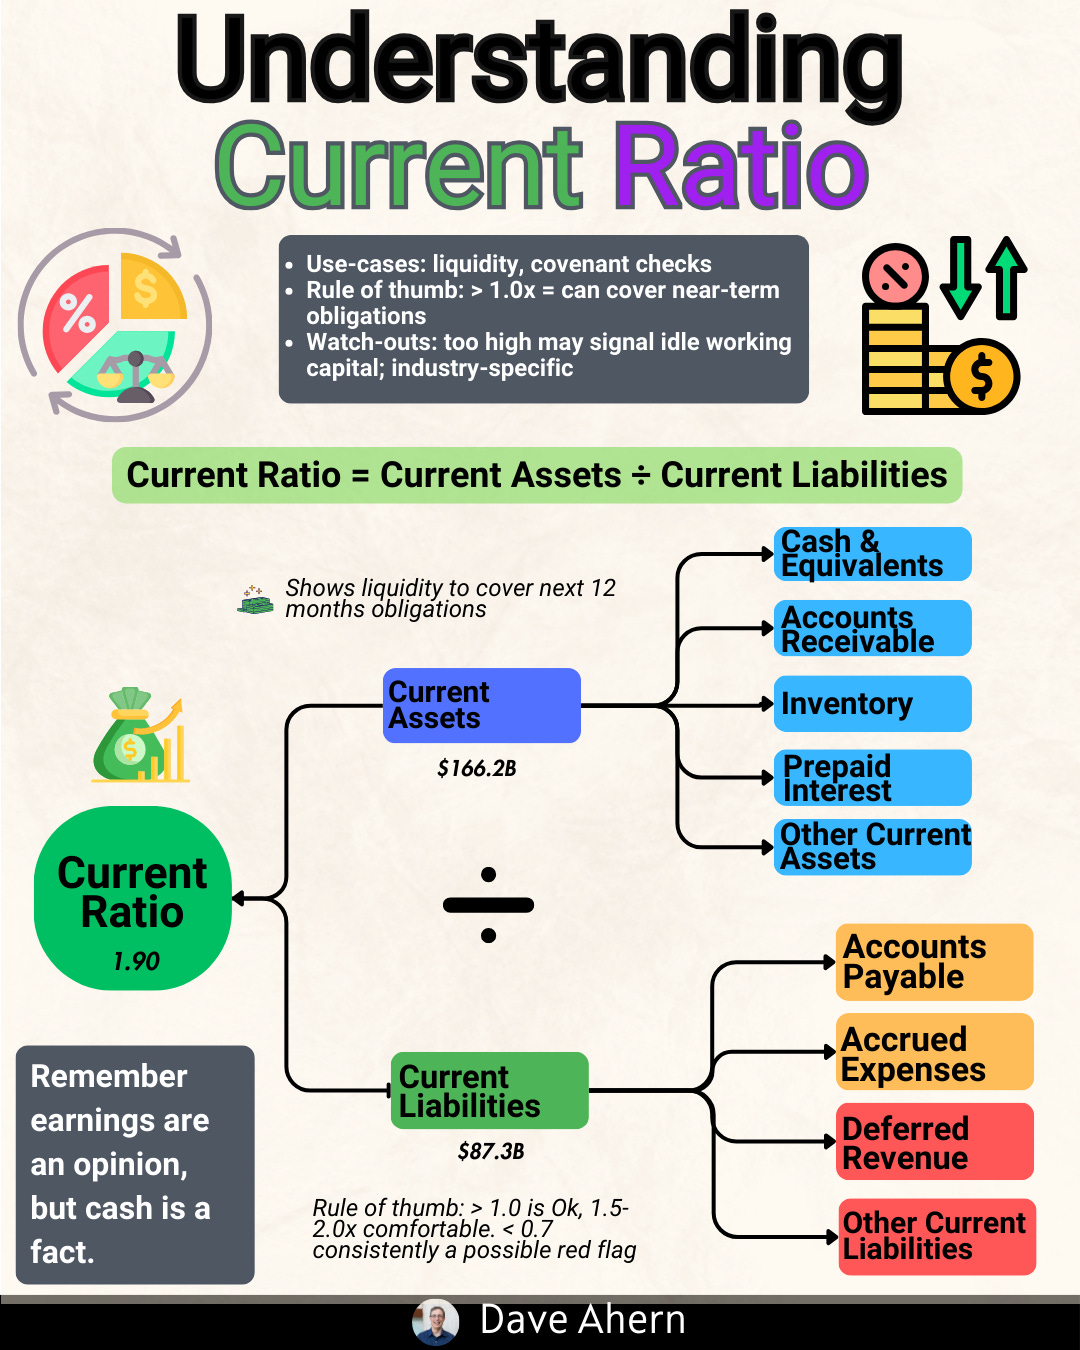
Metric #4: Current Ratio – The Safety Net
What it measures: A company’s ability to pay its short-term obligations (bills due within a year) using short-term assets (cash and things easily converted to cash).
The formula:
Why it matters:
Even profitable companies can fail if they can’t pay their bills. The current ratio tells you whether a company has enough liquid resources to handle near-term obligations without scrambling for emergency financing.
This metric is your early warning system for financial distress.
What to look for:
1.5 to 3.0 is ideal (comfortable cushion without excess cash sitting idle)
1.0 to 1.5 requires monitoring (manageable but tight)
Below 1.0 is concerning (might struggle to pay bills)
Above 3.0 might indicate inefficiency (too much cash not being deployed)
Context is critical: Tech companies often run lower current ratios because they generate cash quickly. Manufacturers need higher ratios due to inventory and longer cash cycles.
Crisis test: During the 2020 pandemic, companies with strong current ratios survived. Those without had to raise expensive capital or cut operations.
[VISUAL SUGGESTION: Place a gauge/speedometer visual showing Microsoft’s current ratio, with zones marked “danger,” “caution,” and “healthy”]
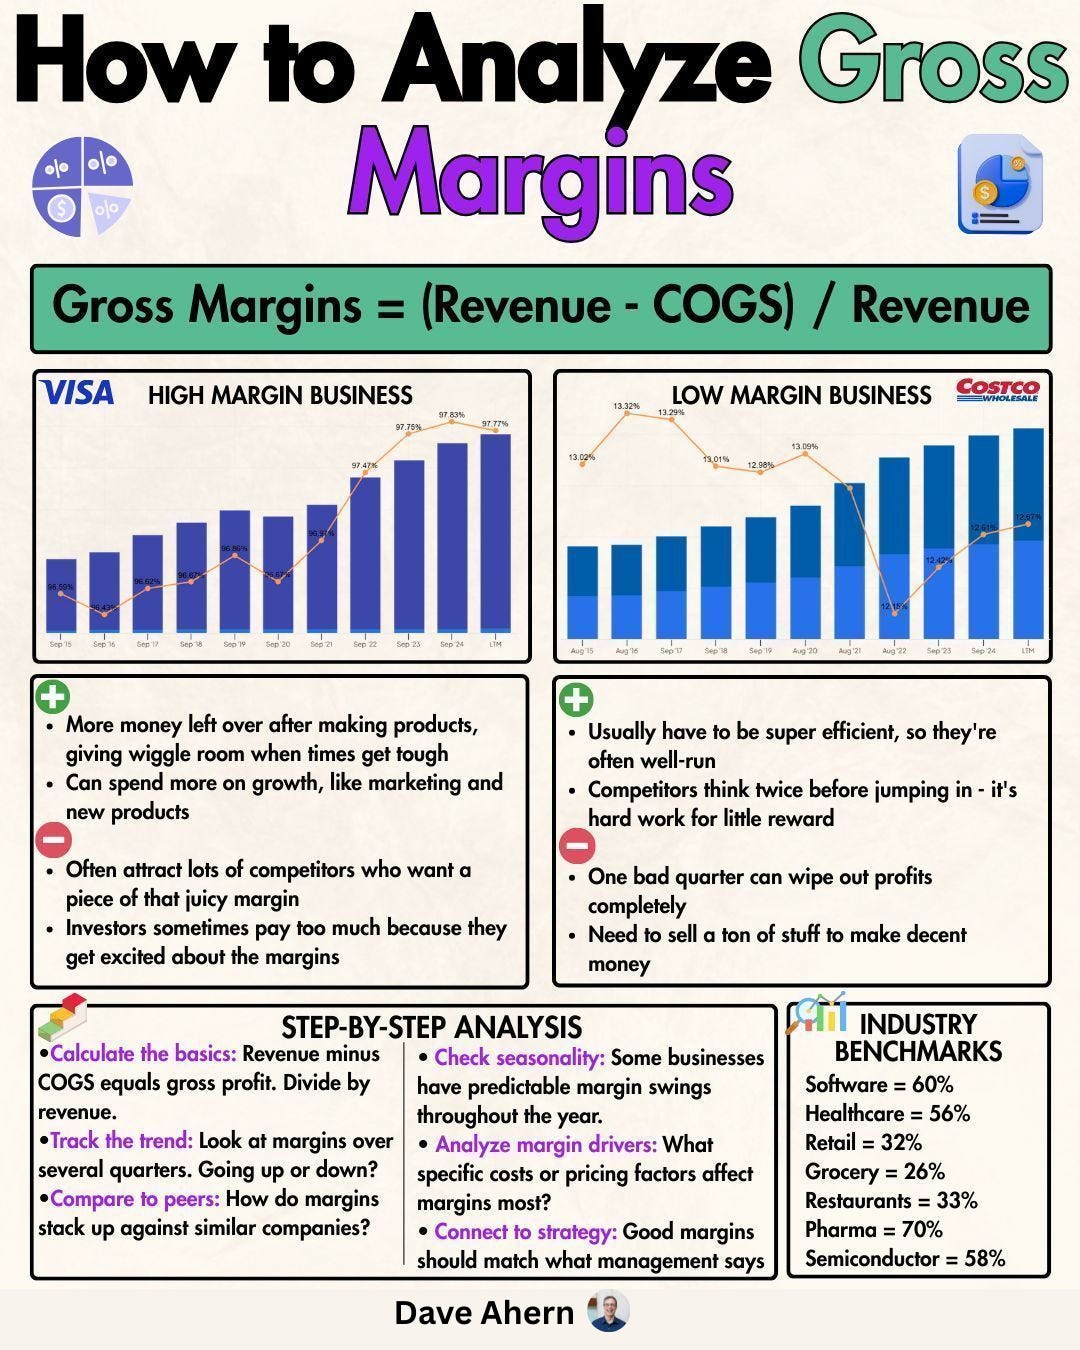
Metric #5: Gross Margin – The Pricing Power Indicator
What it measures: The percentage of revenue left after subtracting the direct costs of producing goods or delivering services.
The formula:
Why it matters:
Gross margin reveals whether a company can charge more than it costs to deliver the product or service. High gross margins indicate:
Strong competitive moats
Pricing power
Low production costs relative to value delivered
Ability to invest in growth while staying profitable
This metric separates businesses with durable advantages from commodity players in a race to the bottom.
What to look for:
60%+ is exceptional (typically software, platforms, or highly differentiated products)
40-60% is strong (solid business model with competitive advantages)
20-40% is moderate (competitive industry, must control costs carefully)
Below 20% requires extreme efficiency (razor-thin margins, high volume needed)
Trend matters: Improving gross margins over time signal growing pricing power. Declining margins suggest increasing competition or cost pressures.
The rule: Companies with high gross margins have more room to invest in R&D, marketing, and innovation—which compounds their advantages over time.
How These Metrics Work Together
Here’s where it gets powerful: these five metrics don’t work in isolation. They validate each other.
A great company typically shows:
High operating margins (profitable core business)
Strong free cash flow (profits convert to cash)
Solid ROE (efficient use of capital)
Healthy current ratio (financially stable)
High gross margins (pricing power)
Red flags emerge when metrics conflict:
High operating margin but low FCF? (Accounting shenanigans or capital-intensive growth)
Strong ROE but low current ratio? (Dangerous leverage)
High gross margin but negative operating margin? (Operating expenses out of control)
The metrics tell a story together. Your job is to listen.
Put It Into Practice: Your 3-Step Analysis Framework
Now that you understand the metrics, here’s how to use them systematically when analyzing any stock:
Step 1: Calculate the Core Five
Pull up the company’s latest 10-Q or 10-K from sec.gov. Find these line items:
Income Statement: Revenue, Cost of Revenue, Operating Income, Net Income
Balance Sheet: Current Assets, Current Liabilities, Shareholders’ Equity
Cash Flow Statement: Operating Cash Flow, Capital Expenditures
Calculate all five metrics. Write them down.
Step 2: Compare Against History and Peers
Don’t analyze metrics in a vacuum. Ask:
How do these compare to the past 3-5 years? (Improving or deteriorating?)
How do they stack up against competitors? (Use comparable companies)
Are they consistent or volatile? (Consistency = predictability = lower risk)
Use free tools like FinBox, GuruFocus, or even the company’s own investor presentations for peer comparisons.
Step 3: Connect the Dots
Look for the story the metrics tell together:
Is this a high-quality compounder? (High margins, strong FCF, great ROE)
Is it a value trap? (Low margins, inconsistent FCF, declining ROE)
Is it financially stressed? (Low current ratio, negative FCF)
Is it a turnaround candidate? (Improving trends across the board)
Your decision framework:
All five metrics strong? → High-quality business worth a closer look
Three or more weak? → Pass or wait for improvement
Mixed signals? → Dig deeper to understand why
Your Action Items
Here’s what to do right now:
1. Pick a stock you own or are considering
2. Pull up their latest SEC filing (10-Q for quarterly, 10-K for annual)
3. Calculate these five metrics:
Operating Margin
Free Cash Flow
Return on Equity
Current Ratio
Gross Margin
4. Compare to:
The company’s 3-year averages
At least 2-3 direct competitors
5. Ask yourself: Do these metrics support or contradict my investment thesis?
Spend 30 minutes on this exercise. I guarantee you’ll learn more about your investment than reading a dozen analyst reports.
A Real Example: Analyzing Microsoft
Want to see exactly how these metrics work in practice? Below, I walk through Microsoft’s Q1 FY2025 numbers from their latest SEC filing—showing you step-by-step how to calculate each metric, what the numbers reveal, and what red flags (or green lights) to look for.
A Real Example: Analyzing Microsoft
From their latest SEC filing (Q1 FY2025, ended September 30, 2024)
Let’s put everything into practice. I’ll walk you through Microsoft’s numbers step by step, showing you exactly where to find each data point and what the calculations reveal.
Step 1: Gathering the Raw Data
From Microsoft’s 10-Q filed October 30, 2024:
Income Statement (Page 3):
Revenue: $65,585 million
Cost of revenue: $20,099 million
Operating income: $30,552 million
Net income: $24,667 million
Balance Sheet (Page 5):
Current assets: $149,926 million
Current liabilities: $115,200 million
Stockholders’ equity: $287,723 million
Cash Flow Statement (Page 6):
Operating cash flow: $34,180 million
Capital expenditures: $14,923 million
Metric #1: Operating Margin = 46.6%
The calculation:
Operating Margin = ($30,552 ÷ $65,585) × 100 = 46.6%
What this tells us: Microsoft generates $0.47 in operating profit for every dollar of revenue. That’s exceptional, almost double the S&P 500 average of ~12%.
Context: Apple’s is ~30%, Google’s ~27%, Amazon’s ~6%. Microsoft is elite.
The trend: Remarkably stable at 45-48% over the past four quarters despite massive AI infrastructure investments. This consistency demonstrates that the business model is durable and has genuine pricing power.
Metric #2: Free Cash Flow = $19.3 Billion
The calculation:
FCF = $34,180 - $14,923 = $19,257 million ($19.3B)
That’s $19.3 billion in one quarter, or roughly $77 billion annualized.
FCF Quality Check:
FCF conversion = $19,257 ÷ $24,667 = 78%
Microsoft converts 78% of net income into actual cash, solid and reliable.
What they do with it: Based on the filing, Microsoft returned $9 billion to shareholders this quarter ($6.2B in dividends + $2.8B in buybacks), representing 47% of FCF. The rest of the funds grow investments.
The investment: $14.9B in CapEx is almost entirely allocated to data center buildouts for Azure and AI services. Microsoft states: “We expect capital expenditures to increase in the coming years to support growth in our cloud offerings and our investments in AI infrastructure.”
Bottom line: Generating $77B annually in free cash while investing heavily in AI infrastructure positions Microsoft perfectly for the future.
Metric #3: Return on Equity = 34.3%
The calculation:
Annualized ROE = ($24,667 × 4) ÷ $287,723 × 100 = 34.3%
For every dollar of shareholder equity, Microsoft generates $0.34 in annual profit. That’s exceptional (S&P 500 average is ~18%).
Is this leverage-driven?
Debt-to-Equity = $45,117M ÷ $287,723M = 0.16 (or 16%)
No. Microsoft’s conservative 16% debt-to-equity ratio demonstrates that the 34% ROE reflects genuine business profitability, not financial engineering.
Historical context: Microsoft’s ROE has been 34-43% in recent years. The slight decline is intentional—they’re building up equity while maintaining profitability, a sign of strength.
Metric #4: Current Ratio = 1.30 (Really 2.41)
The calculation:
Current Ratio = $149,926 ÷ $115,200 = 1.30
At first glance, 1.30 seems modest. But look closer at current liabilities:
Unearned revenue: $53,026 million
This $53 billion is advanced customer payments for cloud subscriptions—money already received for future services. It’s not money owed; it’s future revenue in the bank.
Adjusted calculation:
Adjusted Ratio = $149,926 ÷ ($115,200 - $53,026) = 2.41
Microsoft has a very healthy liquidity position, with $78.4 billion in cash and short-term investments, enough to fund 5+ quarters of current CapEx.
Metric #5: Gross Margin = 69.4%
The calculation:
Gross Margin = ($45,486 ÷ $65,585) × 100 = 69.4%
After paying direct costs, Microsoft keeps 70 cents on every dollar. That’s outstanding.
Why so high? Software has near-zero marginal cost, cloud services leverage existing infrastructure, and ecosystem lock-in enables premium pricing.
The AI trade-off: Gross margin declined from 71.2% (last year) to 69.4%—a 1.8 point drop. Microsoft is accepting short-term margin pressure to invest in AI infrastructure. Given their $19B quarterly FCF and dominant positions, they can afford this strategic trade-off.
Should you worry? Only if gross margins fall below 60% or operating margins drop below 35%. We’re nowhere near those levels.
The Complete Picture
Summary scorecard:
Metric Microsoft Grade Operating Margin 46.6% A+ Free Cash Flow $19.3B/quarter A Return on Equity 34.3% A Current Ratio 1.30 (2.41 adjusted) B+ Gross Margin 69.4% A
What these metrics reveal together:
Microsoft is a world-class business operating at peak quality:
Generates massive profits (46.6% operating margin)
Converts profits to cash ($77B+ annual FCF)
Uses shareholder capital exceptionally (34% ROE)
Maintains financial stability (strong liquidity)
Possesses pricing power (69% gross margin)
Investment implications:
This is not a value stock—quality like this trades at premium valuations
Short-term margin pressure from AI is strategic, not structural
Capital allocation is shareholder-friendly ($9B returned quarterly)
Consistent metrics show a durable business model
Red flags to monitor:
Gross margin falling below 65%
FCF conversion dropping below 70%
Declining unearned revenue (slowing cloud growth)
ROE falling while revenue slows
None are present today, but knowing what to watch helps you exit before problems escalate.
Your Analysis Template
Copy this for analyzing any stock:
1. Data Collection:
INCOME STATEMENT:
Revenue: $_____  |  Cost of Revenue: $_____
Operating Income: $_____  |  Net Income: $_____

BALANCE SHEET:
Current Assets: $_____  |  Current Liabilities: $_____
Shareholders' Equity: $_____

CASH FLOW:
Operating Cash Flow: $_____  |  CapEx: $_____
2. Calculate:
Operating Margin = (Op Income ÷ Revenue) × 100 = ____%
Free Cash Flow = Op Cash Flow - CapEx = $_____
ROE = (Net Income × 4 ÷ Equity) × 100 = ____%
Current Ratio = Current Assets ÷ Current Liabilities = _____
Gross Margin = ((Revenue - COGS) ÷ Revenue) × 100 = ____%
3. Grade It:
vs. Historical: [Improving / Stable / Declining]
vs. Peers: [Better / Similar / Worse]
Quality: [Excellent / Good / Mediocre / Poor]
Action: [Buy / Hold / Pass]
To make this a little less time consuming, try out a free template I made, all you need to do is fill in the info and voila!
→ Get the auto-calculating Google Sheets template link here
Click “File → Make a Copy” to save it to your own Google Drive, then just fill in the yellow cells with numbers from any company’s SEC filing.
Key Takeaways
1. Quality shows up in numbers. Microsoft’s 46% operating margins, $77B FCF, and 34% ROE prove excellence.
2. Context matters. A 1.30 current ratio looks weak until you realize $53B is prepaid customer subscriptions.
3. Intentional trade-offs are smart. Accepting margin pressure to invest in AI is strategic capital allocation.
4. Consistency beats peaks. Stable metrics quarter-to-quarter create predictable compounding.
5. The five metrics validate each other. High margins + strong FCF + great ROE + adequate liquidity + pricing power = compounding machine.
What to Do Next
Start simple:
Pick one stock you own
Pull their latest 10-Q from sec.gov
Use the template above
Calculate all five metrics
Compare to one competitor
Level up:
Track these metrics quarterly for all your holdings
Set alerts when companies file new 10-Qs
Build a quality filter for new investment ideas
Look for improving metrics + falling prices = opportunity
The framework is simple. The insights are powerful. The results compound.
Now go analyze something.
Final Thoughts
Financial metrics aren’t about memorizing formulas. They’re about asking better questions:
Can this company make money consistently?
Does it generate real cash?
Is management using my money wisely?
Will it survive tough times?
Does it have a moat?
These five metrics answer those questions.
Master them, and you’ll cut through the noise. You’ll spot quality businesses faster. You’ll avoid value traps. You’ll build a portfolio of companies that compound wealth over time.
Start today. Pick one stock. Run the numbers. See what the metrics tell you.
The insights might surprise you.