

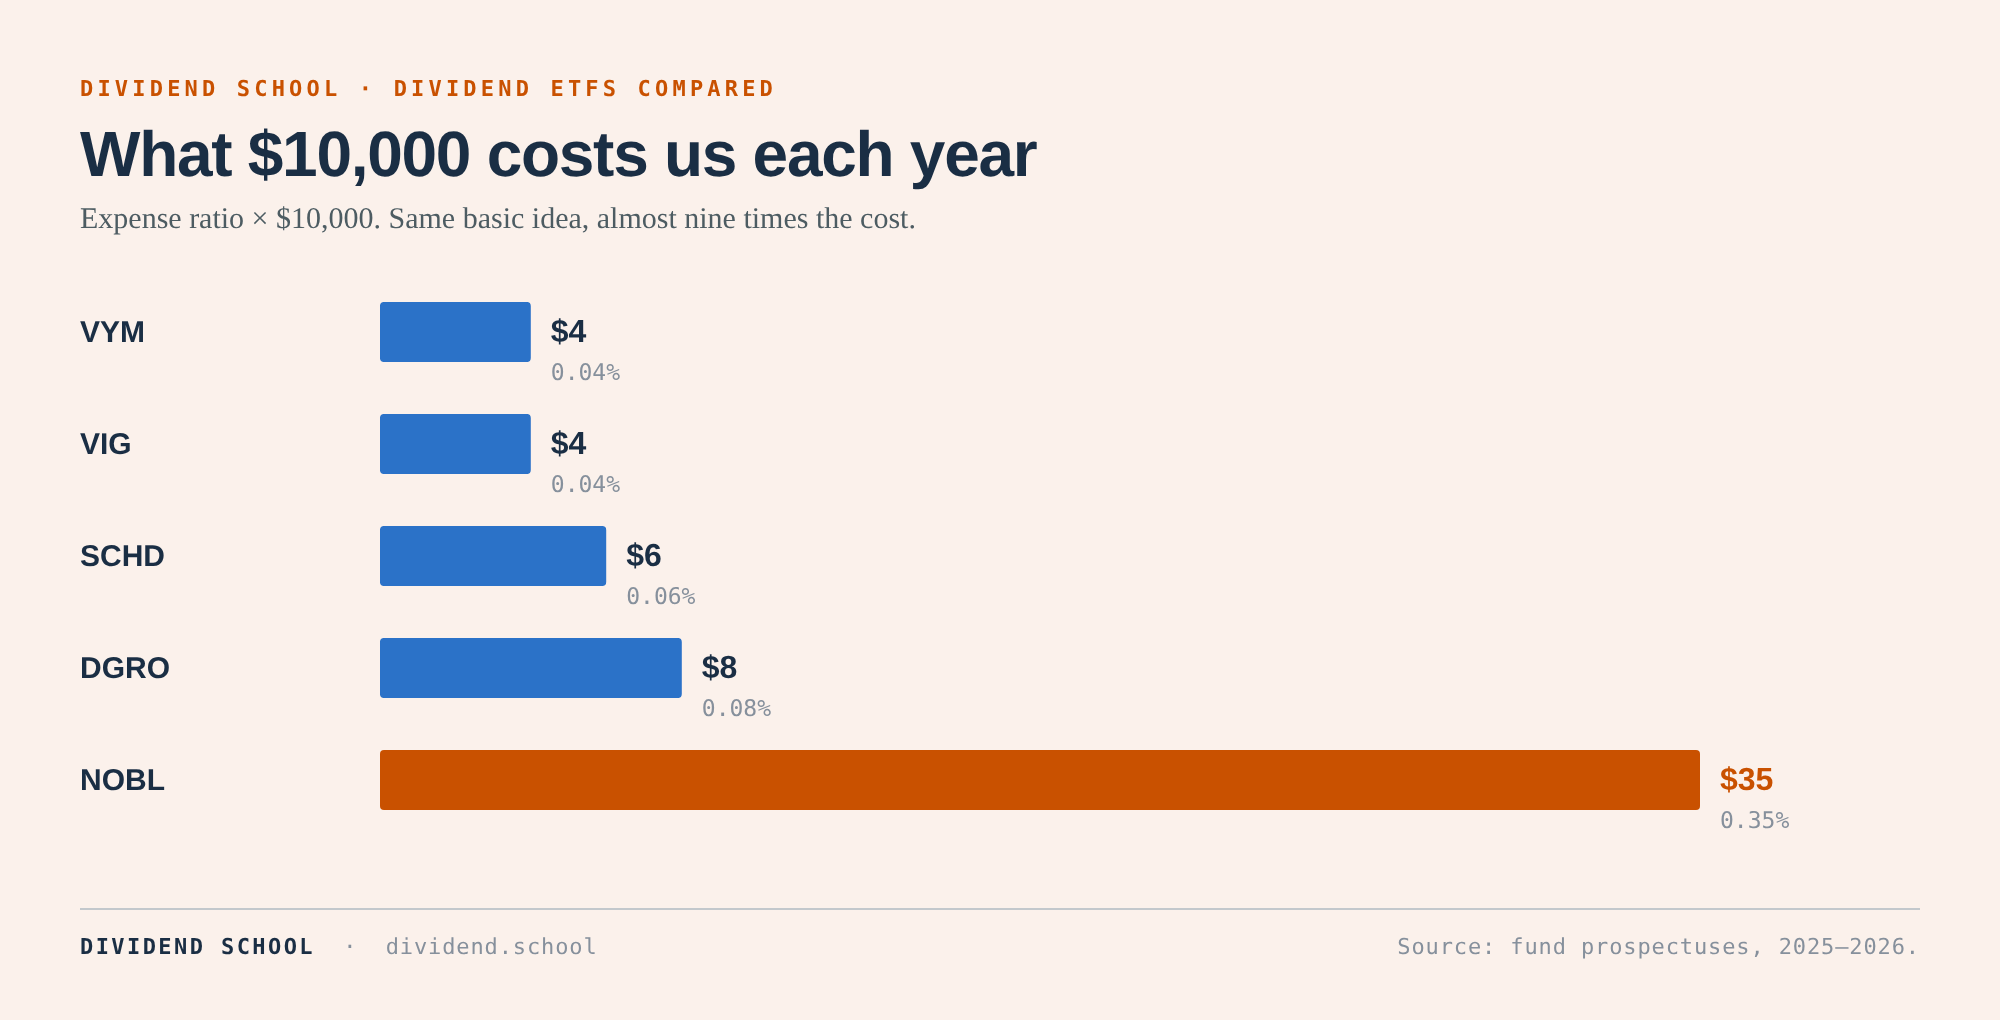
The cheapest fund on this list charges us $4 a year on $10,000. The most expensive charges $35.
Same basic idea: dividend-paying US stocks in a basket, and almost nine times the cost. Over 20 years, that gap costs us $2,785 on a $10,000 starting balance (more on that math below).
And the expensive one has the weakest five-year and ten-year returns of the five. Go figure.
Today we put five of the best-known dividend ETFs side by side and read them the way we read a company: what they own, how they pick it, what they pay us, and what they charge for the privilege.
In today’s issue, we will discuss:
Myth Busting from the Start
The five at a glance
NAV: The Ins and Outs
What the fees cost us
SCHD: Schwab U.S. Dividend Equity ETF
VYM: Vanguard High Dividend Yield ETF
VIG: Vanguard Dividend Appreciation ETF
DGRO: iShares Core Dividend Growth ETF
NOBL: ProShares S&P 500 Dividend Aristocrats ETF
Which fund for which job
Okay, let’s dive in and see what each of these funds is doing with our money.
Myth Busting from the Start
An ETF doesn’t raise its dividend. It passes through whatever its holdings paid that quarter, minus the fee.
So there is no streak to protect and no board deciding the payout. When a big holding cuts, the fund’s check shrinks. When the index swaps out a name in March, the check changes again.
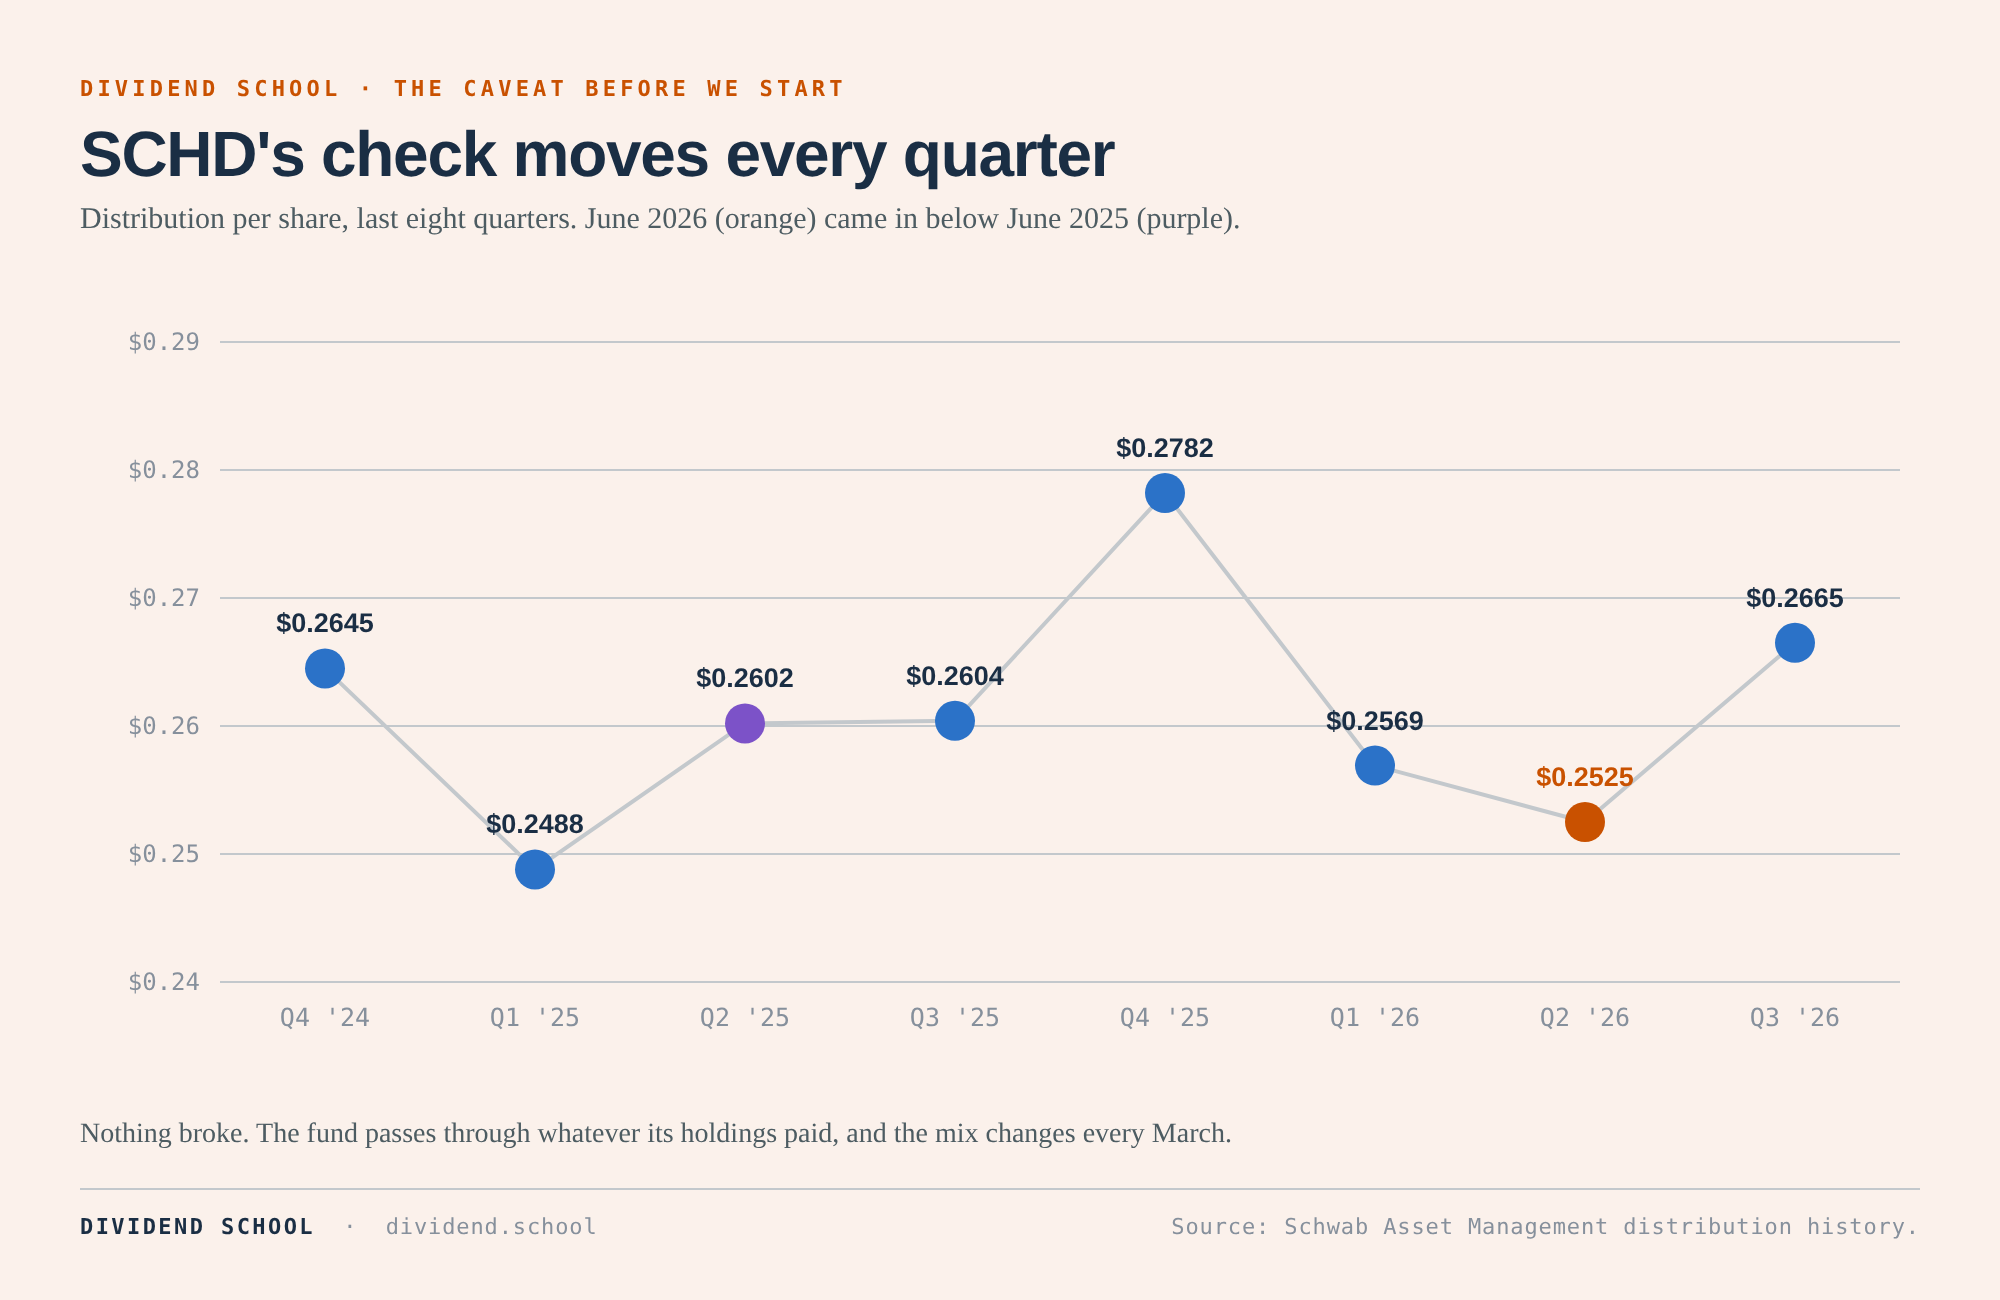
We saw this with SCHD this year. The June 2026 payment was $0.2525 a share, down from $0.2602 in June 2025. Nothing broke; the mix of companies changed.
So when we talk about “dividend growth” below, we mean the fund’s total payout per share, year over year. It wobbles. What we want is the trend.
How did I pick these five? Four of them are among the largest plain dividend-stock ETFs with at least ten years of history, plus NOBL, because the Dividend Aristocrats name pulls in a lot of new money and the fee deserves a hard look.
What’s missing? Covered-call funds like JEPI. They pay big monthly checks, but most of that money comes from selling options, not from dividends. Different animal. We use JEPI below to teach NAV.
The five at a glance
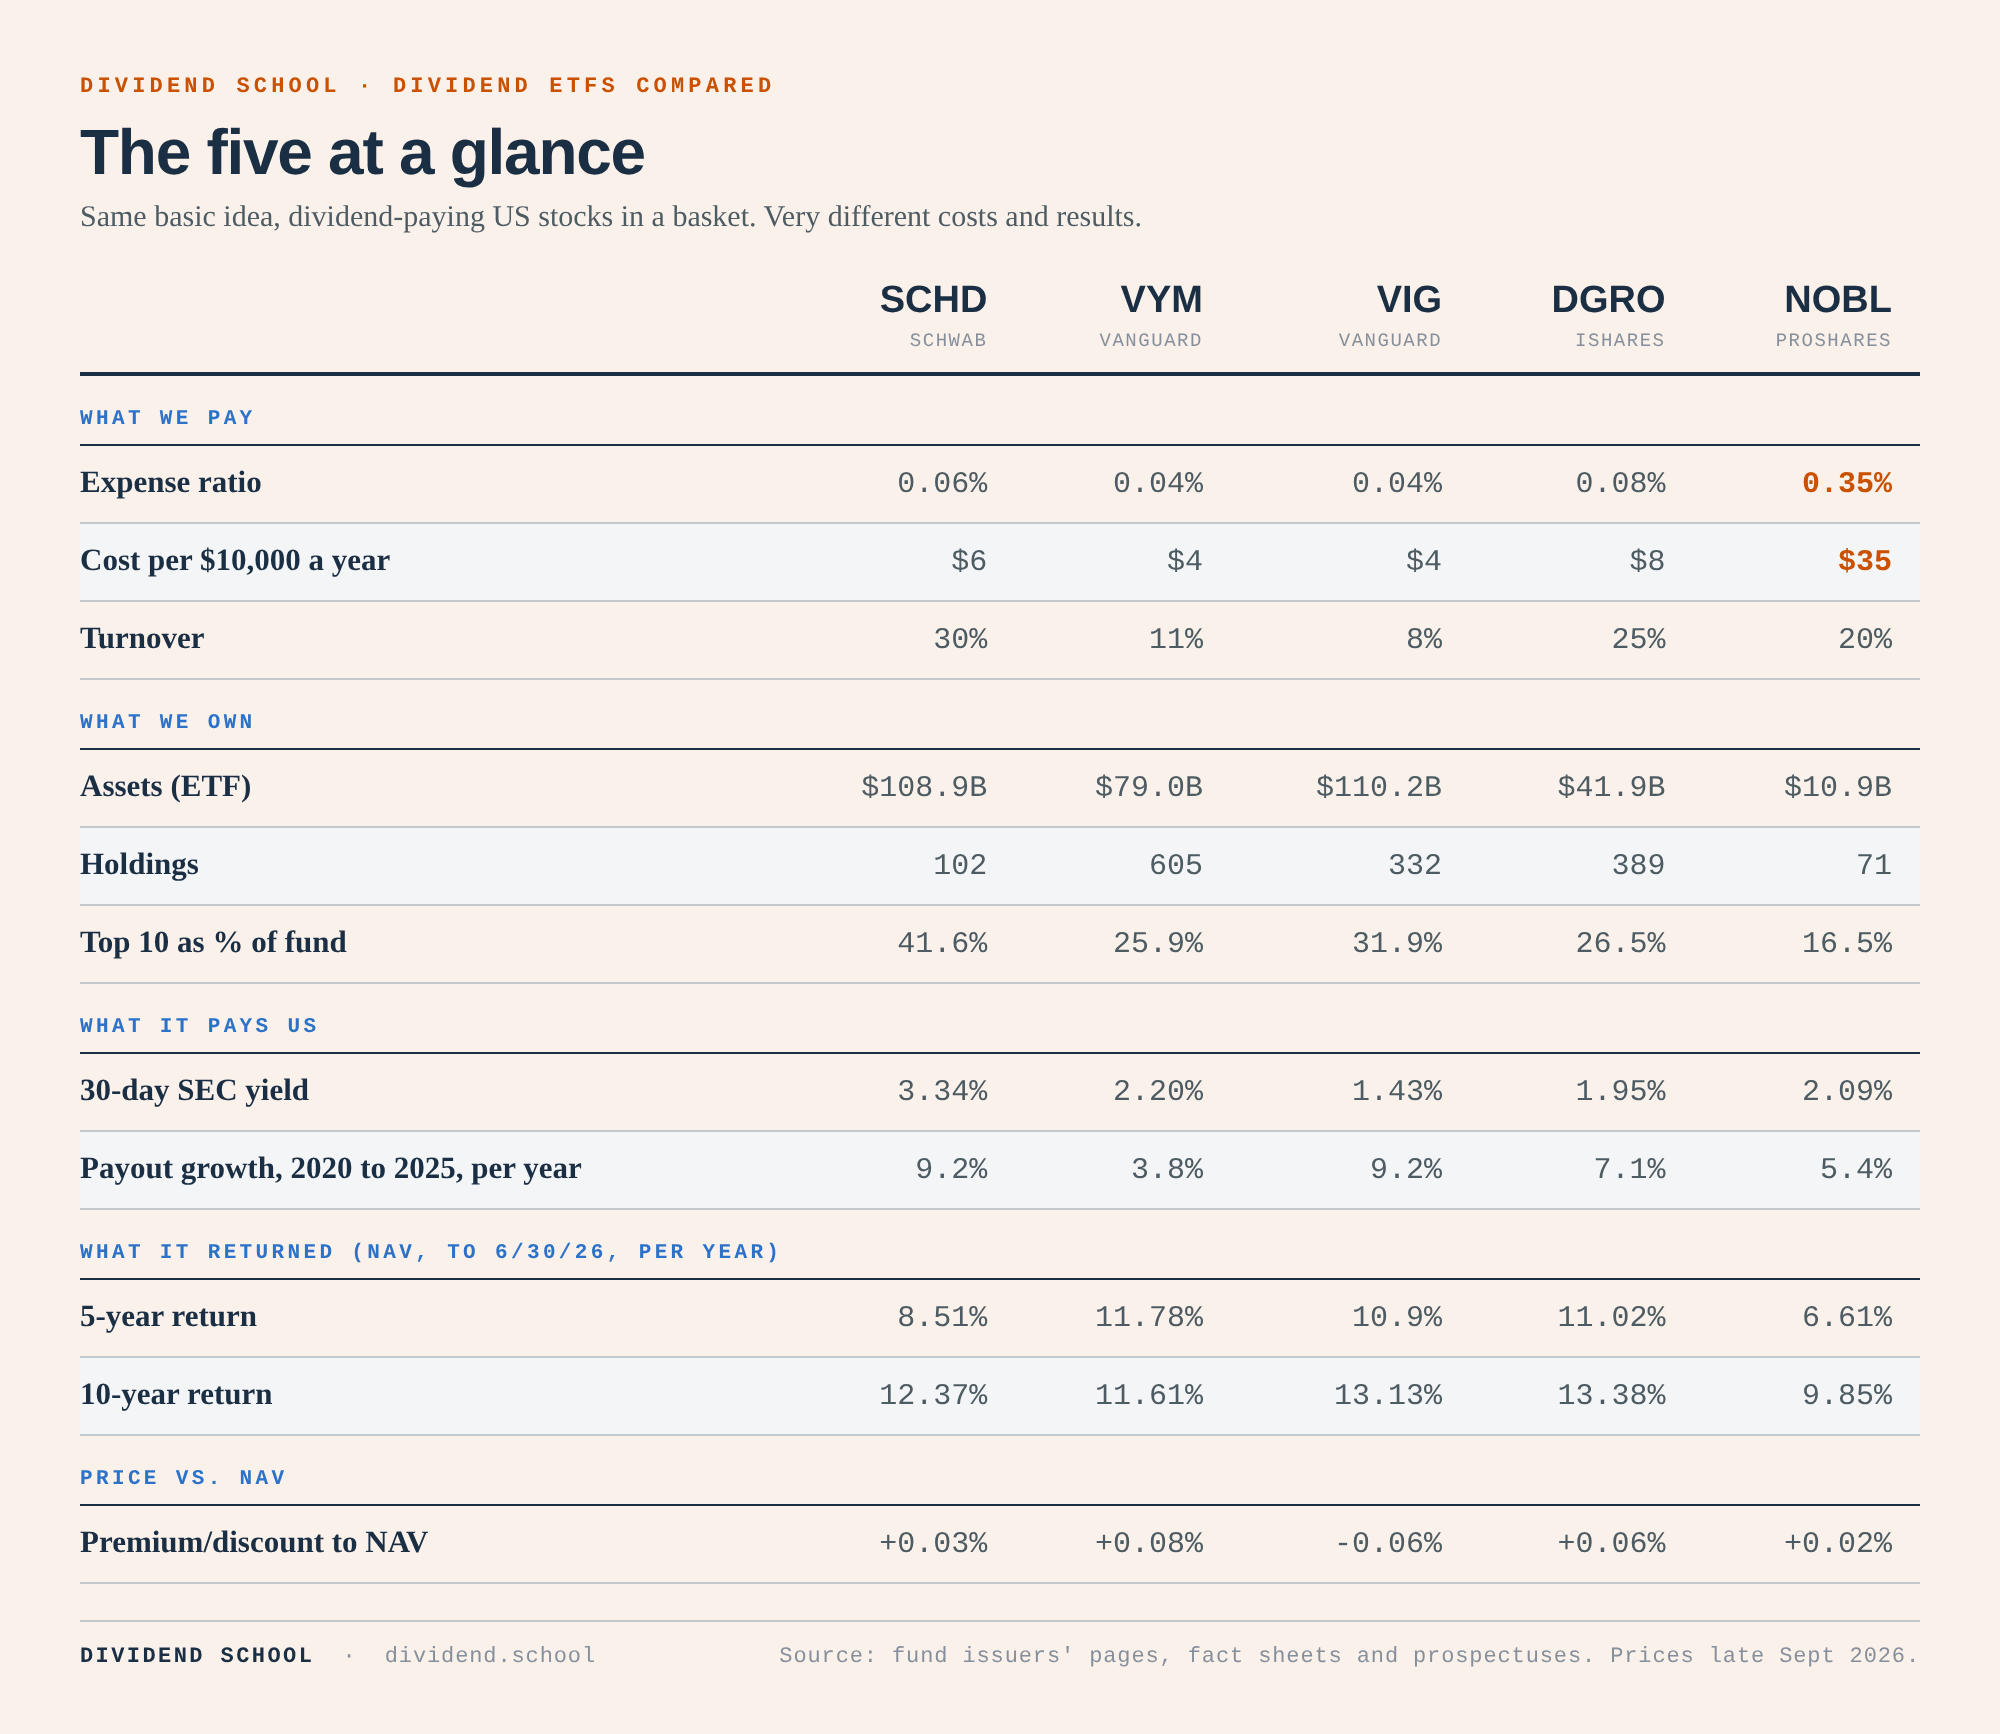
Here is the scoreboard. Every figure comes from the fund issuers’ own pages, fact sheets, and prospectuses.
What jumps out before we go fund by fund?
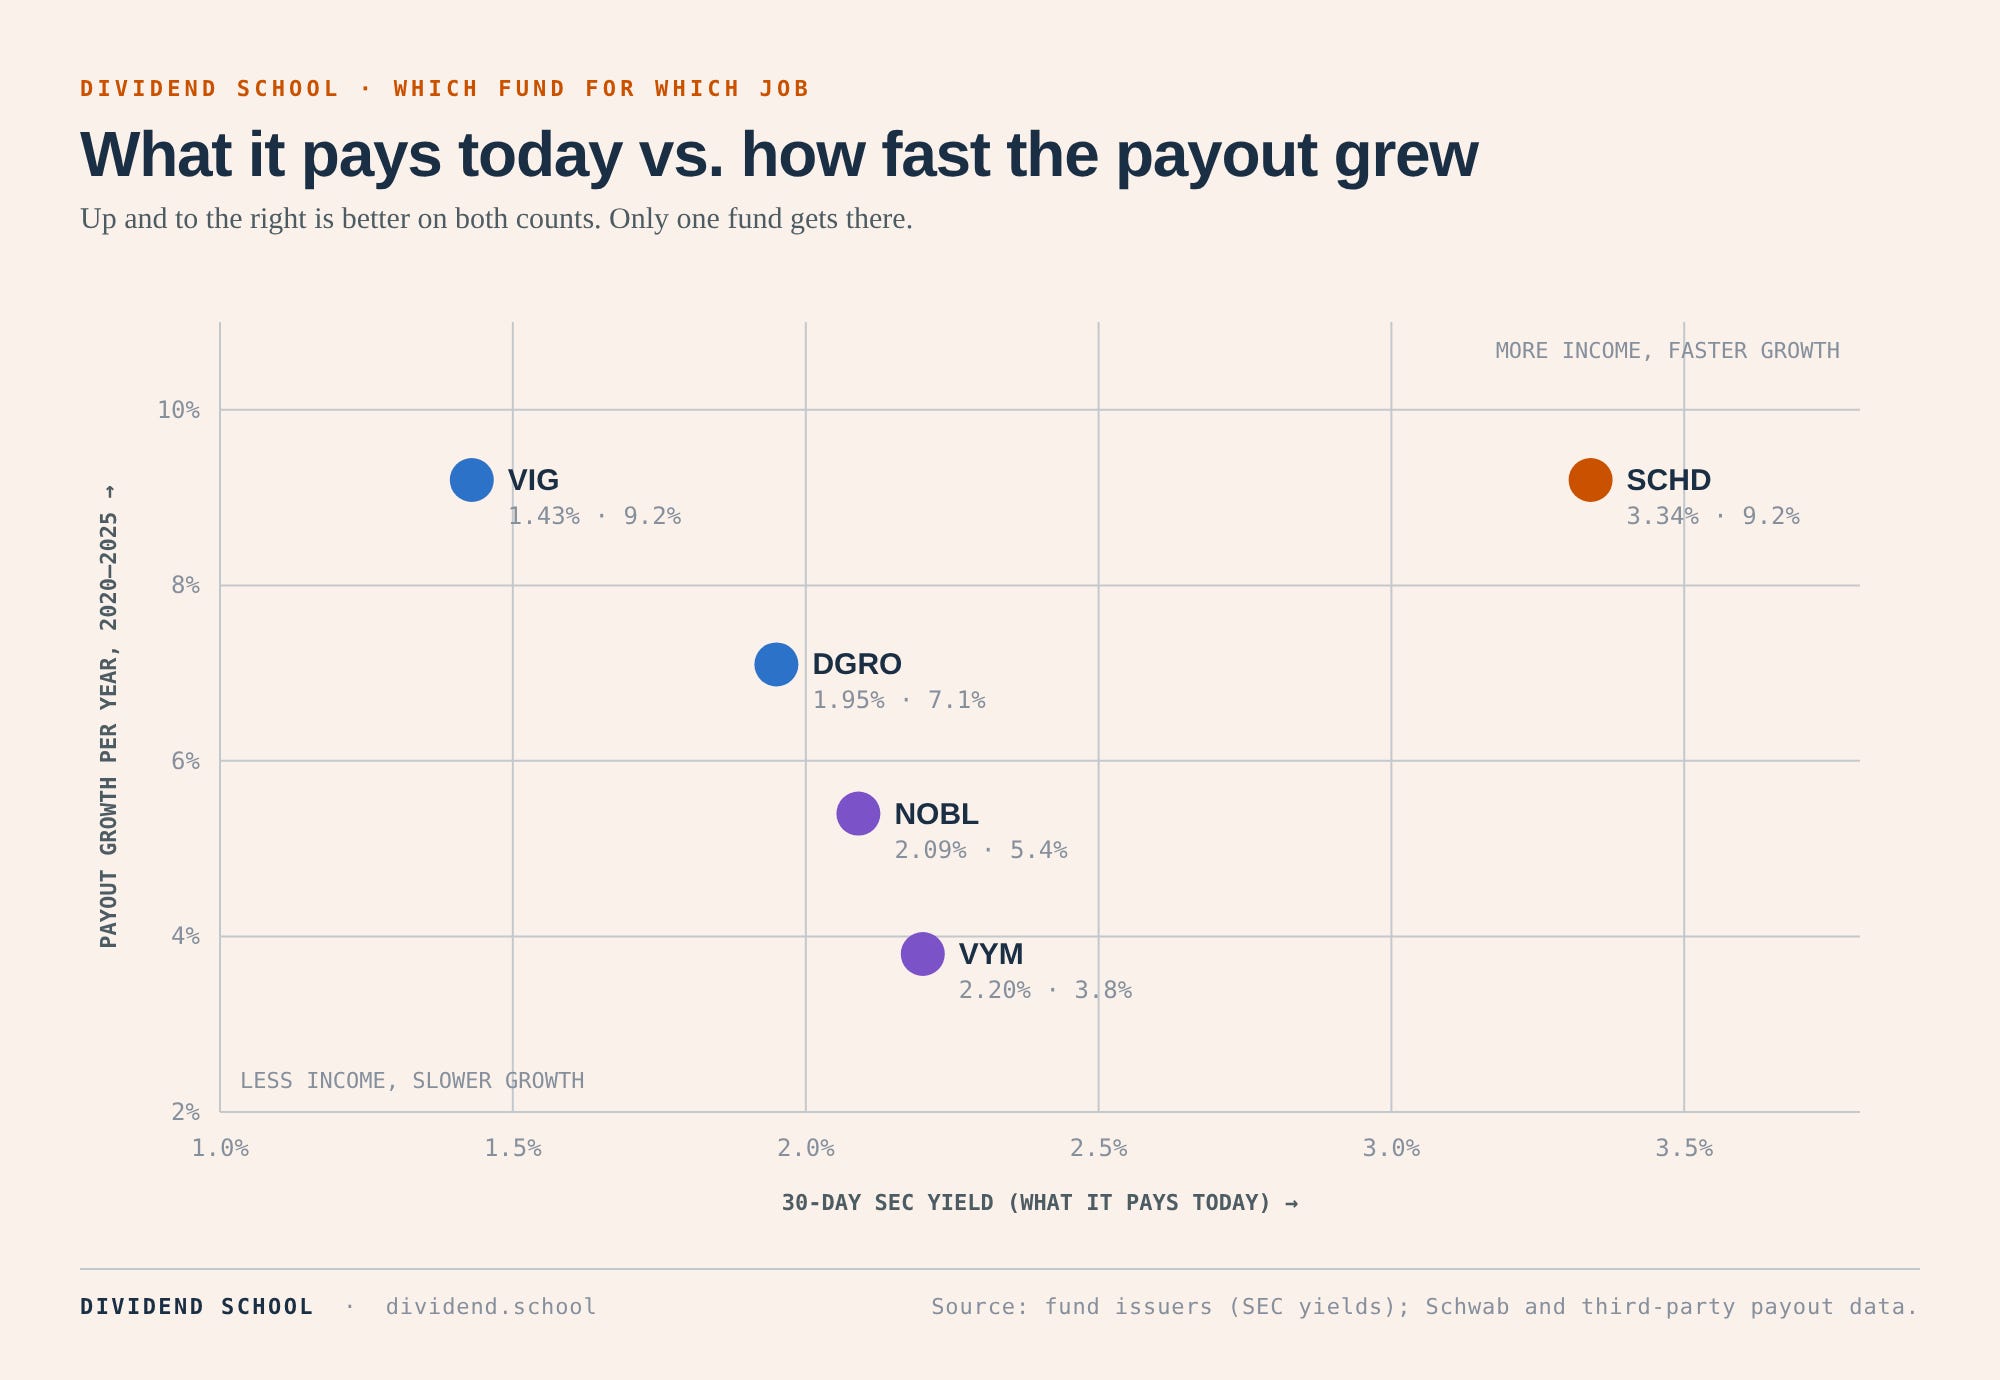
SCHD pays the most today and has grown its payout the fastest, tied with VIG.
VIG pays the least today, by a wide margin.
VYM, the fund with “High Dividend Yield” in its name, yields more than a full point less than SCHD.
NOBL costs the most and has returned the least over both five and ten years.
NAV: The Ins and Outs
NAV is net asset value. It’s the fund’s total assets minus its liabilities, divided by shares outstanding.
Put plainly, NAV is what one share of the fund is worth if we added up every stock it holds tonight.
The market price is what we pay on the exchange during the day. Those two numbers can drift apart. When the price sits above NAV, we are paying a premium. Below NAV, a discount.
So should we worry about overpaying?
Large broker-dealers called authorized participants keep the price pinned to NAV. If the ETF trades above what its stocks are worth, they create new shares and sell them; if it trades below, they buy shares and redeem them for the underlying stocks. That trade keeps the gap tiny.
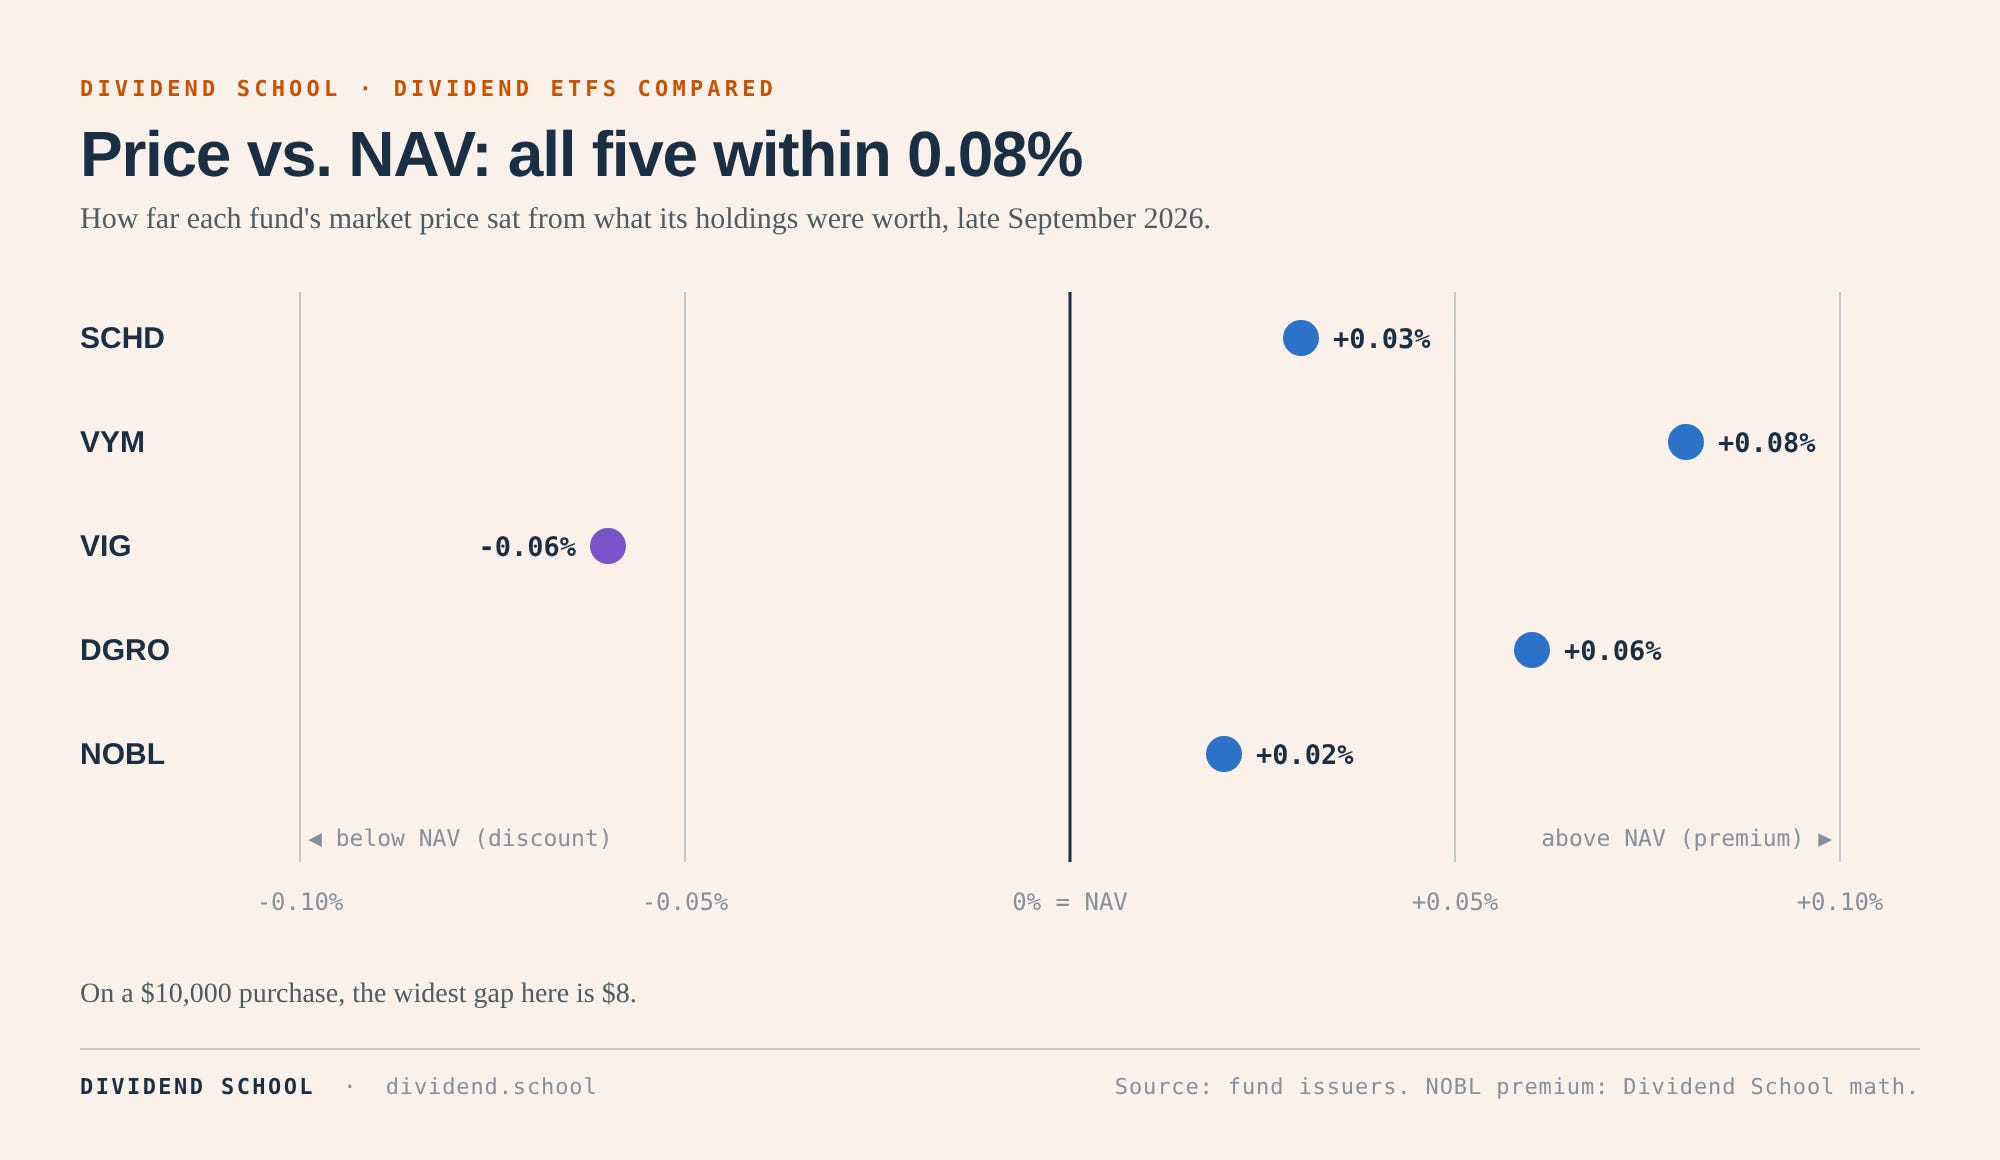
The numbers show it:
SCHD: +0.03%
VYM: +0.08%
VIG: -0.06%
DGRO: +0.06%
NOBL: +0.02%
On a $10,000 purchase, the biggest gap on the list (VYM’s 0.08%) is $8. Less than a pizza.
ETFs have to post their NAV, premium or discount, and median bid/ask spread on their website daily, before the market opens. That’s an SEC rule, and it’s worth a 30-second look before buying any fund we don’t know well. A thinly traded ETF can sit at a real premium. A closed-end fund has no creation or redemption, so its price can wander far from NAV. These five stay pinned.
So for these funds, NAV on any given day isn’t a decision factor. NAV over time is.
Where NAV earns its keep: JEPI
JEPI launched in May 2020 at a NAV of $50.00 a share. On September 30, 2026, its NAV was $56.18. Up 12.4% in a bit over six years.
Meanwhile, it paid out a lot. Its 12-month yield is 8.04%.
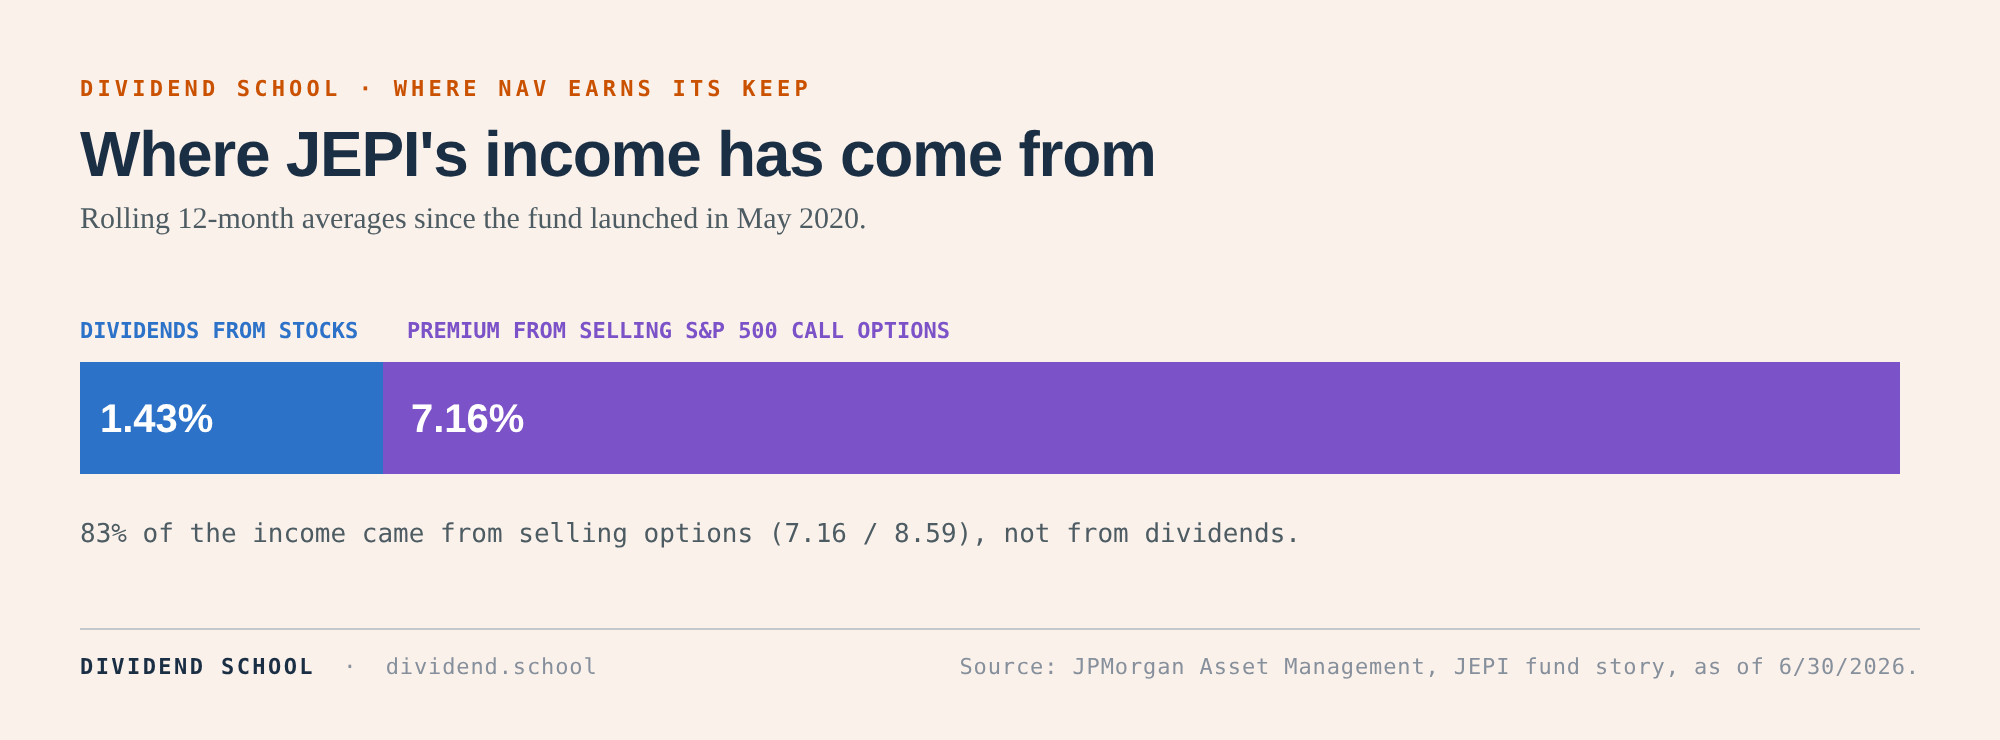
So where did the money come from? JPMorgan’s own breakdown says the 12-month dividend income has averaged 1.43% since inception, and the options premium has averaged 7.16%. Most of the check is the fund selling away the upside on the S&P 500.
What did that cost? Since inception through August 31, 2026:
JEPI at NAV: 11.25% a year
S&P 500: 18.05% a year
A bird in the hand, yes. But that is a 6.8-point gap every year.
JEPI did what it said it would do. Big monthly checks, lower volatility, slower growth. Nothing wrong with that if it’s the job we hired it for. The lesson is that a high payout and a slow-growing NAV tell us the yield came out of growth we would otherwise have kept.
When we look at any income fund, we watch both numbers together: what it pays, and what happens to NAV while it pays it. Total return is the scoreboard.
What the fees cost us
The expense ratio comes out of the fund’s assets every day. That’s exactly why it is easy to ignore.
Here’s what each fund charges on $10,000 a year (balance × expense ratio):
VYM: $10,000 × 0.04% = $4
VIG: $10,000 × 0.04% = $4
SCHD: $10,000 × 0.06% = $6
DGRO: $10,000 × 0.08% = $8
NOBL: $10,000 × 0.35% = $35
Small numbers. Does it matter?
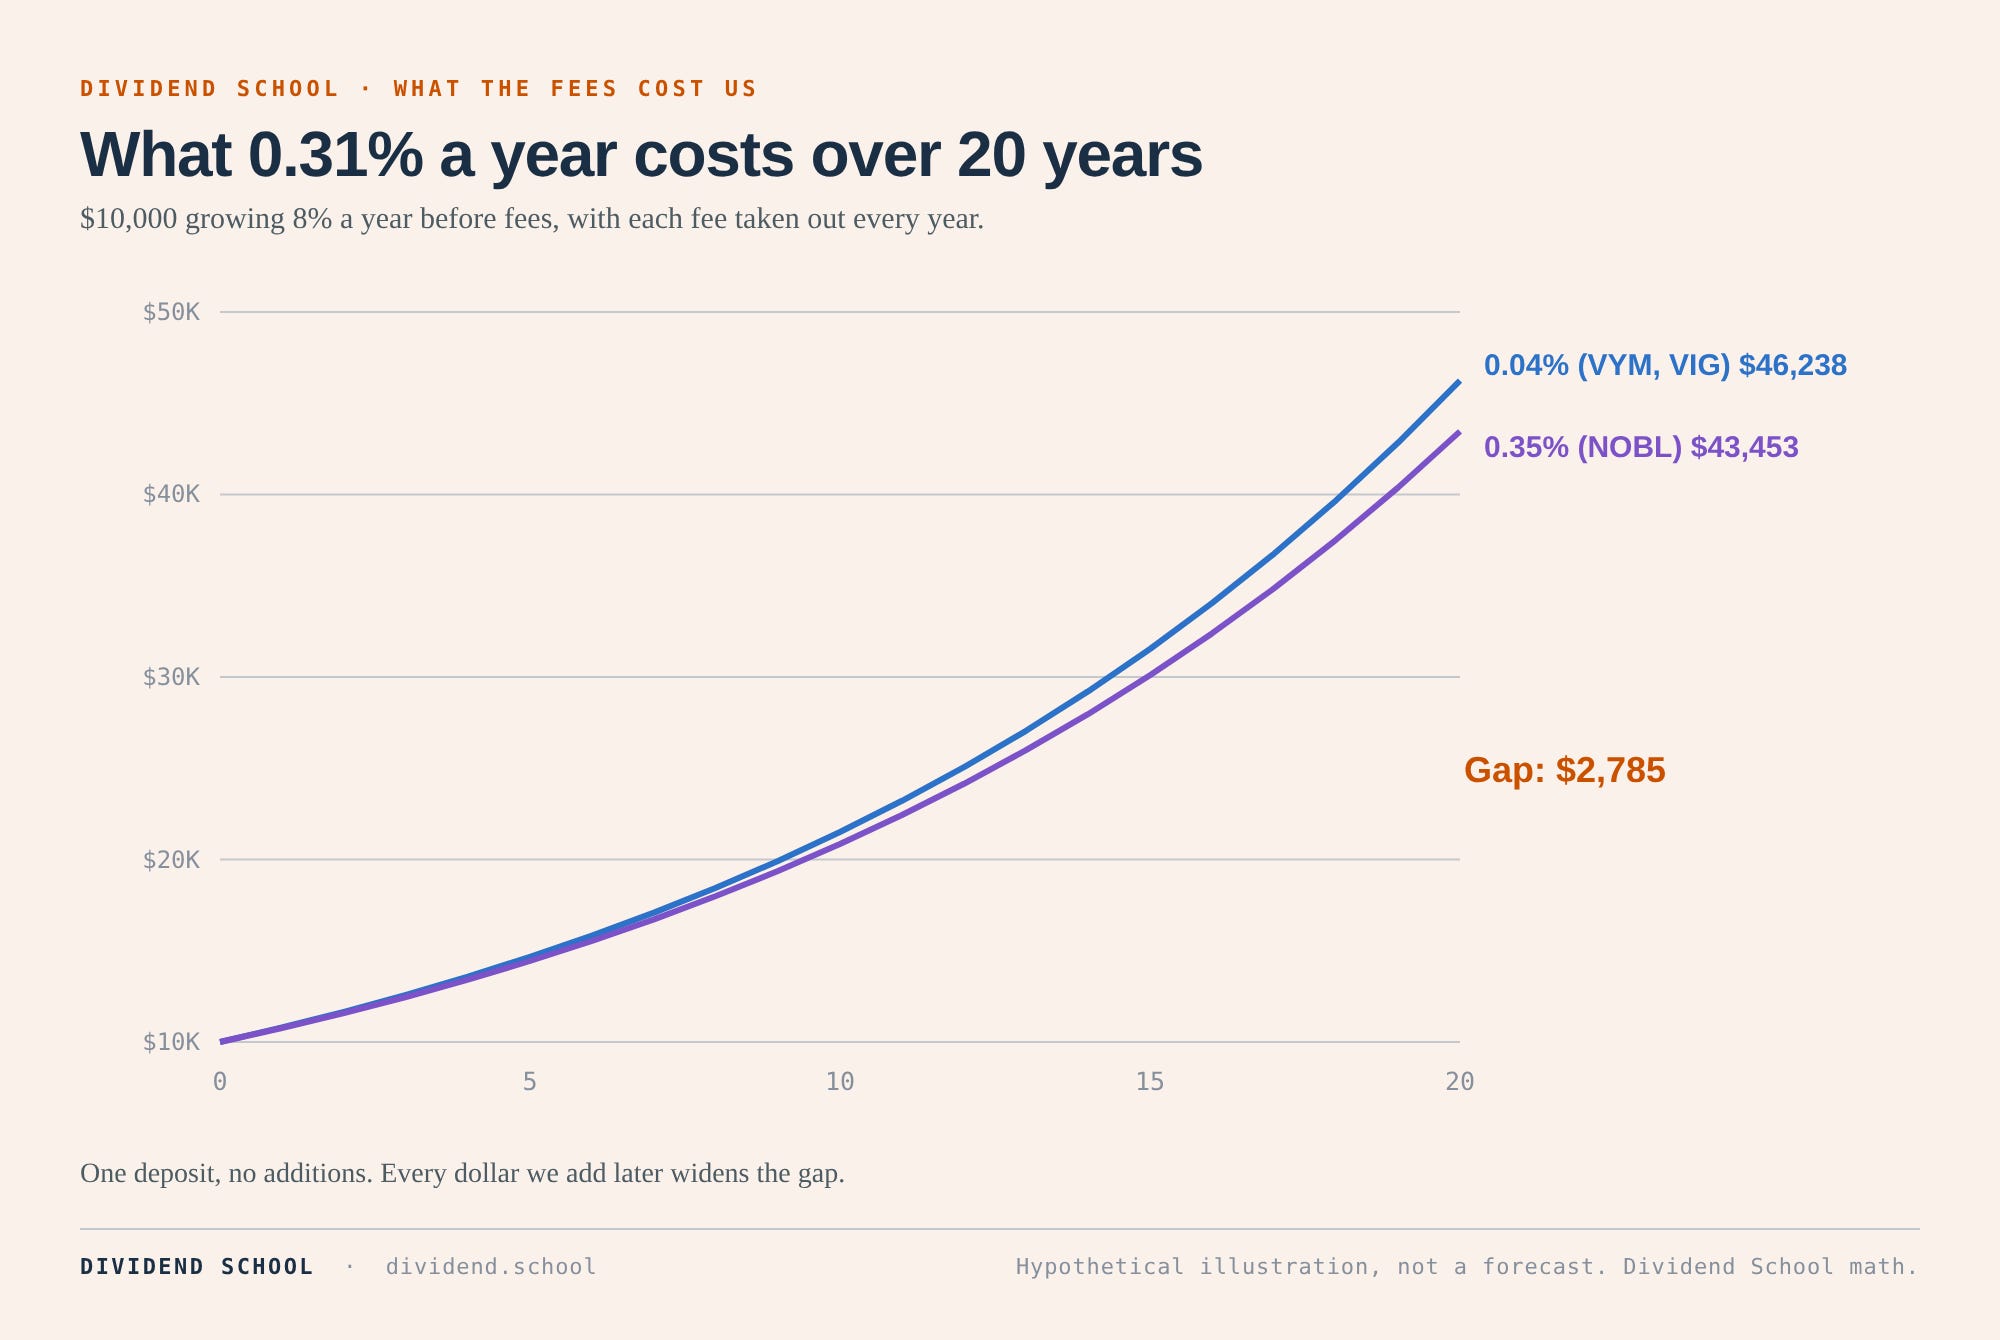
Let’s run it out. Say $10,000 grows 8% a year before fees for 20 years:
No fee at all: $46,610
At 0.04% (VYM, VIG): $46,238
At 0.35% (NOBL): $43,453
The gap between the cheapest and the priciest is $2,785. And that’s on a single $10,000 deposit. Most of us keep adding.
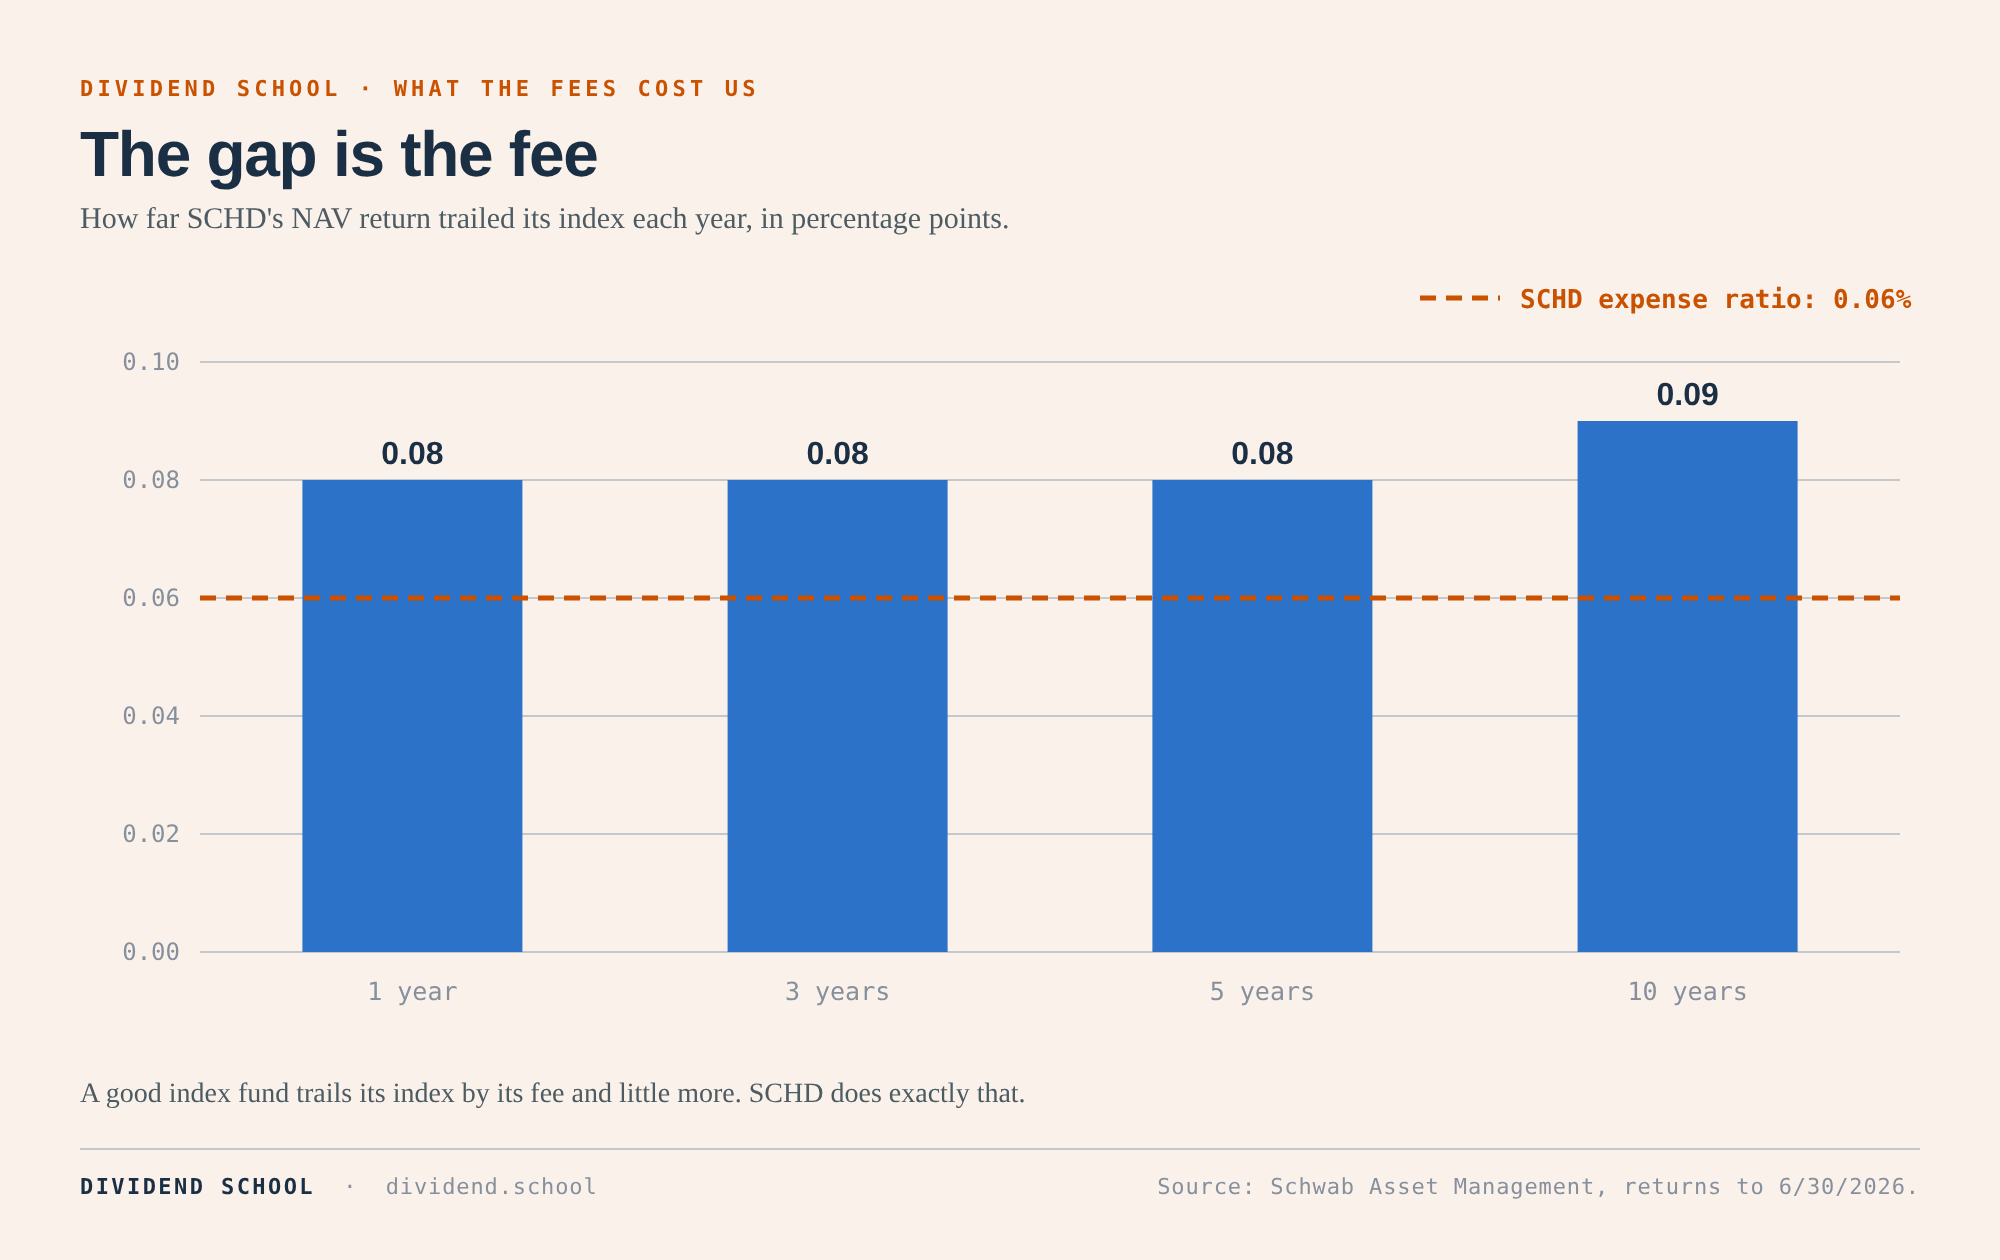
Here’s a neat trick to check any fund. Compare its return to its own index’s return. SCHD trailed its index by 0.08 to 0.09 points a year over 1, 3, 5, and 10 years. Its fee is 0.06%. The gap is the fee, almost to the penny, and that’s what a good index fund looks like.
Also worth knowing: Vanguard cut fees twice in two years. VIG went from 0.06% to 0.05% in February 2025, then to 0.04% in February 2026. VYM went from 0.06% to 0.04% in February 2026. Vanguard owns its funds, which are owned by shareholders, so cost cuts flow back to us.
The fee is not the whole story.
SCHD: Schwab U.S. Dividend Equity ETF
The crowd favorite, with $108.9 billion in assets, second only to VIG on this list.
How it picks stocks
SCHD tracks the Dow Jones U.S. Dividend 100 Index. The screen runs in four steps:
Eligibility: at least 10 straight years of dividends, $500 million in float market cap, $2 million a day in trading. No REITs.
Yield cut: rank everyone by dividend yield and keep the top half.
Quality score: rank the survivors on free cash flow to total debt, return on equity, dividend yield, and five-year dividend growth.
The top 100 by score make the index.
It weights by market cap with a cap of 4% per stock and 25% per sector, reset every quarter. The full rebuild happens every March.
Think of it as a quality screen on top of a yield screen. It’s the closest of the five to what we do by hand.
What we own
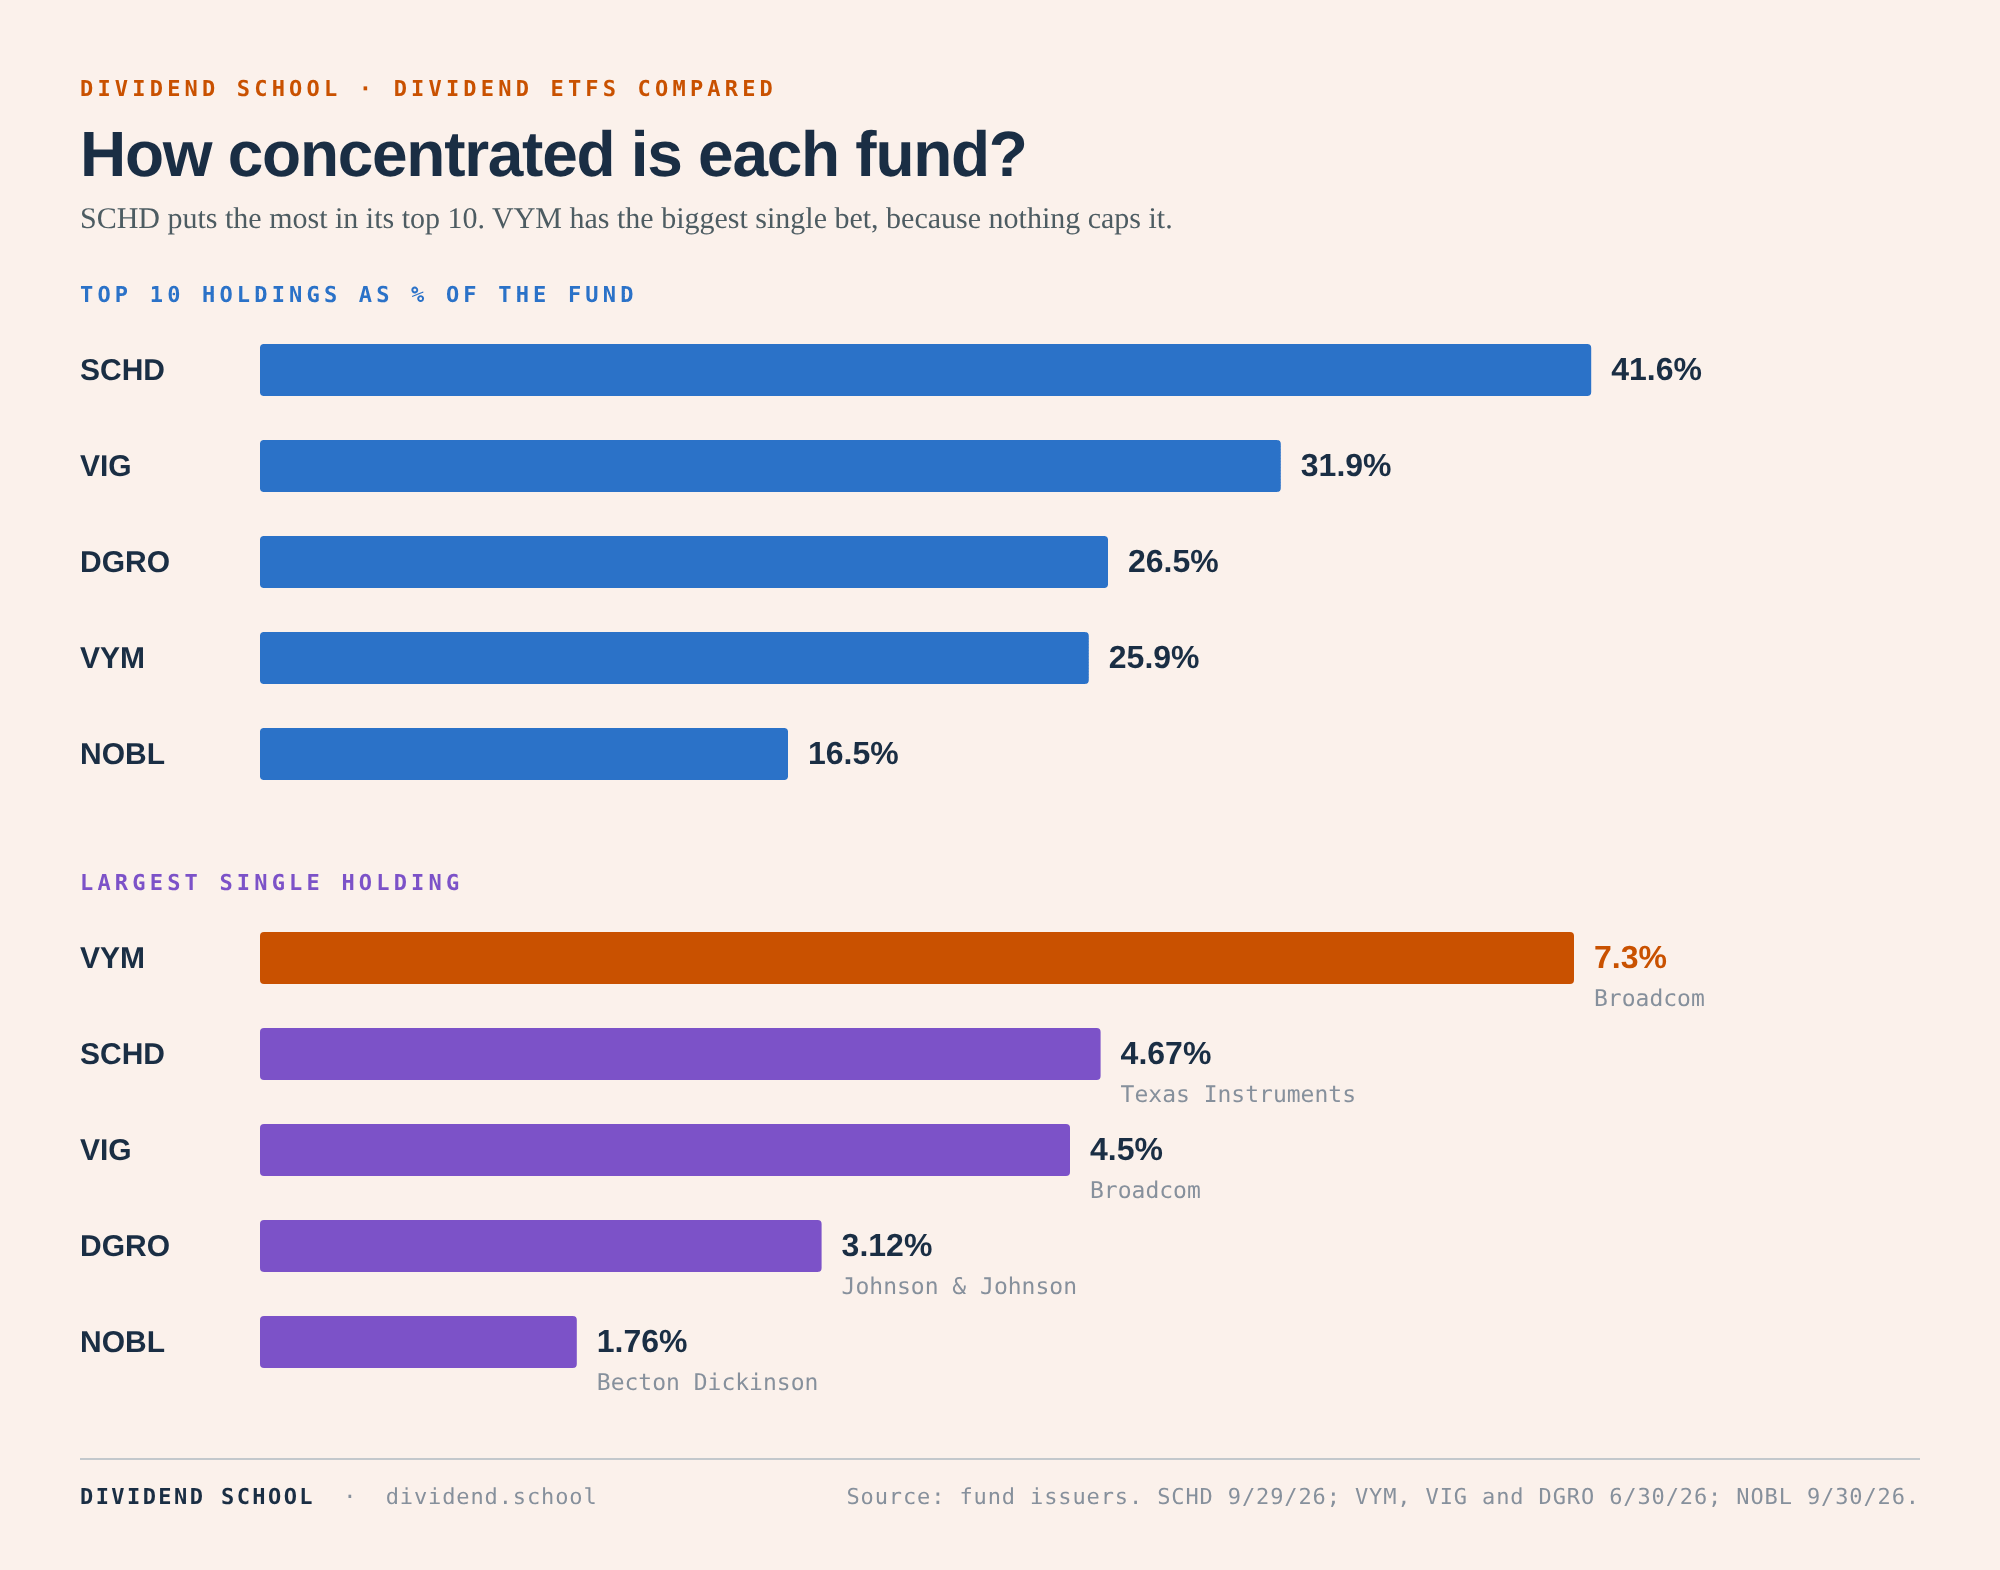
102 holdings. The top 10 make up 41.63% of the fund:
Texas Instruments: 4.67%
Qualcomm: 4.58%
Procter & Gamble: 4.24%
Merck: 4.16%
Coca-Cola: 4.16%
Chevron: 4.08%
Amgen: 4.04%
UnitedHealth: 3.96%
PepsiCo: 3.87%
Verizon: 3.87%
The biggest sectors as of June 30:
Health Care: 20.72%
Consumer Staples: 20.38%
Energy: 14.07%
Industrials: 11.55%
Financials: 10.05%
Technology is 9.23%, lighter than the market.
What it pays us
The 30-day SEC yield is 3.34%, the highest of the five. The trailing 12-month yield is 3.00%.
Why two yields? The SEC yield annualizes the portfolio's last 30 days of income after expenses, so it reflects what the fund owns today. The trailing yield looks back at what the fund paid over the last year. After a March rebuild, the SEC yield tells a different story.
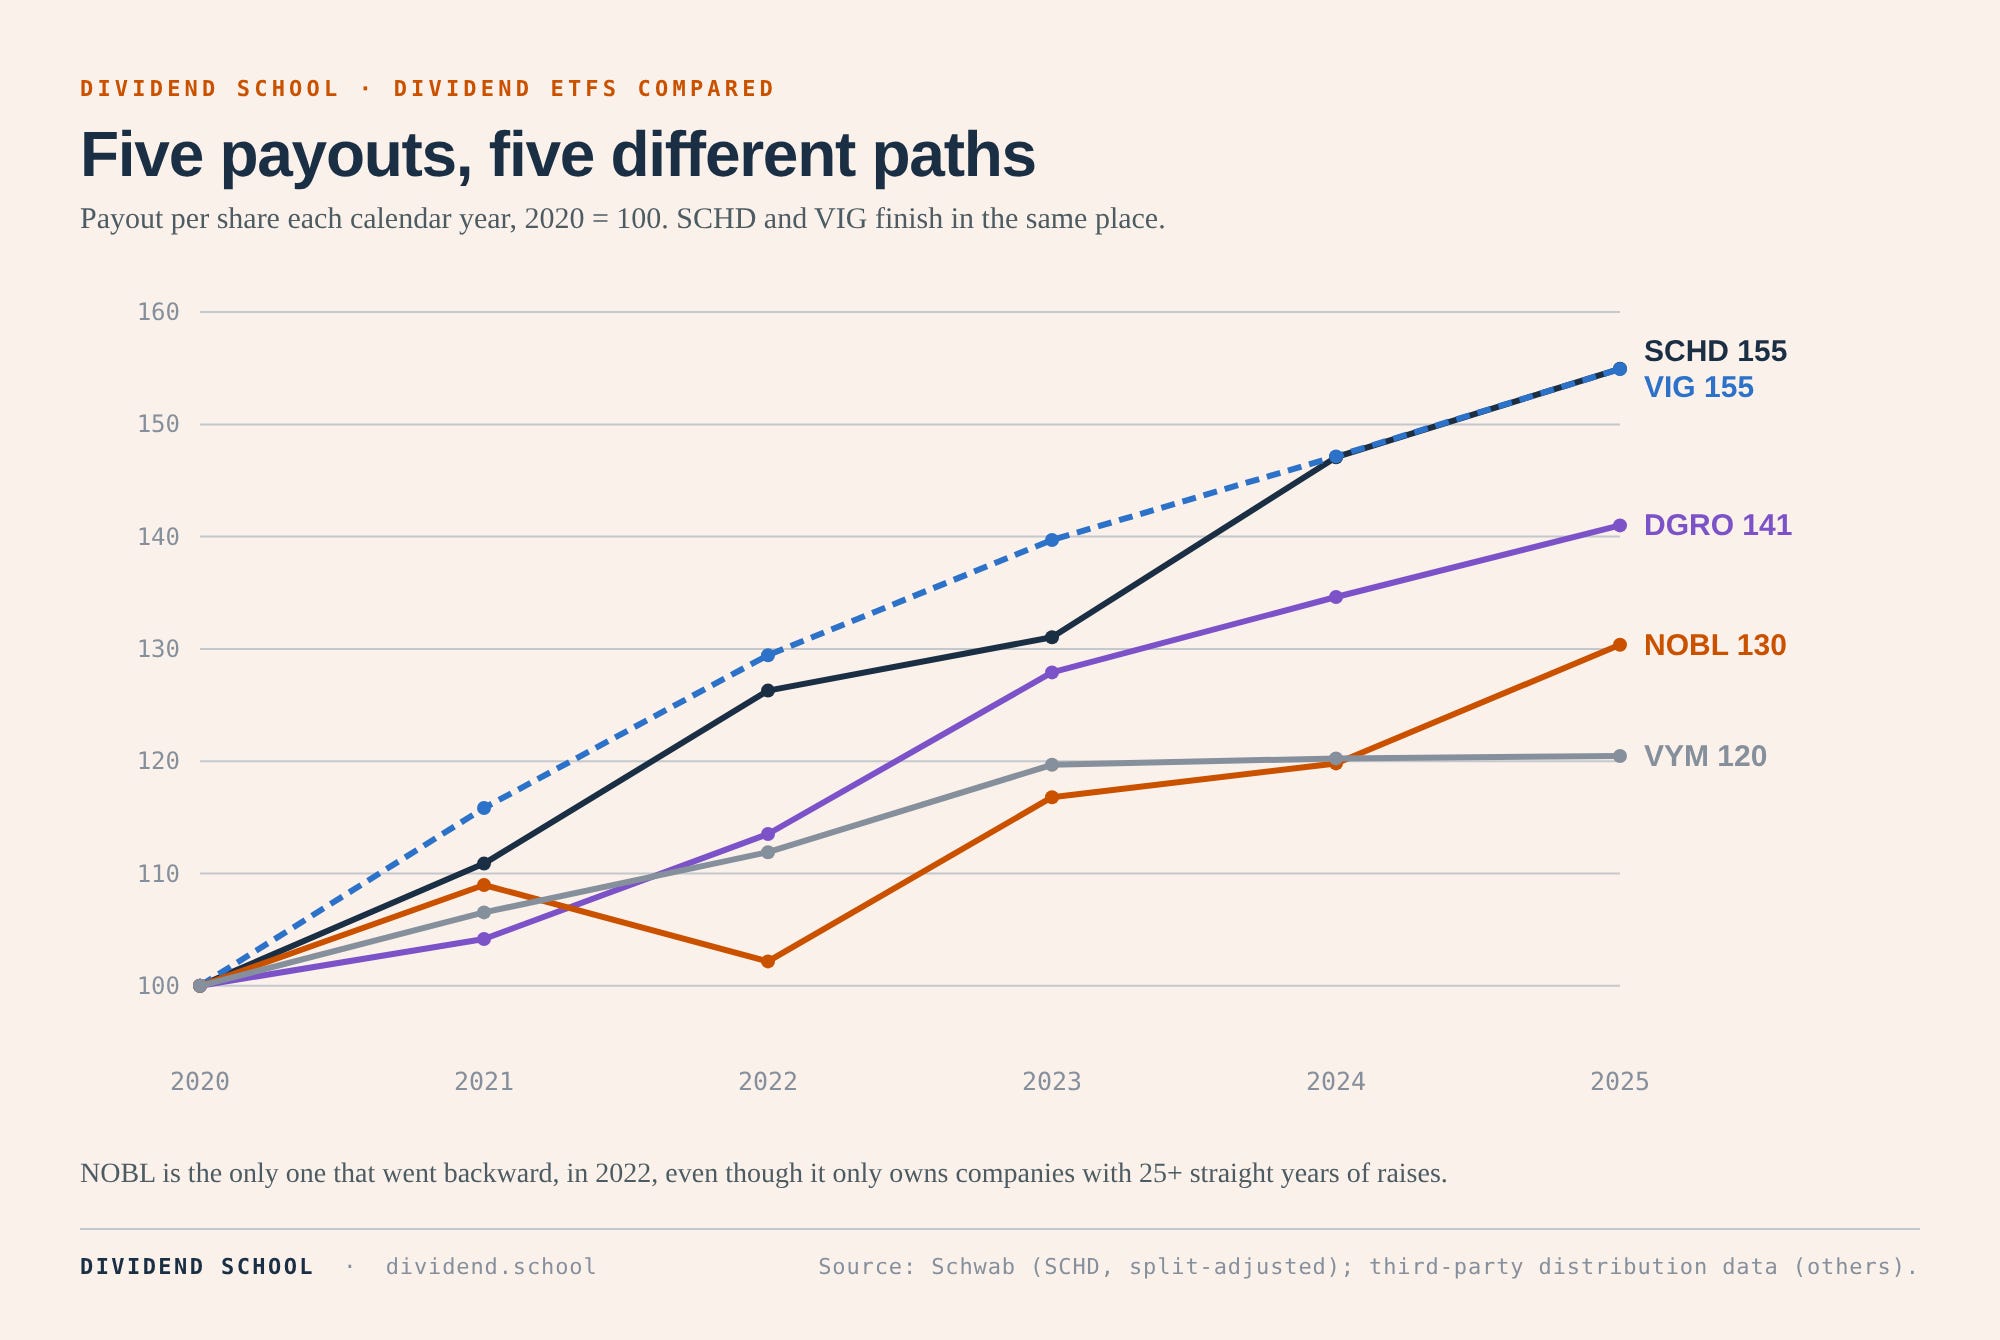
Payout per share, split-adjusted for the 3-for-1 split in October 2024:
2020: $0.6761
2021: $0.7497
2022: $0.8538
2023: $0.8860
2024: $0.9944
2025: $1.0476
That’s 9.2% a year ((1.0476 / 0.6761)^(1/5) − 1). Love the consistency of that trend, even with 2023’s slow year.
The last four payments total $1.0541, up 1.95% from the four before. Slower, and worth watching.
NAV, fees, and trading
NAV: $32.84 (September 29)
Premium: 0.03%
Median bid/ask spread: 0.03%
Expense ratio: 0.06%
Turnover: 30%
Turnover is the highest of the five. That’s the price of a screen that re-ranks every March. Schwab’s own page shows 39.6% for the fiscal year that just ended, so it’s climbing.
Returns
1 year: 24.08%
5 years: 8.51% a year
10 years: 12.37% a year
The 10-year number is solid. The five-year number trails VYM, VIG, and DGRO by 2.4 to 3.3 points a year.
Why the lag? SCHD is heavy in staples, health care, and energy, and light in tech. Tech carried the market for most of those five years. Through August, though, SCHD was up 29.2% for the year at NAV. Concentration cuts both ways.
My take
SCHD is the best income fund on this list. Highest yield, fastest payout growth, a real quality screen, and a 0.06% fee.
The trade-off is concentration. Ten stocks make up over 40% of the fund, and 30% turnover tells us the list changes a lot year to year. We are trusting the screen more here than with any of the others.
VYM: Vanguard High Dividend Yield ETF
The broadest fund here, and the cheapest, tied with VIG at 0.04%. $79.0 billion in the ETF share class and $96.2 billion across all share classes.
How it picks stocks
VYM tracks the FTSE High Dividend Yield Index:
Start with the FTSE US All Cap Index, large, mid, and small companies.
Remove REITs.
Remove anything that doesn’t pay a dividend or isn’t expected to pay one over the next 12 months.
Rank by forecast dividend yield and keep the above-average yielders.
Weight by market cap. No single-stock cap.
Most of the funds here cap any one stock at 3% or 4%. VYM doesn’t, and its top holdings list shows it.
What we own
605 holdings. The top 10 make up 25.9%:
Broadcom: 7.3%
JPMorgan Chase: 3.4%
Johnson & Johnson: 2.5%
Exxon Mobil: 2.4%
Caterpillar: 2.0%
Cisco: 1.9%
AbbVie: 1.8%
Bank of America: 1.6%
UnitedHealth: 1.6%
Home Depot: 1.5%
Broadcom at 7.3% of a high-yield fund? Yes. It pays a dividend, it made the yield cut, and it’s one of the biggest companies in the market. With market-cap weighting, size decides the weight; that’s great for returns and not so great for the yield.
The biggest sectors as of June 30:
Financials: 20.6%
Technology: 14.6%
Industrials: 14.4%
Health Care: 12.4%
Consumer Staples: 8.5%
Energy: 8.5%
What it pays us
The 30-day SEC yield is 2.20%. On a trailing basis, the last four payments total $3.6755 per share. Divided by the September 30 NAV of $155.12, that’s 2.37%.
Payout per share by year:
2020: $2.9061
2021: $3.0961
2022: $3.2518
2023: $3.4780
2024: $3.4945
2025: $3.5008
That’s 3.8% a year, the slowest of the five. And look at the last three years. Nearly flat.
NAV, fees, and trading
NAV: $155.12 (September 30)
Premium: 0.08%
Expense ratio: 0.04%, cut from 0.06% in February
Turnover: 11%
Returns
1 year: 21.52%
5 years: 11.78% a year, the best of the five
10 years: 11.61% a year
My take
So is VYM an income fund?
VYM is a broad, dirt-cheap way to own the higher-yielding end of the US market. Over five years, its returns beat everything else here.
But it’s not the income fund its name suggests. SCHD yields more today, and SCHD’s payout grew more than twice as fast. VYM is a value fund that happens to pay dividends. Nothing wrong with that; we just need to know what we’re buying.
That’s two complete workups free, plus the scoreboard, the NAV lesson, and the fee math.
The two funds I’ve written up so far are opposites. One pays 3.34% from 102 stocks. The other is called “High Dividend Yield,” holds 605 stocks, and yields 2.20% because its largest holding is Broadcom. Which one fits depends on the job we hire it for.
Below the line:
The fund with the best 10-year record of the five, 13.38% a year, for 0.08%.
The cheapest growth fund here, which intentionally throws out the top 25% of yielders. Its payout grew as fast as SCHD’s.
The 0.35% fund, and why I’d pass on it.
Which fund I’d use for which job: income now, income later, and the one fund I’d own if I could only own one.
Members, keep scrolling. Everyone else, seven days free. Membership is $369 a year or $35 a month, with a 30-day money-back guarantee.