

You’ve learned the basics of financial statement analysis. You can calculate a P/E ratio in your sleep. But here’s the challenge most intermediate investors face: knowing what numbers to look at doesn’t tell you whether you’re analyzing a great business or just a mediocre one with decent financials.
The difference between a good investment and a great one often comes down to business quality, and business quality isn’t just about the numbers on a balance sheet. It’s about competitive positioning, scalability, management competence, and resilience.
I’ve analyzed hundreds of companies over 13 years of investing, and I’ve distilled what separates exceptional businesses from the rest into 10 essential questions. These aren’t theoretical exercises, they’re practical filters you can apply to any company in under an hour.
We’ll use Mastercard (MA) as our running example because it’s a business quality masterclass. By the end, you’ll have a reusable framework for evaluating any company in your portfolio or watchlist.
The Framework: Three Pillars of Business Quality
Before we dive into the questions, understand that exceptional businesses excel across three dimensions:
Competitive Advantages (Questions 1-3): What protects this business from competition?
Economic Characteristics (Questions 4-7): How efficiently does it convert growth into profits?
Resilience & Adaptation (Questions 8-10): Can it survive disruption and capital allocation mistakes?
Let’s examine each question with Mastercard as our guide.
PILLAR 1: Competitive Advantages
Question 1: Does the Business Have Pricing Power?
Why it matters: Pricing power is the ultimate test of a moat. If a company can raise prices without losing customers, it’s not competing primarily on price; it’s delivering unique value.
How to assess it:
Review historical price increases in earnings call transcripts
Compare revenue growth to volume growth (revenue growing faster = pricing power)
Check what happened during economic downturns
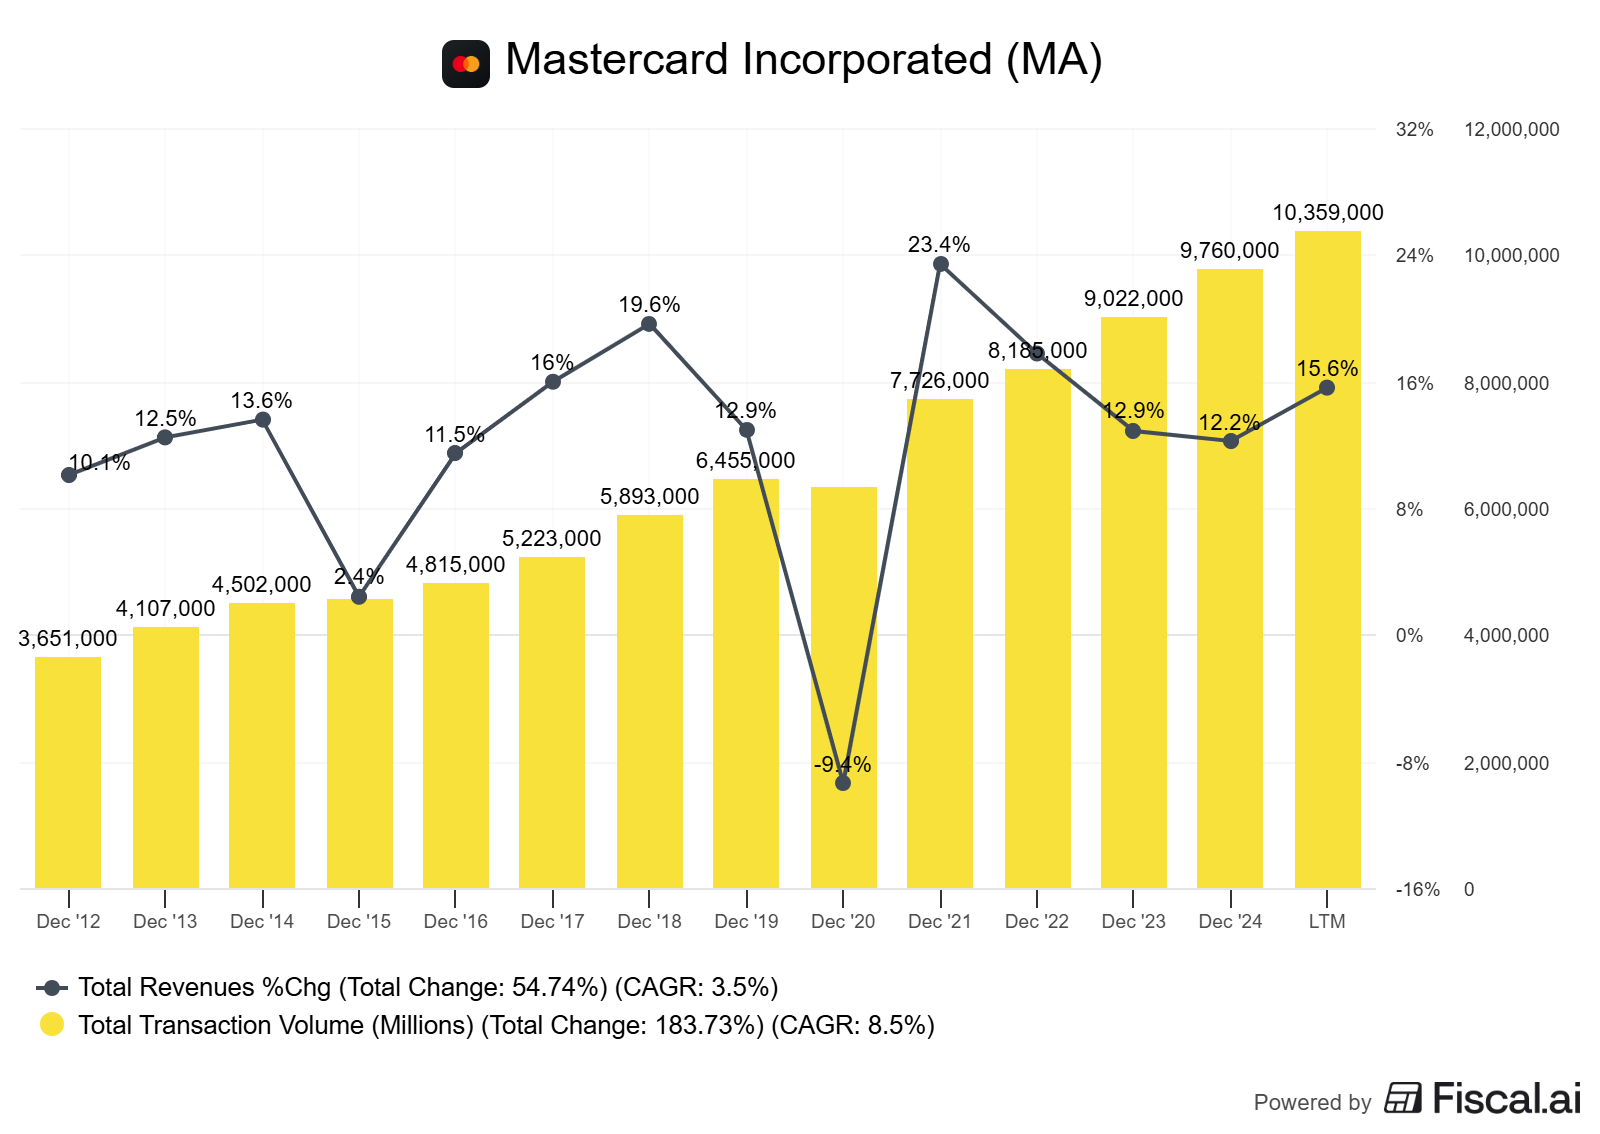
Mastercard example: Mastercard demonstrates clear pricing power. In 2024, gross dollar volume grew 11% (on a local currency basis) while net revenue grew 13% on a currency-neutral basis. This 2-percentage-point gap between volume and revenue growth indicates successful pricing improvements and revenue optimization. The company maintained this pricing discipline even as it processed 159.4 billion switched transactions globally, an 11% increase year-over-year.
What good looks like: Consistent ability to raise prices 2-5% annually without volume declines.
What bad looks like: Revenue growing more slowly than units sold, or an aggressive competitor's pricing forcing discounts.
Question 2: Are Customers Sticky? What Are the Switching Costs?
Why it matters: Customer retention is cheaper than acquisition. High switching costs mean predictable revenue and pricing power.
How to assess it:
Look for multi-year contracts or subscription models
Identify integration complexity (technical, operational, or habitual)
Check customer concentration and churn rates (if disclosed)
Mastercard example: Mastercard doesn’t sell to consumers; it serves financial institutions. Once a bank issues Mastercard-branded cards, switching to Visa requires:
Reissuing millions of cards
Retraining staff on new systems
Potentially losing customers who prefer Mastercard acceptance
Renegotiating merchant relationships
The result? Banks rarely switch networks. Mastercard had 3.5 billion cards issued globally as of December 2024, and major issuer relationships are exceptionally stable.
What good looks like: Customer retention >95%, contracts >3 years, or mission-critical integration.
What bad looks like: Annual contracts, easy product substitution, high churn rates.
Question 3: Is the Moat Widening or Narrowing?
Why it matters: A static moat eventually erodes. The best businesses strengthen their advantages over time through network effects, scale economies, or data accumulation.
How to assess it:
Track market share trends over 5+ years
Look for evidence of increasing returns to scale
Monitor competitive threats and company responses
Mastercard example: Mastercard’s network effect strengthens annually. More cardholders attract more merchants. More merchants attract more cardholders. Their global acceptance network now spans approximately 150 million merchant locations. Meanwhile, they’re layering on new moats:
Tokenization (approximately 30% of transactions now tokenized)
Contactless payments (approximately 70% of in-person switched transactions)
Cybersecurity services (including the 2024 Recorded Future acquisition)
Cross-border payment infrastructure (cross-border volume up 18% in 2024)
What good looks like: Market share gains, increasing product stickiness, expanding into adjacent services.
What bad looks like: market-share erosion, new entrants capturing growth, and defensive pricing.
PILLAR 2: Economic Characteristics
Question 4: Can the Business Scale Without Proportional Cost Increases?
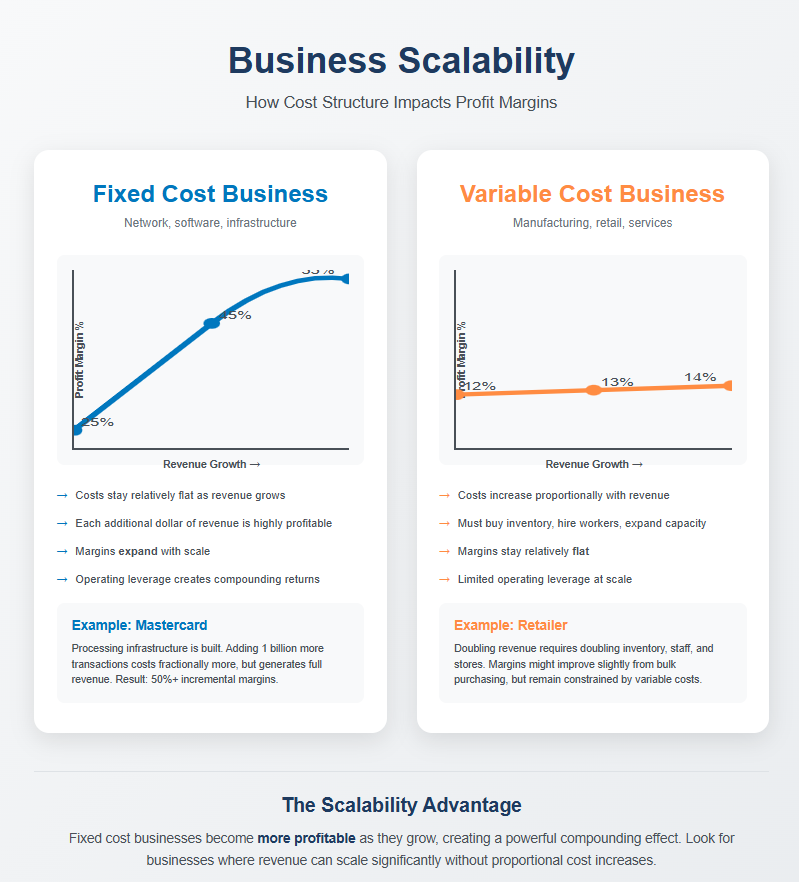
Why it matters: Scalability determines the trajectory of profit margins. The best businesses have high incremental margins—each new dollar of revenue is more profitable than the last.
How to assess it:
Calculate incremental margins: (Change in revenue ÷ Change in operating income)
Review operating leverage trends (revenue growing faster than expenses)
Identify fixed vs. variable cost structure
Mastercard example: Mastercard’s network infrastructure is largely fixed cost in nature. In 2024:
Net revenue increased from $25.1B to $28.2B (+$3.1B or +12%)
Operating income increased from $14.0B to $15.6B (+$1.6B or +11%)
Incremental operating margin = approximately 52%
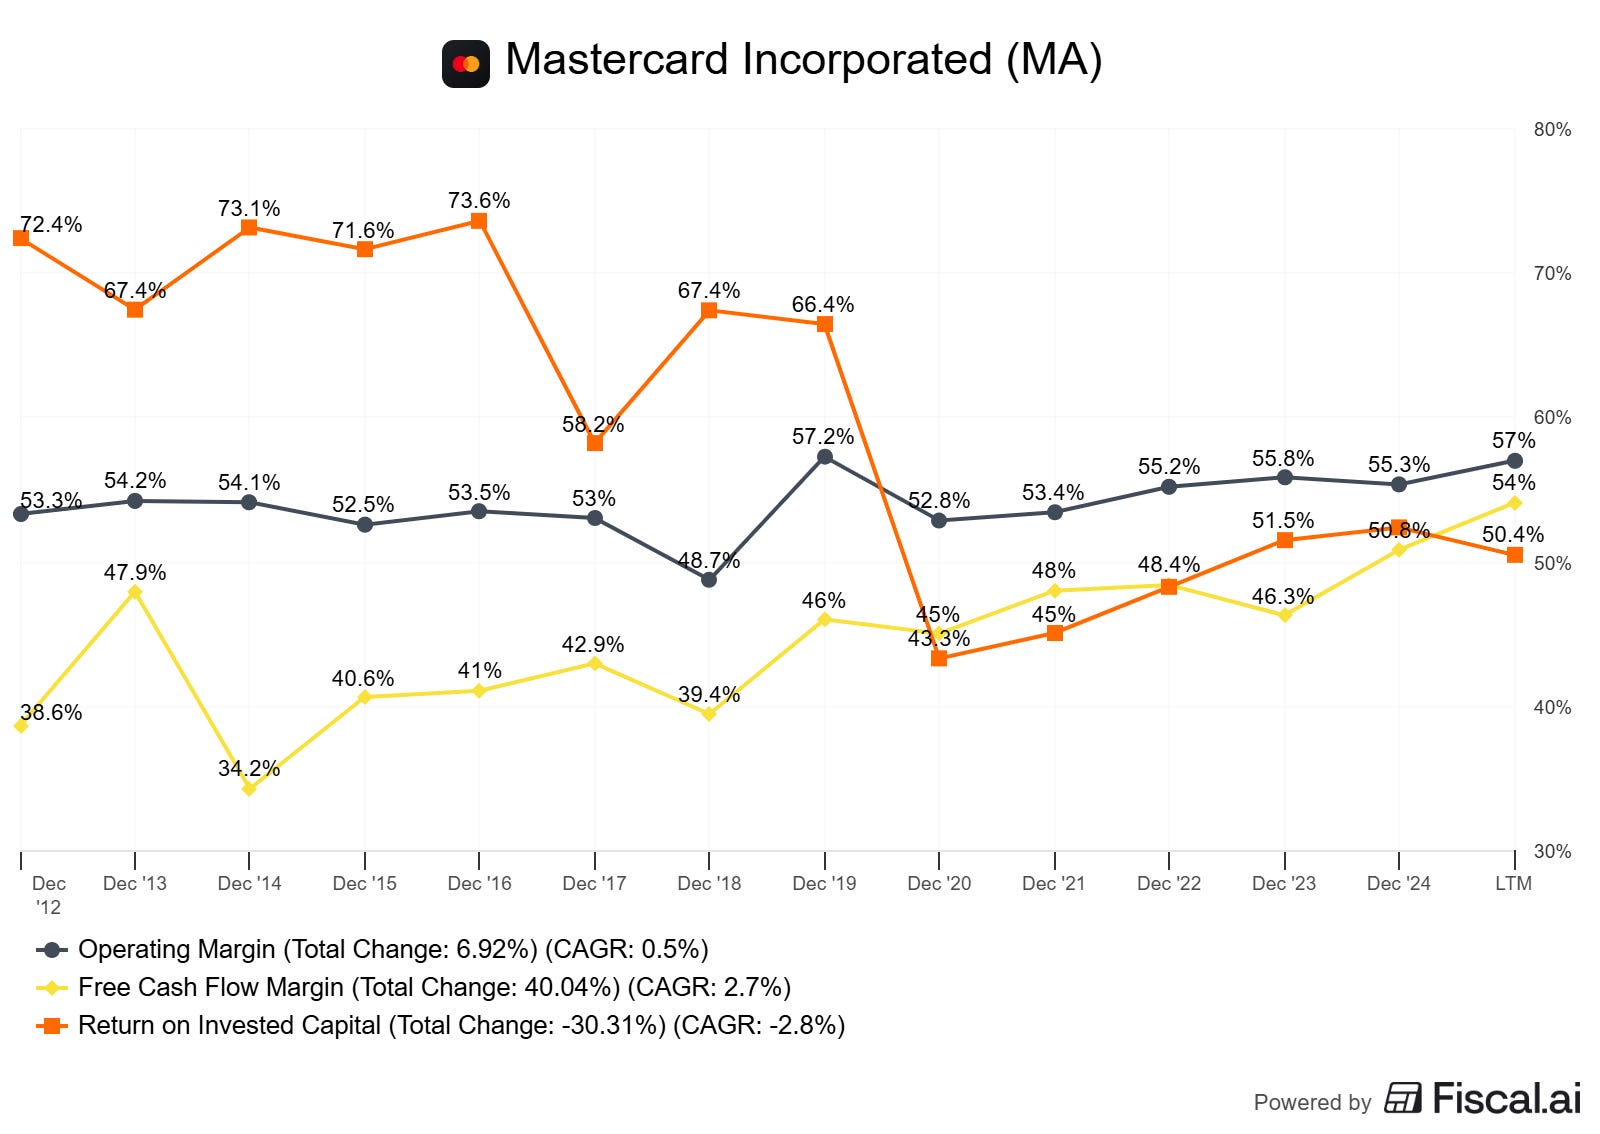
Operating margin remained stable at approximately 55-56% despite significant investments in technology and new capabilities, demonstrating exceptional scalability.
What good looks like: Incremental margins >50%, expanding operating margins during growth.
What bad looks like: Margins flat or declining with growth, high variable costs.
━━━━━━━━━━━━━━━━━━━━━━━━━━━━━━━━━━━━━━━━━━━━━━
You’ve just learned how to evaluate competitive advantages, the foundation of business quality analysis. But competitive advantages alone don’t tell the complete story.
The next five questions reveal where most investors miss critical red flags:
📊 Pillar 2: Economic Characteristics
→ The scalability test that separates compounders from pretenders
→ Why Mastercard’s 52% incremental margins matter more than revenue growth
→ How to spot the customer concentration risk that killed [insert example]
→ The ROIC threshold that reveals true capital efficiency
🛡️ Pillar 3: Resilience & Adaptation
→ The capital allocation patterns that signal exceptional management
→ How to identify existential threats before the market does
→ Real examples of adaptability (and catastrophic failures to adapt)
Plus: Get the one-page printable checklist to analyze any company in 15 minutes, formated for printing or digital use.
Join 17,000+ investors who get my weekly deep dives on all things investing and finance.
Question 5: What’s the Return on Invested Capital Trend?
Why it matters: ROIC tells you how efficiently a company converts investment into profits. A high and rising ROIC indicates the business generates cash without significant reinvestment.
How to assess it:
Calculate ROIC = NOPAT ÷ Invested Capital
Track 5-year trend (rising, stable, or falling)
Compare to the cost of capital (ROIC should exceed 10-15%)
Mastercard example: Mastercard’s ROIC has consistently exceeded 40% in recent years, with 2023 figures at approximately 43% and 2024 maintaining similar levels. This exceptional return happens because:
Network infrastructure doesn’t require proportional reinvestment
Capital expenditures run approximately 4% of revenue ($1.2B on $28.2B revenue in 2024)
Working capital needs are minimal
For every dollar Mastercard invests in its business, it generates over 40 cents of annual profit.
What good looks like: ROIC >15%, stable or rising, well above cost of capital.
What bad looks like: ROIC < 10%, declining trend, barely exceeding the cost of capital.
Question 6: Is Revenue Growth Profitable Growth?
Why it matters: Growth at the expense of profitability destroys value. You want businesses that grow revenue while maintaining or expanding margins.
How to assess it:
Compare the revenue growth rate to the free cash flow growth rate
Track gross margin and operating margin trends
Watch for “growth investments” that never pay off
Mastercard example: In 2024, Mastercard grew net revenue 13% (currency-neutral) while free cash flow reached approximately $13.6 billion, a 25% increase from 2023’s $10.9 billion. Operating cash flow was $14.8 billion in 2024, up from $12.0 billion in 2023. The company maintained operating margins around 55-56% while investing heavily in technology. Growth is entirely self-funding.
What good looks like: FCF growing at or faster than revenue, stable/expanding margins.
What bad looks like: Revenue growth funded by margin compression, cash burn, or excessive debt.
Question 7: How Dependent Is the Business on Key Customers?
Why it matters: Customer concentration creates risk of negotiating leverage. Losing one customer shouldn’t crater the business.
How to assess it:
Check 10-K for customer concentration disclosures (required if >10%)
Estimate the total customer count and distribution
Assess bargaining power dynamics
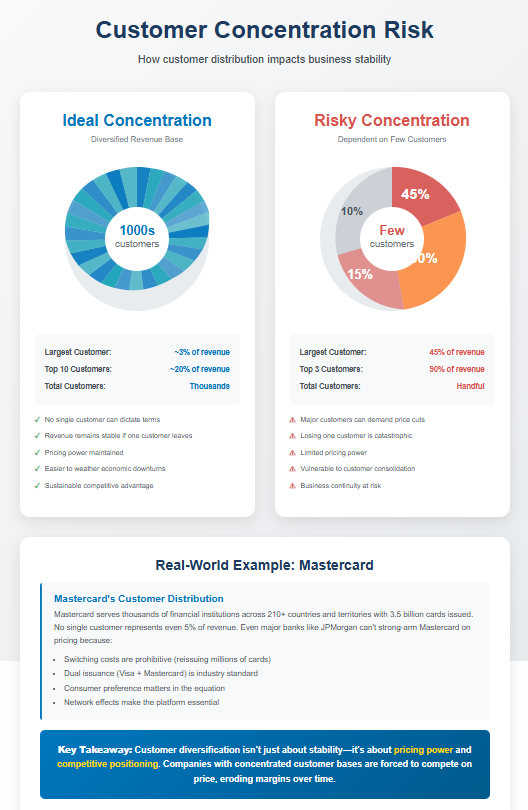
Mastercard example: Mastercard serves thousands of financial institutions globally across more than 210 countries and territories. No single customer accounts for more than 5% of revenue. The company had 3.5 billion cards issued as of December 2024 across thousands of financial institution partners. Even giant banks can’t strong-arm Mastercard on pricing because:
Dual issuance (Visa + Mastercard) is standard
Consumer preference matters
Switching costs are prohibitive
What good looks like: No customer >10% of revenue, thousands of customers, favorable bargaining position.
What bad looks like: Top 3 customers account for>40% of revenue, total customers are few, and customers can easily switch.
PILLAR 3: Resilience & Adaptation
Question 8: Does Management Allocate Capital Well?
Why it matters: Even great businesses can fail due to poor capital allocation. You want management that prioritizes high-return investments over empire building.
How to assess it:
Review share buyback history (buying at reasonable prices?)
Examine M&A track record (value created or destroyed?)
Compare CapEx to industry (efficient or wasteful?)
Check dividend policy consistency
Mastercard example: Mastercard’s capital allocation scorecard:
Buybacks: Repurchased $11.0 billion of stock in 2024 (23 million shares), maintaining discipline
M&A: Strategic acquisitions like Recorded Future (threat intelligence) that expand the moat
Dividends: 14 consecutive years of dividend growth, with an annual dividend of $3.04 per share and a payout ratio of approximately 19%
CapEx: Disciplined at approximately 4% of revenue
Total capital returned to shareholders in 2024: $13.4 billion ($11.0B buybacks + $2.4B dividends).
What good looks like: Disciplined buybacks, accretive M&A, growing dividends, efficient CapEx.
What bad looks like: Buybacks at peak prices, repeated M&A failures, dividend cuts, wasteful spending.
Question 9: Is the Business Model Adaptable?
Why it matters: Industries evolve. The best businesses adapt their model without abandoning core strengths.
How to assess it:
Review 10-year business evolution (same model or adapted?)
Check R&D spending and innovation pipeline
Assess management’s track record in navigating disruption
Mastercard example: Mastercard started as a credit card network. Today they’re expanding into:
Real-time payments and account-to-account transfers (Mastercard Move)
Cybersecurity and threat intelligence services (Recorded Future acquisition)
Digital identity and authentication
Tokenization and contactless payments (70% of in-person transactions)
Cryptocurrency infrastructure
They’re evolving from “transaction processor” to “payment ecosystem platform” while maintaining their network core. Cross-border volume grew 18% in 2024, showing the traditional business remains strong while new capabilities scale.
What good looks like: Successful pivots that leverage existing strengths, new revenue streams emerging.
What bad looks like: Stuck in declining markets, failed innovation attempts, reactive rather than proactive.
Question 10: What Could Kill This Business?
Why it matters: Understanding downside scenarios is more important than upside projections. Every business has vulnerabilities—you need to know them.
How to assess it:
Brainstorm existential threats (regulatory, technological, competitive)
Assess the probability and the company’s defensive positioning
Review how the business weathered past crises
Mastercard example: Potential threats:
Regulatory intervention: Interchange fee caps (already happened in the EU, company adapted and grew)
Disintermediation: Merchants bypassing networks (Mastercard adding value-added services to prevent this)
Alternative payment methods: Digital wallets, crypto (Mastercard powers many wallet solutions and is building crypto capabilities)
Economic downturn: In 2020 COVID crisis, gross dollar volume declined but recovered quickly; the company remained profitable
Mastercard has survived 50+ years of “next payment revolution” predictions by adapting rather than resisting. Net revenue grew every year except 2020, and even that was only a modest decline.
What good looks like: Multiple scenarios identified, mitigation strategies evident, historical resilience.
What bad looks like: Single point of failure, denial of obvious threats, no contingency plans.
Putting It All Together: Your Action Plan
These 10 questions aren’t meant to produce a simple yes/no score. Instead, they create a holistic picture of business quality across competitive positioning, economics, and resilience.
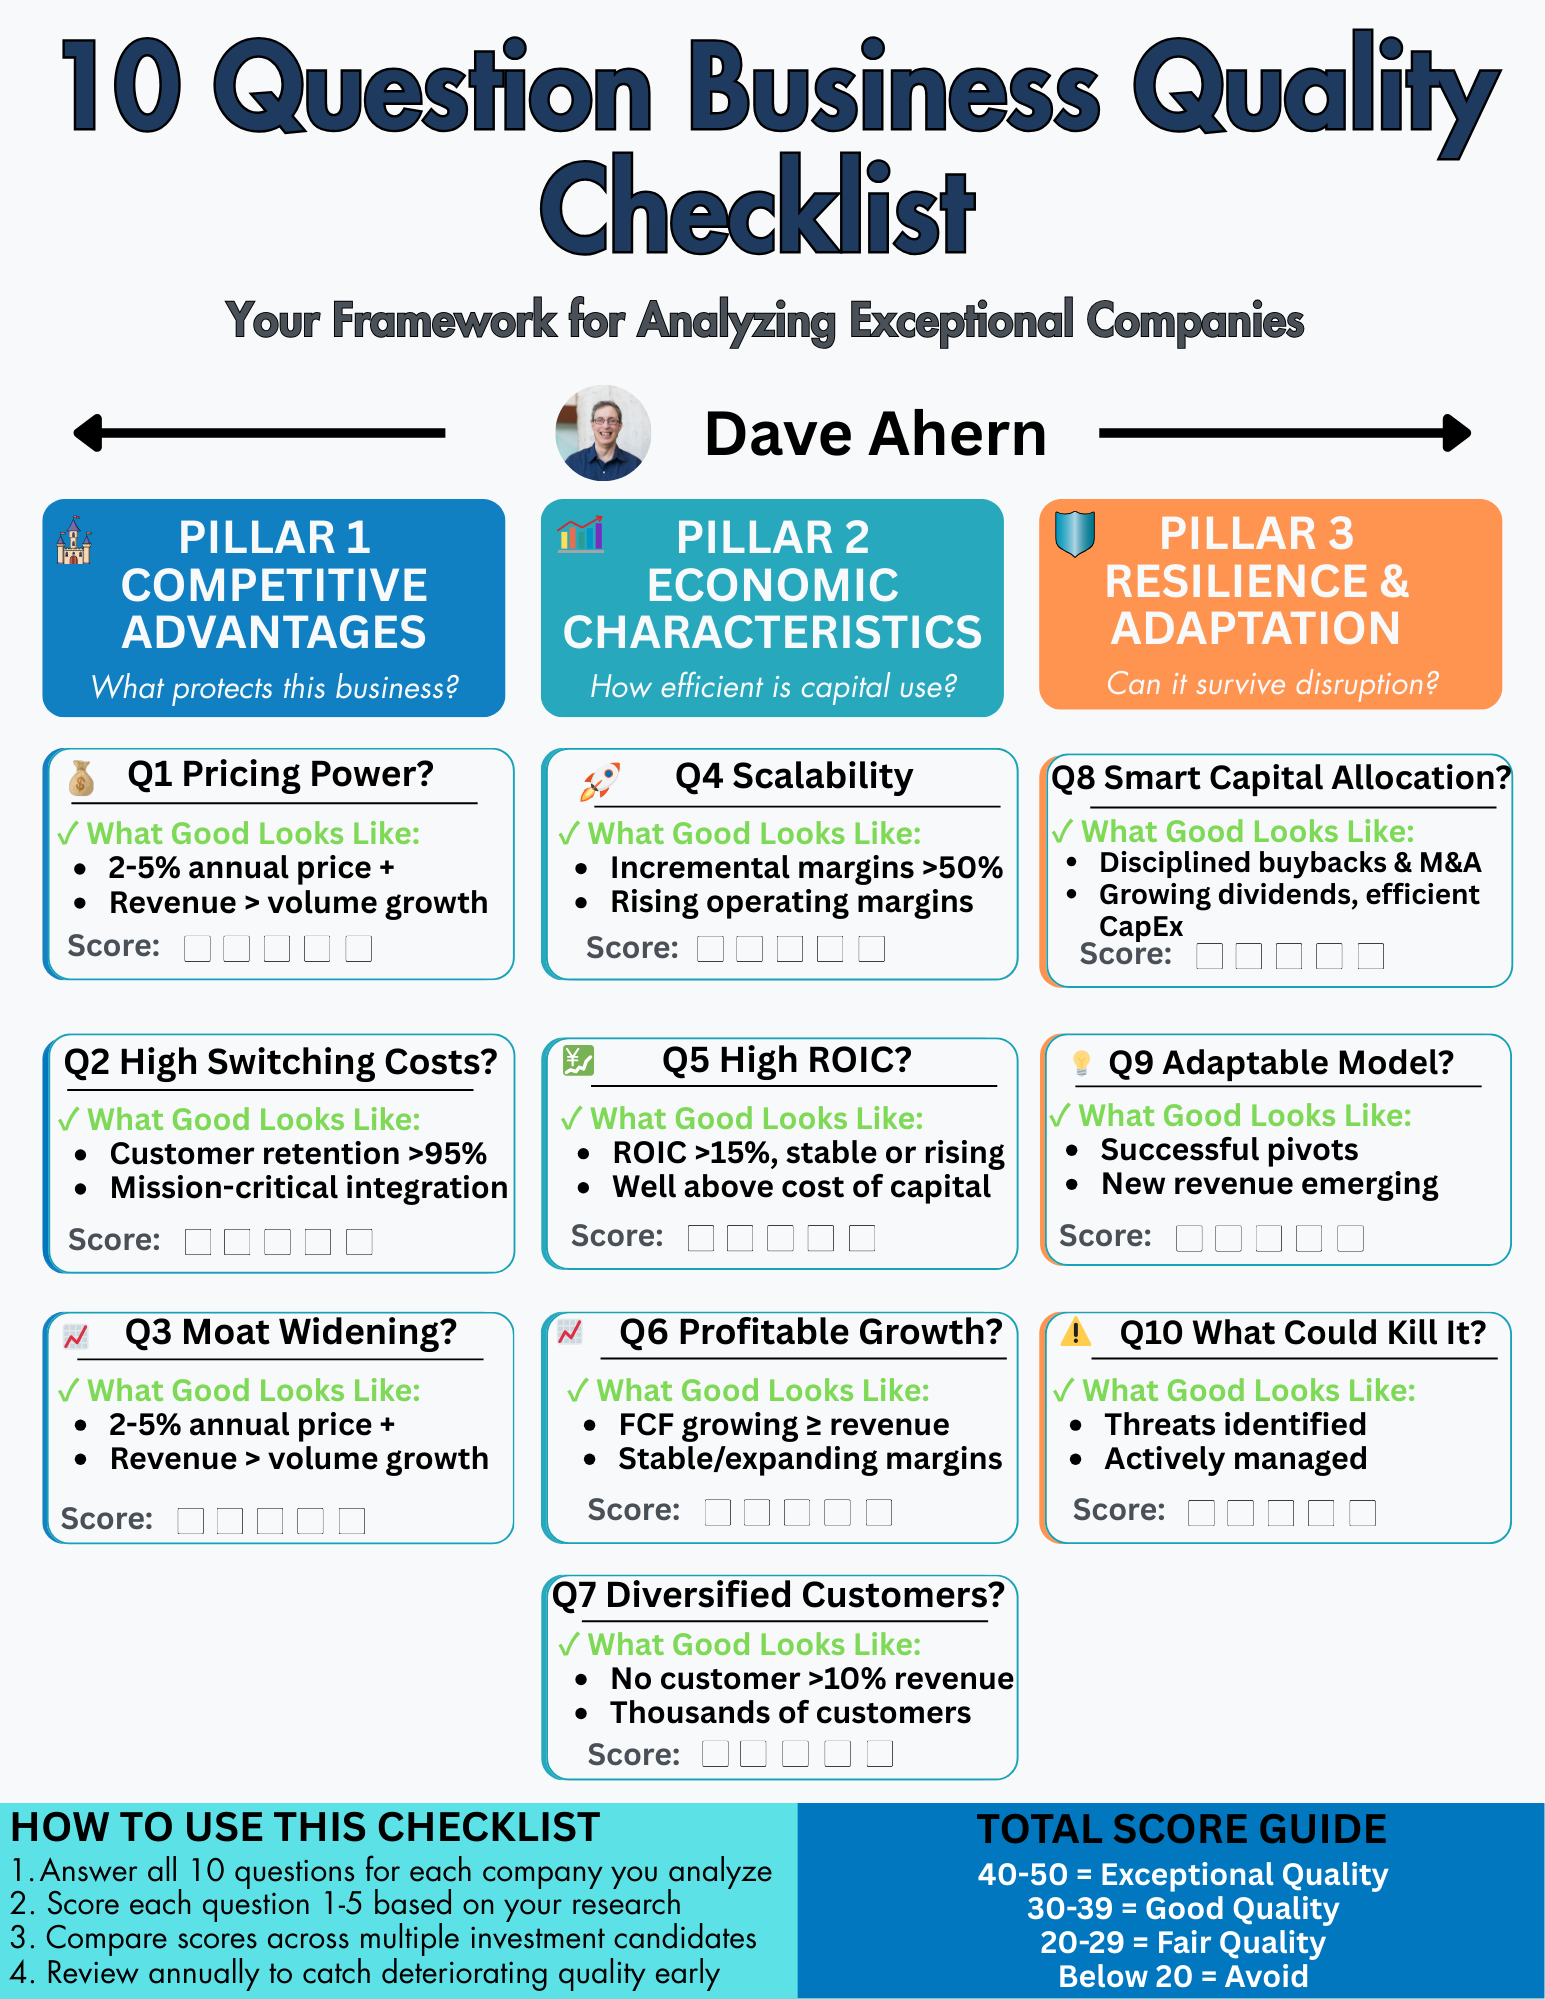
PDF version: 10 Question Business Quality Checklist
How to use this checklist:
Start broad: Answer all 10 questions for any new investment candidate
Identify weaknesses: No business is perfect—prioritize questions 1-5
Compare alternatives: Use the framework to rank multiple investments
Monitor holdings: Review annually to catch deteriorating quality early
Build conviction: Deep answers to these questions create conviction to hold through volatility
For Mastercard specifically:
Scores exceptionally well on 9/10 questions
Only moderate concern: regulatory risk in certain markets
Business quality justifies premium valuation (P/E around 30-35x)
This framework has helped me avoid countless value traps and identify compounders early. The companies that check most boxes—ROIC >20%, expanding moats, adaptable models—tend to be the ones that create wealth over decades.
Your next step: Take a company in your portfolio or watchlist and work through these 10 questions systematically. You’ll be surprised by what you discover.