
Is Texas Instruments' Dividend Safe?
TXN pays out 320% of its free cash flow. Here's what that means for dividend investors.

A free Dividend School deep dive. This is the same 12-section framework every Dividend School Pro deep dive runs on. In the paid version, the valuation work, the buy-below price, and the verdict sit behind the paywall. Today the whole thing is open.
Business Overview
Texas Instruments is one of the best-run semiconductor companies on the planet, with a 22-year dividend raise streak and a cost advantage competitors can’t copy. We still left it out of our 20-stock Dividend Universe. This deep dive explains why.
1. The dividend that outran its cash
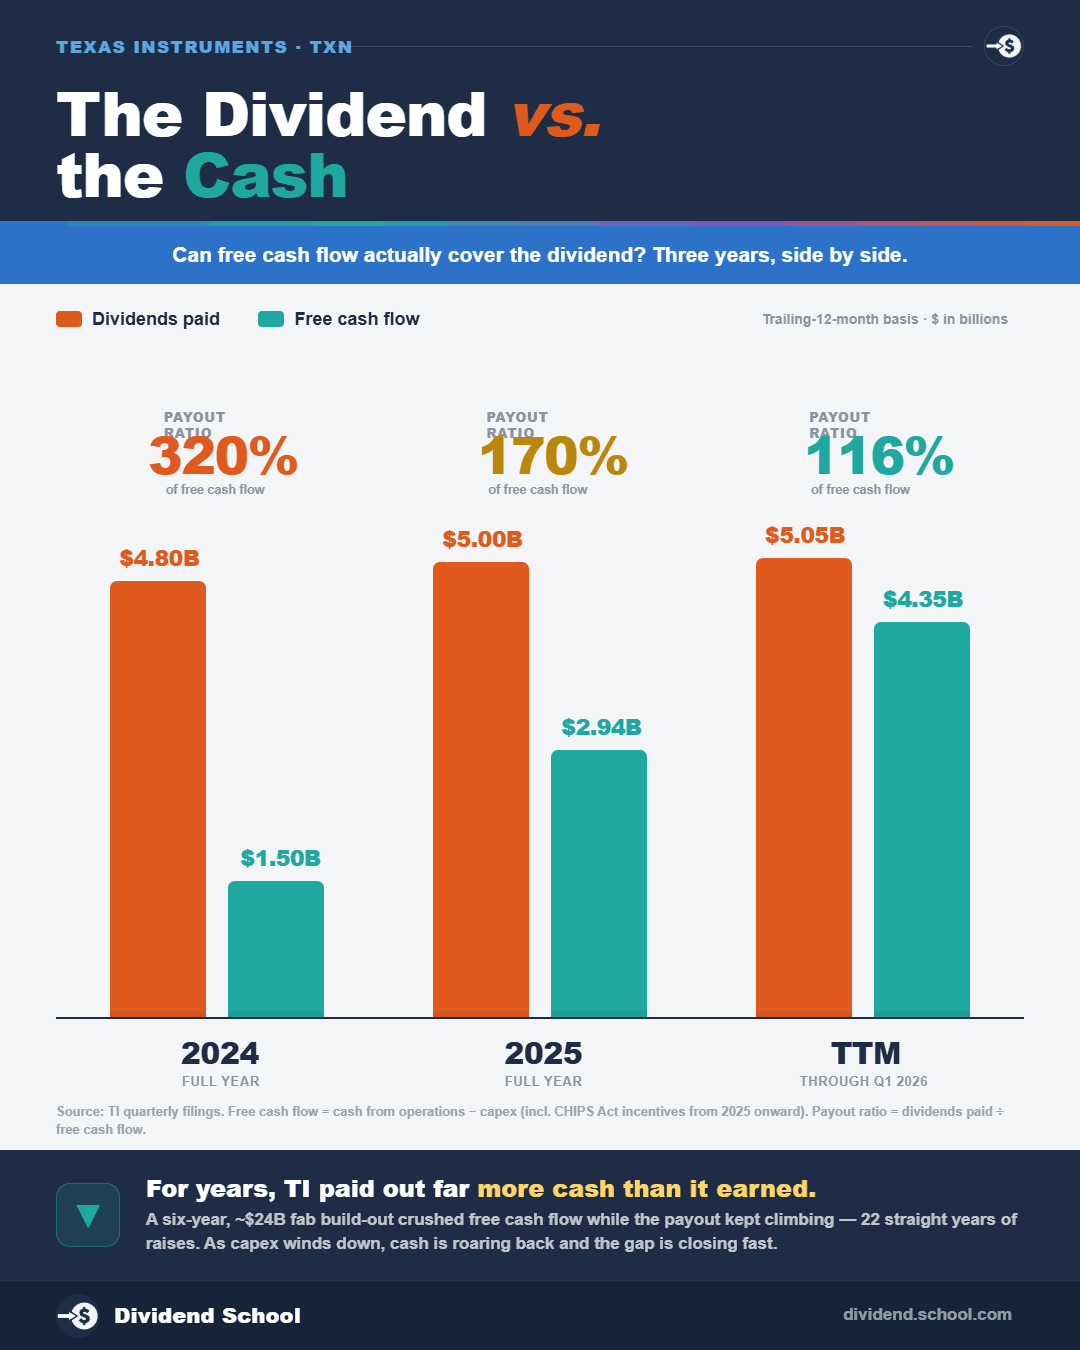
In 2024, Texas Instruments paid its shareholders $4.8 billion in dividends.
That same year, the company generated $1.5 billion in free cash flow. From the Q4 2025 earnings release, that’s a free cash flow payout ratio of 320%. For every dollar of free cash the business produced, it sent more than three dollars out the door to shareholders.
A company can do that for a while. It can’t do it forever.
So here’s the question this deep dive answers: when a genuinely great company lets its dividend run ahead of its free cash flow for years, does it still belong in a dividend portfolio? And if so, at what price?
2. The bet
Texas Instruments (TXN) is the world’s largest analog chipmaker, and the bet is simple: TI spent four years and roughly $20 billion building factories nobody else was willing to build, and now it gets to harvest that capacity for decades.
If the bet works, free cash flow per share climbs past $8 in 2026 and keeps growing, the dividend gets re-covered by cash, and today’s shareholders own a cash machine with a 22-year raise streak.
If the bet stalls, you own a dividend funded by the balance sheet at 49 times earnings.
3. What the company does
TI makes analog and embedded processing chips. Analog chips are the translators of the electronics world. The real world runs on continuous signals: temperature, pressure, sound, voltage. Computers run on ones and zeros. Analog chips convert one into the other.
Think of every device that touches the physical world. A factory robot sensing the position of an arm. A car managing battery power. A medical monitor reading a heartbeat. Each one needs dozens of these small, cheap chips.
That’s TI’s sweet spot. The company sells roughly 80,000 products to about 100,000 customers, mostly in industrial and automotive markets. No single chip or customer makes or breaks the year.
Two more things make analog a lovely business for income investors.
First, analog chips have long lives. A chip designed into an industrial controller can sell for 10 or 20 years with no redesign. Compare that to a smartphone processor that’s obsolete in three.
Second, the chips are cheap, often under a dollar. When a part costs fifty cents and a failure could shut down a production line, no engineer switches suppliers to save a nickel.
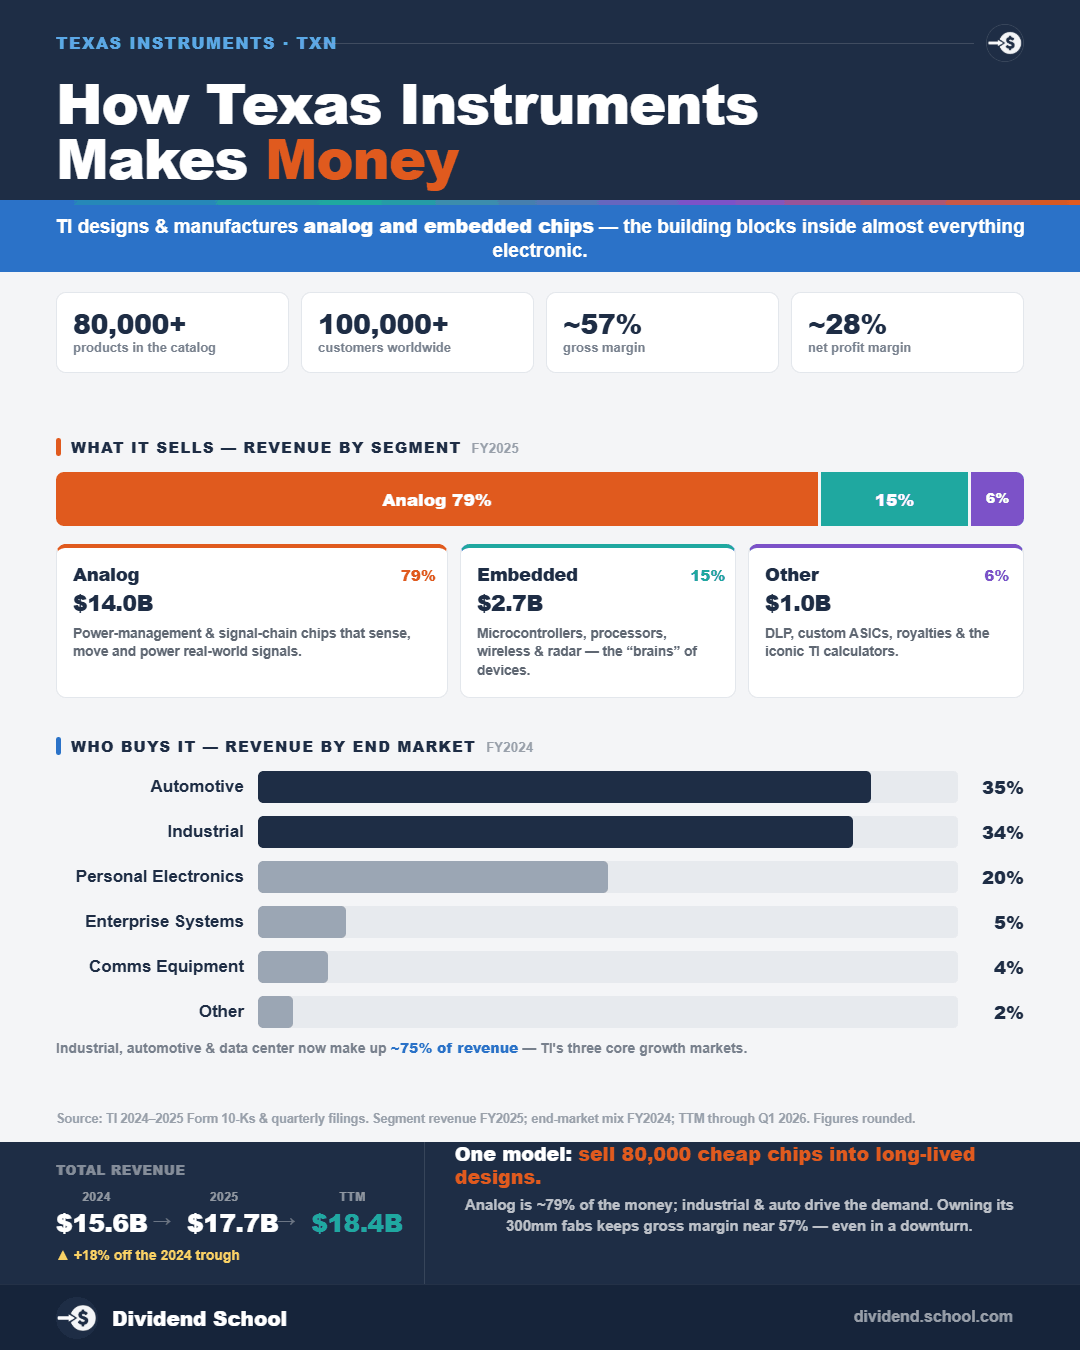
4. How they make money
TI reports two main segments, and one of them does the heavy lifting.
From the Q4 2025 earnings release, full-year 2025 segment results:
Analog: revenue $14.0 billion (+15%), operating profit $5.4 billion
Embedded Processing: revenue $2.7 billion (+6%), operating profit $304 million
Other: revenue $979 million, operating profit $307 million
Analog produces about 79% of revenue and nearly 90% of segment operating profit. Embedded (microcontrollers and processors) is the smaller, lower-margin sibling.
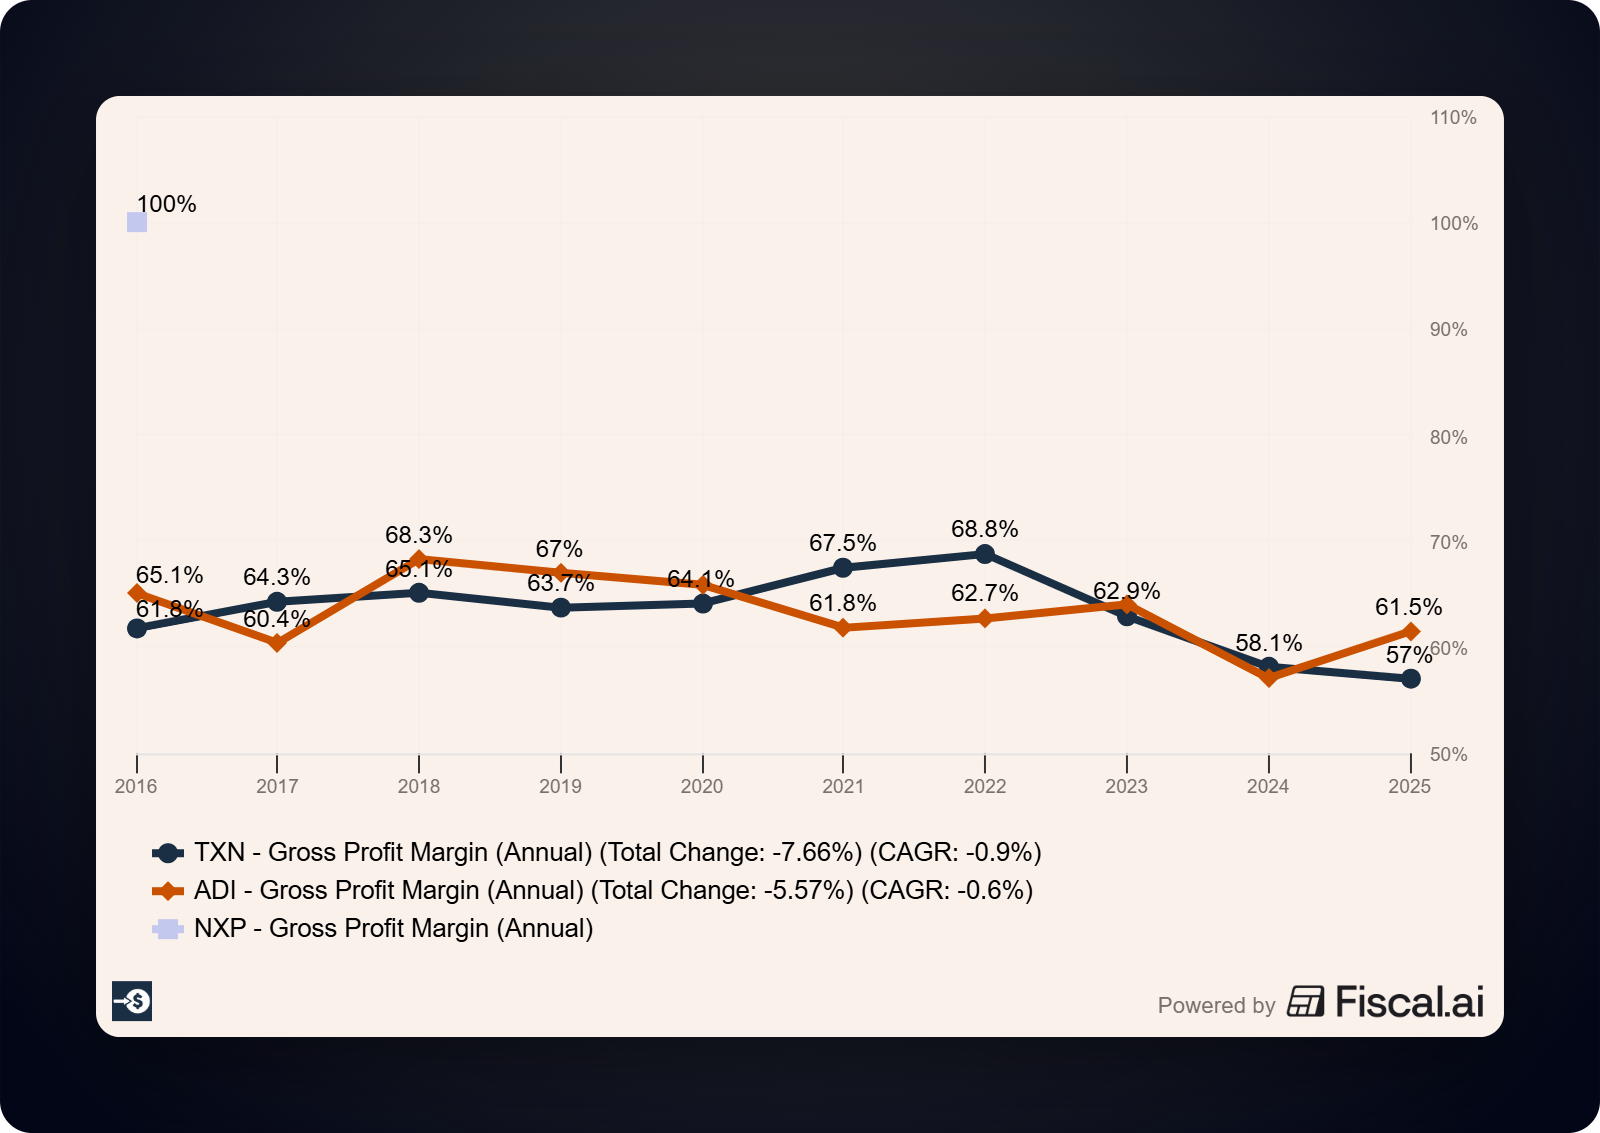
The unit economics are the story. TI manufactures most of its own chips on 300-millimeter wafers, which cut the cost per chip roughly 40% below the older 200-millimeter standard most analog competitors use. Owning the fabs and running the bigger wafers means TI keeps gross margins in the high 50s even at the bottom of a brutal industry cycle.
Here’s the 2025 scoreboard, from the Q4 2025 earnings release:
Revenue: $17.7 billion (+13% from $15.6 billion in 2024)
Gross profit: $10.1 billion (57% gross margin)
Operating profit: $6.0 billion (34% operating margin)
Net income: $5.0 billion
Diluted EPS: $5.45 (vs $5.20 in 2024)
And the recovery accelerated into 2026. From the Q1 2026 earnings release: revenue of $4.83 billion grew 19% year over year, EPS came in at $1.68 versus $1.28, and management guided Q2 to $5.0 to $5.4 billion in revenue with EPS of $1.77 to $2.05.
The business is working. Now let’s get to why it’s still outside our universe.
This is the point where the paywall drops in a regular Dividend School Pro deep dive. Everything below, the dividend autopsy, the valuation, and the verdict, is what subscribers get every month.
5. Moat and competition
TI’s moat rests on three legs.
The first is manufacturing cost. The 300mm wafer advantage is structural. Competitors like Analog Devices, NXP, Infineon, and STMicroelectronics largely outsource production or run older fabs, so TI can underprice them and still earn fatter margins. Building a competing 300mm analog fab network would cost tens of billions and take a decade.
The second is breadth and distribution. TI sells those 80,000 products more and more through TI.com, making it the default catalog for engineers. Once a part is designed into a product, it stays designed in for the product’s life.
The third is switching costs. Requalifying a fifty-cent part in a safety-critical automotive or industrial application costs far more than the part ever will. Customers stay put.
The proof shows up in profitability. Even in 2024, the worst year of the analog downturn, TI posted a 35% operating margin (from the 2024 figures in the Q4 2025 release: $5.5 billion operating profit on $15.6 billion of revenue). Most industrial companies would kill for that margin at the top of their cycle. TI did it at the bottom.
6. Financials
The income statement is elite. The balance sheet is where the last four years left a mark.
From the Q1 2026 earnings release, as of March 31, 2026:
Cash and short-term investments: $5.1 billion
Total debt: $14.1 billion ($12.9 billion long-term plus $1.1 billion current)
Total equity: $16.8 billion
Property, plant and equipment at cost: $17.9 billion, up from $16.0 billion a year ago
Debt of $14.1 billion against $5.0 billion of net income is manageable for a business this profitable, and TI carries strong investment-grade ratings. But that debt pile grew through the capital spending (capex) cycle while the company kept paying a dividend its free cash flow didn’t cover. The borrowing didn’t fund growth alone. Some of it funded the payout.
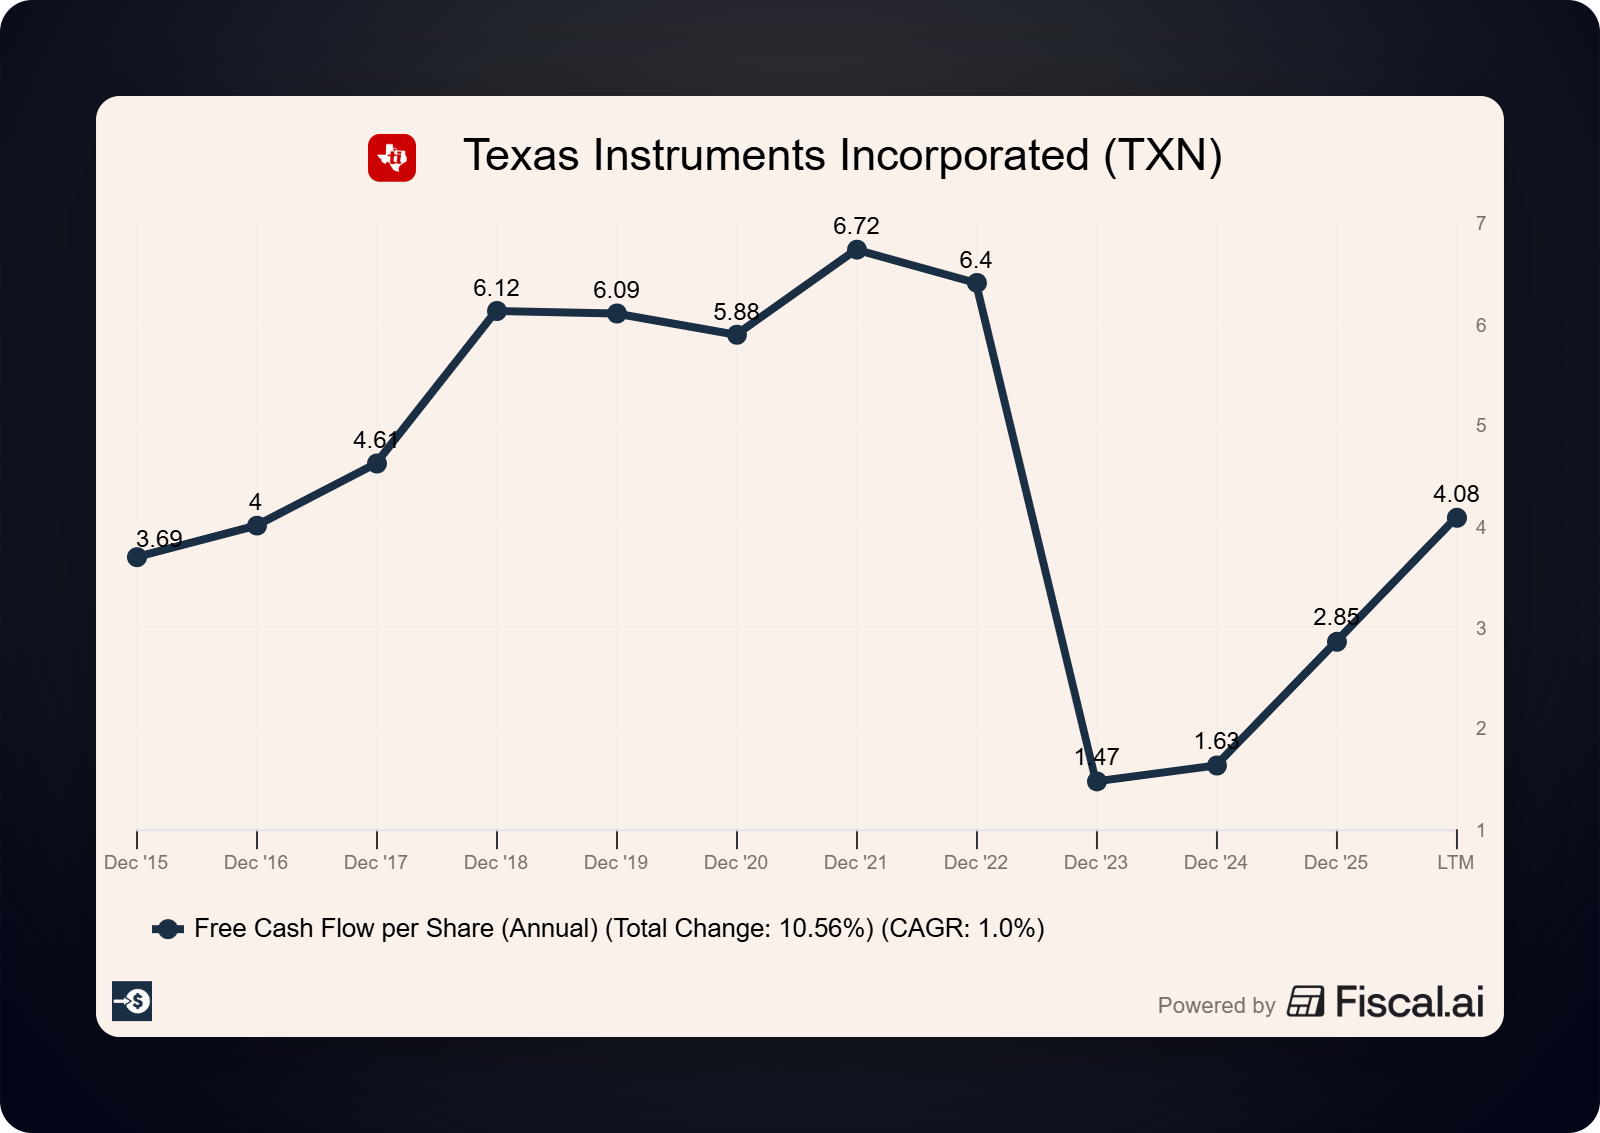
Cash generation tells the recovery story in one table. TI defines free cash flow as operating cash flow minus capex, plus CHIPS Act incentive proceeds:
FY2024: operating cash flow $6.3B, capex $4.8B, free cash flow $1.5B
FY2025: operating cash flow $7.2B, capex $4.6B, free cash flow $2.9B
Trailing twelve months (TTM) through Q1 2026: operating cash flow $7.8B, capex $4.1B, free cash flow $4.4B
Free cash flow nearly tripled in five quarters as the capex wave crested. That’s the right direction. It’s still not enough to cover the dividend, which brings us to the heart of the piece.
7. Dividend deep dive
Start with the good news.
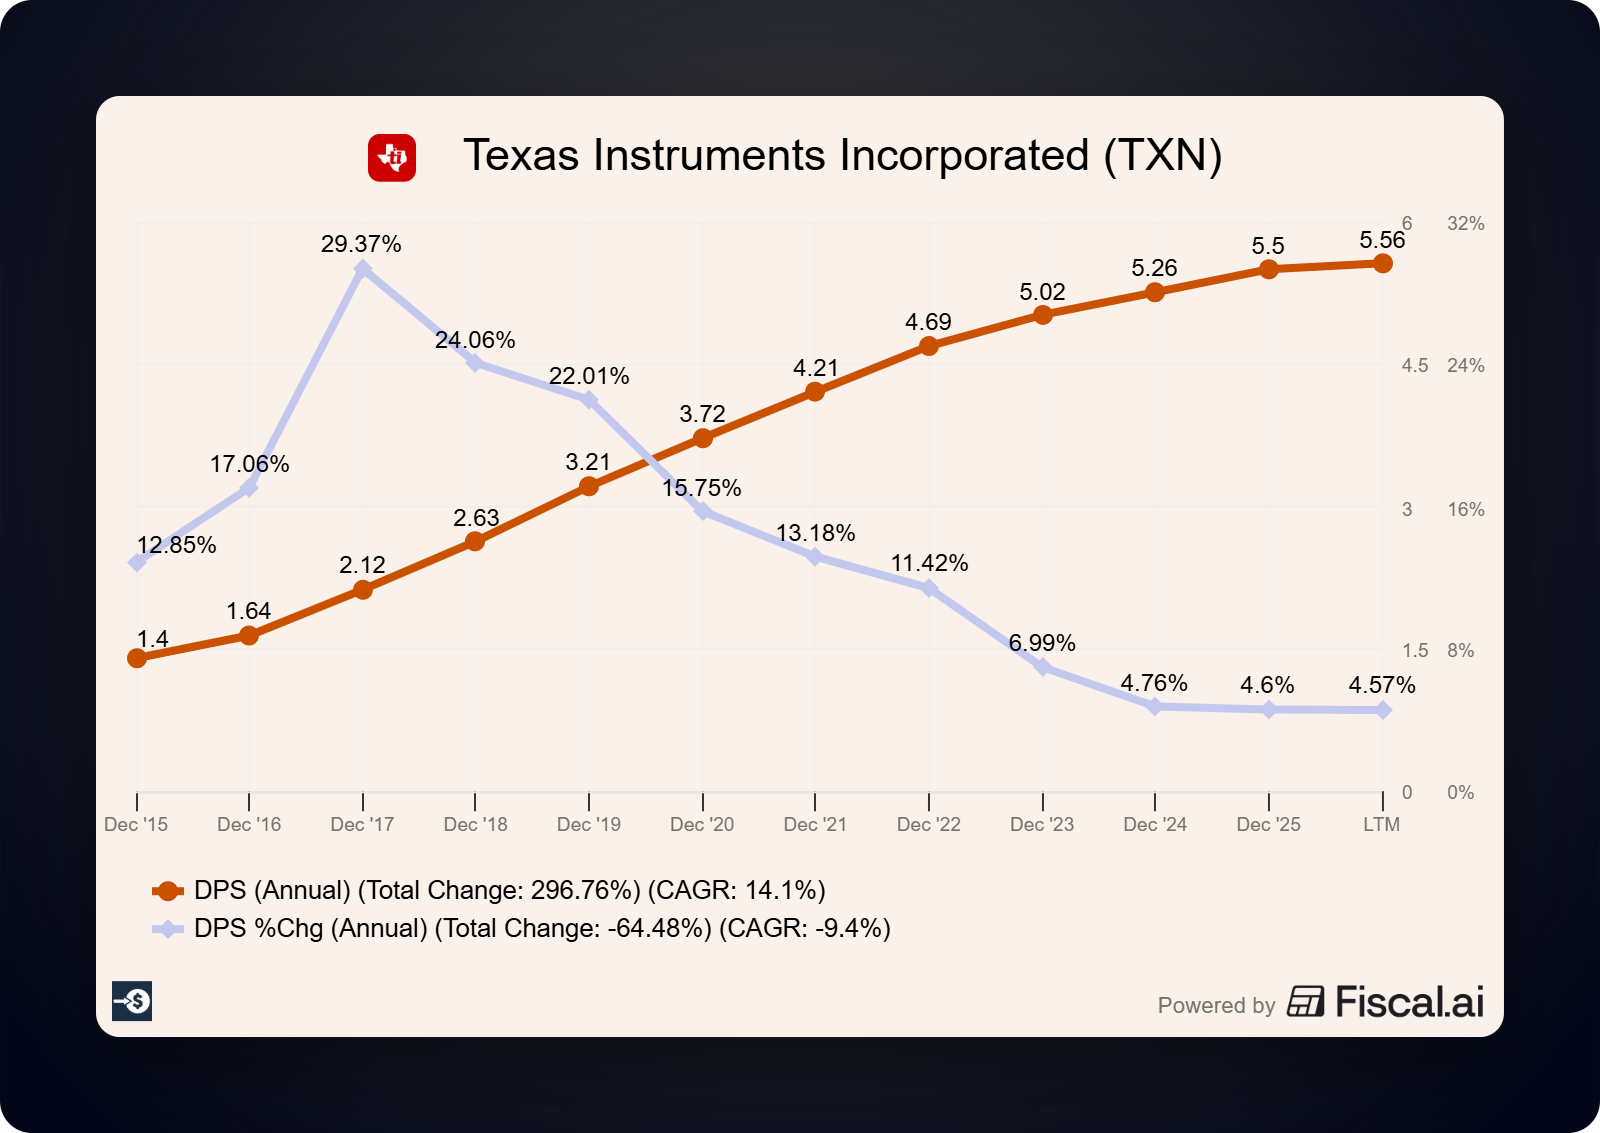
TI raised its dividend 4% in September 2025, to $1.42 per quarter ($5.68 annualized), marking 22 consecutive years of increases per the company’s September 18, 2025 announcement. At a recent price near $288, that’s a yield right around 2.0%.
Now the uncomfortable news. Let’s look at coverage from both directions.
On earnings, from the Q4 2025 release: TI declared $5.50 per share in dividends during 2025 against GAAP EPS of $5.45. That’s a 101% earnings payout ratio. The full year of dividends exceeded the full year of profits.
On free cash flow, dividends paid versus free cash flow generated:
FY2024: $4.8B paid vs $1.5B FCF, a 320% payout
FY2025: $5.0B paid vs $2.9B FCF, a 170% payout
TTM Q1 2026: $5.1B paid vs $4.4B FCF, a 116% payout
The trend is improving fast, and that deserves credit. But a 116% free cash flow payout means the balance sheet still funds part of the dividend: cash on hand, debt issuance ($1.2 billion of long-term debt issued in 2025 per the Q4 release), and CHIPS Act money.
How does a 22-year streak survive that? Three cushions: $5.1 billion of cash and short-term investments, an investment-grade balance sheet with room to borrow, and a capex cliff that’s already visible (Q1 2026 capex of $676 million versus $1.1 billion a year earlier).
The dividend growth rate tells you management knows the math. The raises have stepped down every year: roughly 13% in 2021, 8% in 2022, 5% in 2023 and 2024, and 4% in 2025. A company that used to compound its dividend in the teens now raises it at the pace of inflation.
Our dividend safety read: the dividend will almost certainly be paid and raised over the next few years. The streak is too important to management and the recovery is real. But “safe” in our framework means covered by free cash flow with room to spare, and TI hasn’t cleared that bar since 2021. That single fact is most of the reason TXN sits on our watchlist and outside our 20-stock universe.
8. Growth prospects
Here’s the bull case, and it’s a good one.
TI built four new 300mm fabs ahead of demand. The capacity now exists, the spending is winding down, and management said on the Q1 2026 call that free cash flow per share could exceed $8 in 2026 if current demand trends continue. Capex guidance steps down from $4.1 billion (TTM) toward the $2 to $3 billion range.
Run the math on what that means:
TTM free cash flow today: $4.4 billion
Dividends paid: $5.1 billion
FCF at $8 per share on 914 million diluted shares: roughly $7.3 billion
If management delivers, coverage flips from 116% to about 70% without a single extra dollar of revenue growth. Add the demand tailwinds (industrial recovery, data center power management, rising chip content per car) and the CHIPS Act incentives still flowing ($630 million of proceeds in the trailing twelve months per the Q1 2026 release), and the dividend goes from stretched to comfortable inside two years.
That’s the scenario that would earn TXN a spot in the universe. It hasn’t happened yet.
9. Management and capital allocation
CEO Haviv Ilan and his predecessors deserve real credit for conviction. TI told investors for years that it would build capacity through the downturn while competitors hid, and it did. The strategy was unpopular, expensive, and probably right.
The capital allocation record during the crunch is revealing:
Total returned to owners, TTM through Q1 2026: $6.0 billion
Dividends paid: $5.1 billion (+4%)
Buybacks: $982 million (down 38% year over year)
When cash got tight, management protected the dividend and throttled the buyback. That’s the right priority for income investors, and it tells you where the dividend sits in the pecking order: untouchable.
The flip side: returning $6.0 billion while generating $4.4 billion of free cash flow means the company returned cash it didn’t make. We’d rather see returns funded by the business, full stop.
10. Risks
Ranked by what worries us most.
First, the FCF recovery stalls. The whole thesis rests on capex falling while revenue grows. A second leg down in industrial or automotive demand, or a tariff shock to the semiconductor supply chain, would leave the dividend uncovered for longer with less cushion than in 2022.
Second, the price. At roughly 49 times trailing earnings, the market has already paid for the recovery. If $8 of FCF per share arrives on schedule, the stock is still trading at 36 times that number. Rich multiples turn good news into “as expected” and bad news into a 20% drawdown.
Third, cyclicality is forever. Analog is the steadiest neighborhood in semiconductors, and TI’s revenue still fell from over $20 billion in 2022 to $15.6 billion in 2024. Another downturn will arrive. The only question is the date.
Fourth, China. A meaningful slice of TI’s revenue ships into China, where local analog competitors are improving and trade policy is a coin flip.
The bear case in one line: you’re paying a premium multiple for a dividend that free cash flow doesn’t cover yet, in an industry guaranteed to cycle again.
11. Valuation: a reverse DCF
A regular discounted cash flow (DCF) guesses at future growth and spits out a price. A reverse DCF flips the exercise: start from today’s price and solve for the growth rate the market is already paying for. Then ask one question. Is that growth believable?
Our inputs: an 8.7% discount rate (TI’s weighted average cost of capital), a 4.5% terminal growth rate (anchored to the current 10-year Treasury yield), and a 10-year growth stage. At $288 per share on 914 million diluted shares, the market values TI at near $263 billion.
Here’s the free cash flow growth baked into that price:
Off today’s actual FCF ($4.35 billion TTM): 15.7% per year, every year, for a decade
Off management’s promised $8 per share for 2026 (about $7.3 billion): 9.1% per year on top of the promise
Read those again. Even with management given full credit for the $8 before it is delivered, the price still demands 9% compounded growth for 10 years from a cyclical business that fell into the double digits from its 2022 peak to 2024.
Now run the same math at our buy-below:
At $200, off the $8 promise: 4.6% implied growth, roughly nominal GDP
At $200, off today’s actual FCF: 11%
One honest caveat: the 4.5% terminal rate is generous, which flattens the hurdle. These implied growth rates are floors, and the real bar sits higher.
That’s the whole case in two numbers. At $288 you need TI to be heroic for a decade. At $200, you need TI to be ordinary, and ordinary is what great companies deliver at a minimum. Our buy-below stays at $200.
12. Why It's Still Not In Our Universe
Texas Instruments is a great company. We mean that without qualification: the moat is real, the strategy was brave, and the free cash flow recovery is happening on schedule.
It’s still not in our Dividend Universe, for two reasons this framework exists to catch.
Free cash flow does not yet cover the dividend, and our universe requires actual coverage. Promises don’t count. And the price embeds the entire recovery at 49 times earnings, which leaves nothing for the next surprise.
So the call: avoid at $288, keep it on the watchlist, revisit below $200. Position size if it ever triggers: a normal 4 to 5% starter, built slowly, because semiconductors will always hand you a second chance to buy.
What would change our mind:
a full year of free cash flow payout below 70%
capex guidance holding in the $2 to 3 billion range
and a price below our buy-below
Two of those three are plausible by mid-2027. We’ll be watching.
That’s the discipline.
A 22-year streak gets our respect. It doesn’t get our capital until the cash covers the check.
This is one stock. The Dividend Universe is twenty. Every one cleared a bar TXN couldn't. See what made the cut.
Like always, a great business analysis Dave of Texas Instruments. You always have to watch the numbers!!!