
Stock Under the Microscope: Chevron (CVX)

A Full Walkthrough of My Analytical Process
This is the first edition of Stock Under the Microscope, a monthly paid series where I pick one company and walk through my entire analytical process using the tools available to you as a paid subscriber. The goal is not to tell you whether to buy or sell. The goal is to show you exactly how I think through a dividend stock so you can apply the same process to any company in your portfolio.
If you are new to the paid tier, I recommend starting with Skill Sprint 1 (Dividend Safety and Payout Ratios) before reading this. It covers the foundational concepts. This walkthrough assumes you are comfortable with the basics and ready to see them applied to a real company.
In this month's free article, I raised a question about Chevron: its earnings payout ratio is above 100%. On the surface, that suggests Chevron is paying out more in dividends than it earns. For a 39-year dividend growth streak, that is a concerning number.
But surface-level numbers are where most investors stop. Today, we are going deeper. I am going to walk through Chevron using four tools, in order, just as I would if I were evaluating this stock for my own portfolio. By the end, you will have a clear picture of whether this dividend is actually at risk and a framework you can apply to any asset-heavy dividend payer.
Here is what we are covering:
Dividend Safety Calculator: What the payout ratio actually tells us (and what it hides)
Margin and Cash Flow Spreadsheet: Where Chevron’s money comes from and where it goes
AI Research Prompt: Stress-testing the shareholder return program
Decision Framework: The three numbers I would track going forward
Let’s get into it.
Part 1: The Dividend Safety Calculator

Open the Dividend Safety Calculator. We are going to run Chevron through it together.
The Inputs
Here is what I plugged in using Chevron’s FY2025 results:
Earnings per share (diluted): $6.63 Annual dividend per share: $7.12 (the new rate after the January 2026 increase to $1.78/quarter) Cash flow from operations: $33.9 billion Free cash flow: $16.6 billion Shares outstanding: approximately 1.85 billion (diluted) Total dividends paid: $12.8 billion
What the Calculator Shows
The first output is the one that triggers alarm bells.
Earnings payout ratio: 107%
At the new annualized dividend rate of $7.12 against $6.63 in earnings per share, Chevron is paying out more than a dollar for every dollar it earned. If you saw this number on a screener and nothing else, you would probably pass on the stock. And many investors do exactly that.
Now look at the second output.
Free cash flow payout ratio: 77%
That is a completely different story. At 77%, the dividend is well covered by the cash Chevron actually generates after funding its capital expenditures. There is a 23% cushion.
And the third output.
Operating cash flow payout ratio: 38%
At this level, Chevron could pay its entire dividend obligation more than two and a half times over from operating cash flow alone. This is not a company struggling to fund its dividend.
Why the Numbers Disagree
This is the teaching moment. The gap between a 107% earnings payout ratio and a 38% operating cash flow payout ratio is enormous. If you do not understand why, you will misread every oil company, every utility, every REIT, and every capital-intensive business you ever analyze.
The answer is depreciation, depletion, and amortization. DD&A for short.
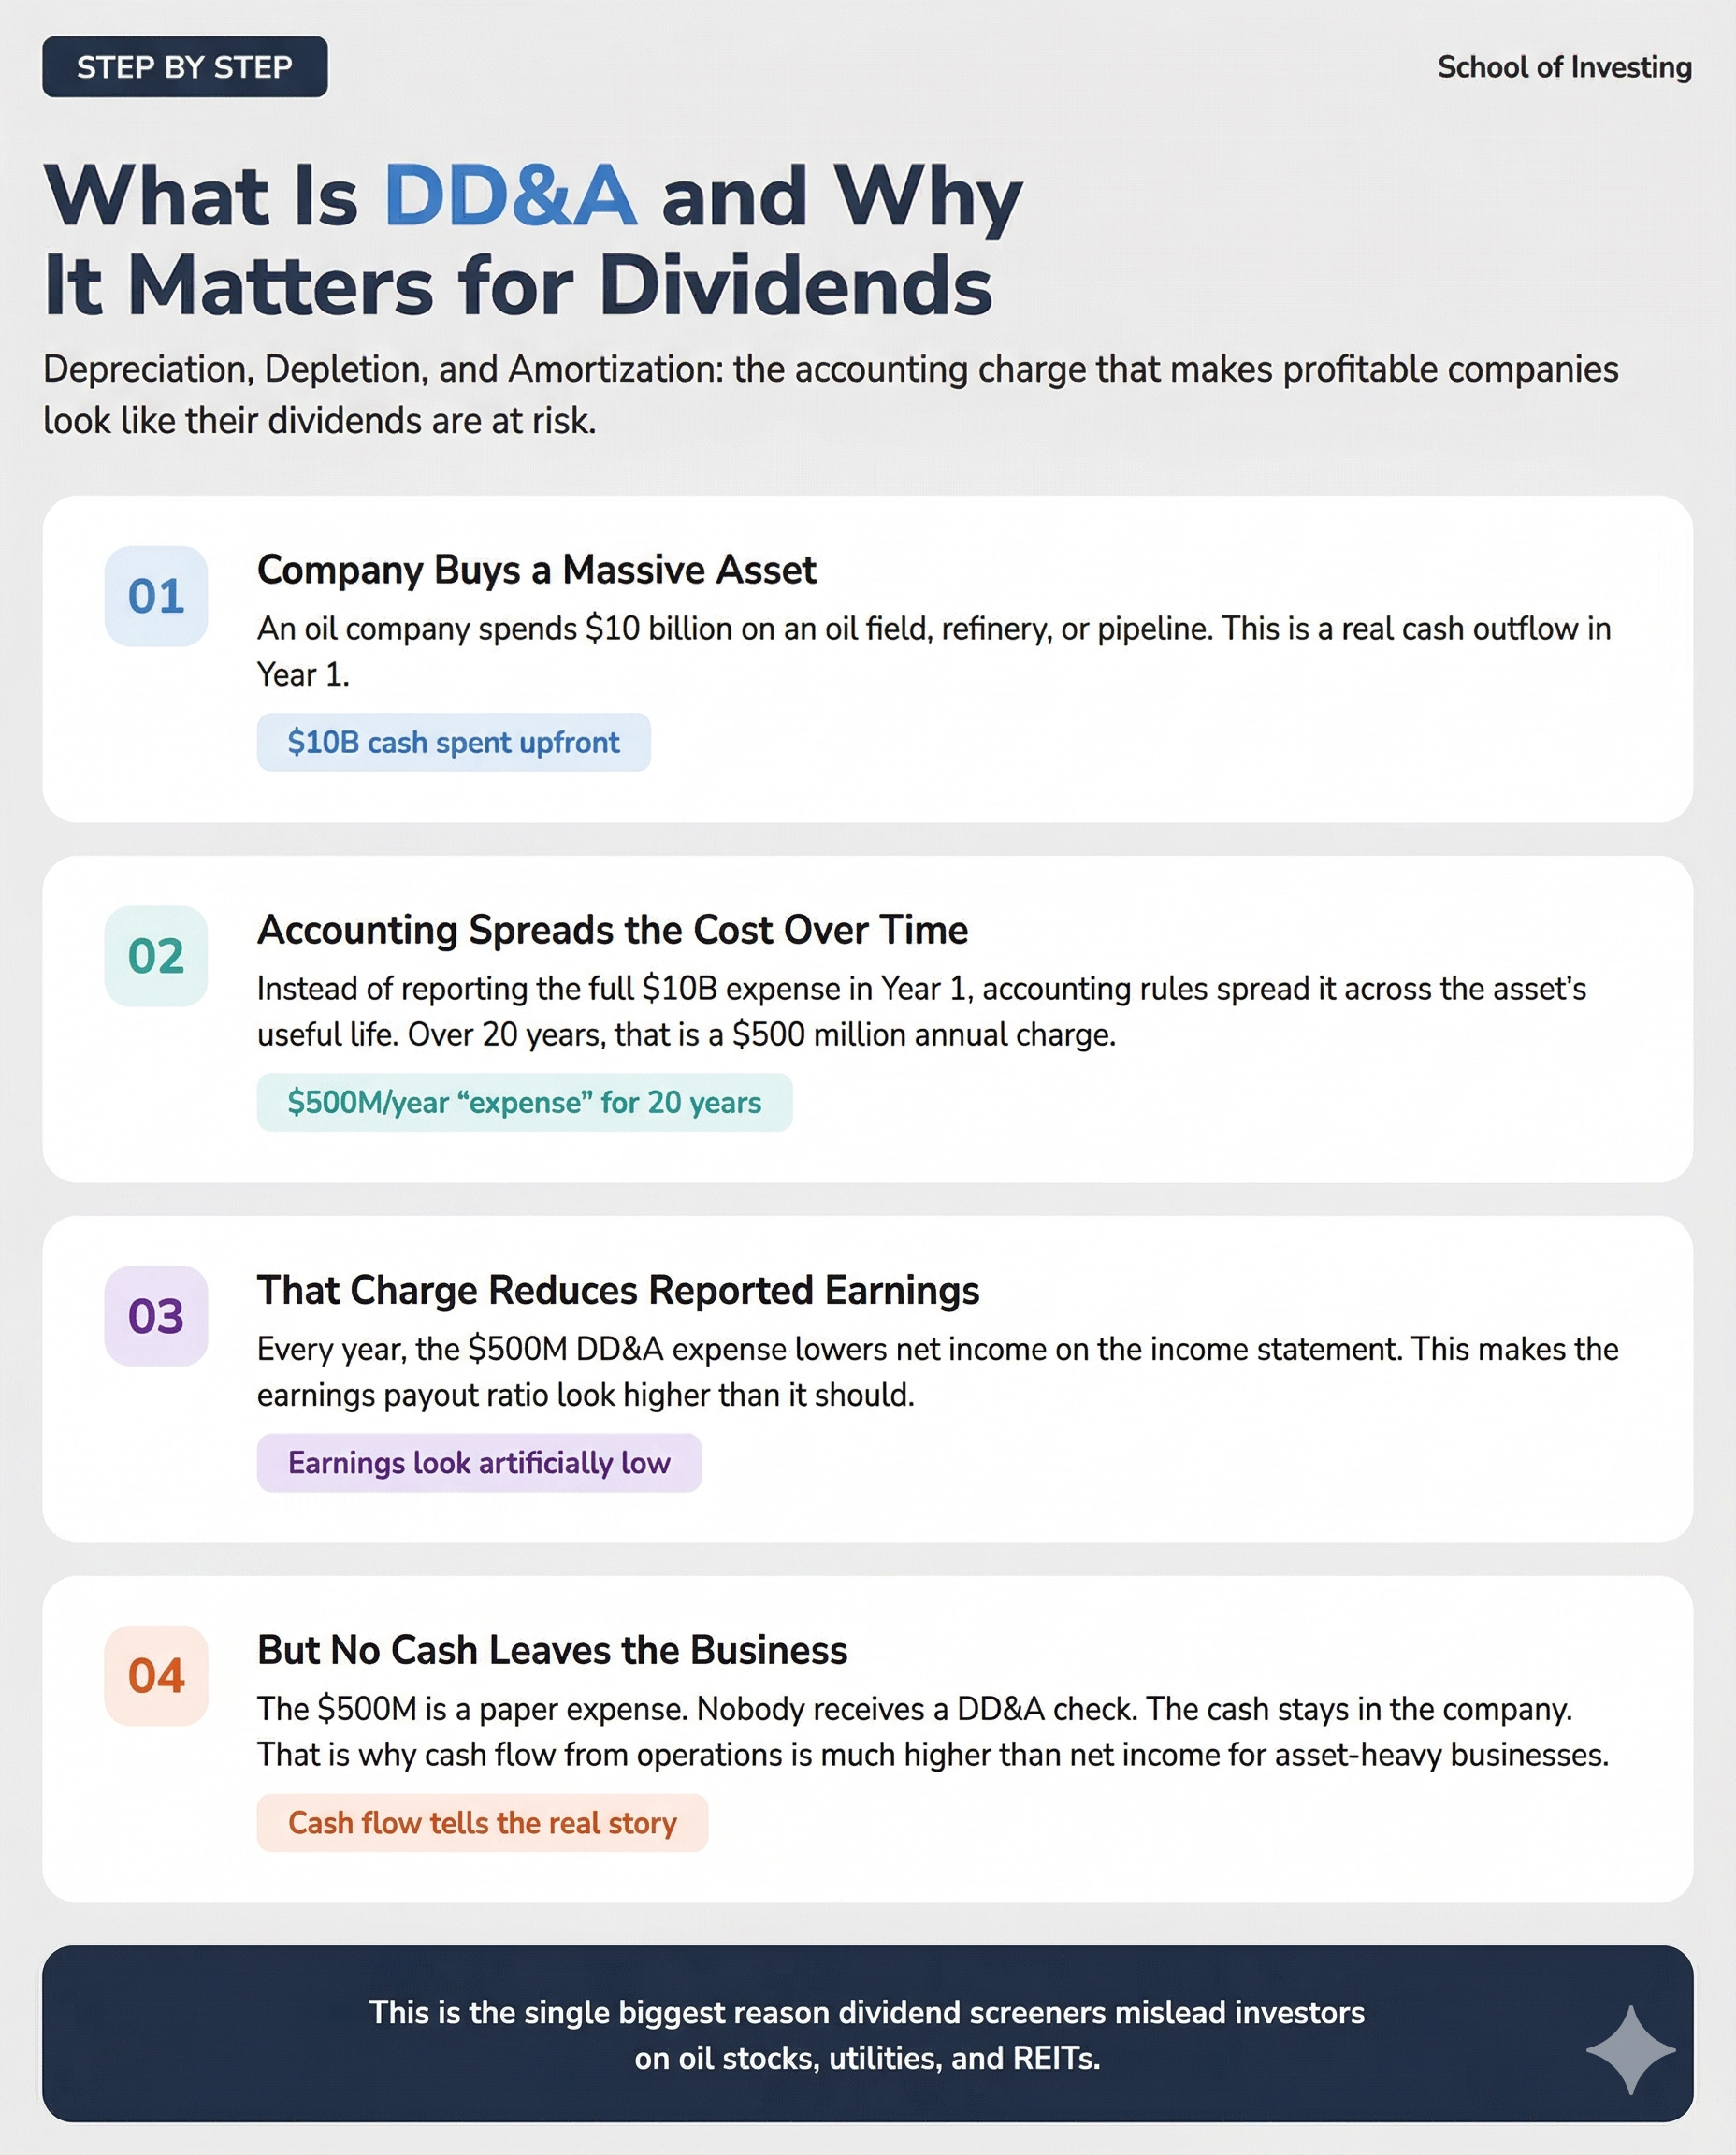
Chevron operates a massive physical asset base. Oil wells, refineries, pipelines, drilling equipment, processing plants, and reserves in the ground. Under accounting rules, the cost of these assets is spread over their useful lives as expenses on the income statement. For Chevron, that DD&A expense was approximately $17 billion in FY2024. The FY2025 number is likely higher, given that the Hess assets were added to the books mid-year.
That $17+ billion reduces reported earnings. But it does not reduce cash. Nobody receives a DD&A check. The cash stays in the business. That is why cash flow from operations ($33.9 billion) is so much higher than net income ($12.3 billion). The difference is almost entirely non-cash charges flowing through the income statement.
What This Means for You
When you run a company through the Dividend Safety Calculator and see the earnings payout ratio flashing red, do not stop there. Check the cash flow payout ratio. If earnings say danger but cash flow says comfortable, you are probably looking at an asset-heavy business where non-cash accounting charges are distorting the picture.
This does not mean the earnings payout ratio is useless. It tells you something real about the gap between accounting profitability and the dividend commitment. But it needs context. The cash flow payout ratio provides that context.
The takeaway from the calculator: Chevron’s dividend is not in immediate danger. The cash flow coverage is solid. But the earnings-based pressure is worth monitoring because it tells you how sensitive the dividend is to further earnings declines.
That is what the Dividend Safety Calculator shows us. The earnings payout ratio tells a scary story. The cash flow payout ratio tells a comfortable one. Knowing which to trust is the first step.
But it is only the first step. In the next three sections, I break down Chevron’s margin structure by segment using the analysis spreadsheet, stress-test the shareholder return program at three different oil prices using an AI research prompt, and build a 3-metric decision framework you can apply to any energy dividend stock in your portfolio.
This is the process. These are the tools. Let’s keep going.
