
Salesforce vs. SAP: How to Read Deferred Revenue and RPO Like a Pro

Enterprise software investors obsess over ARR growth rates, but the real story lives in the balance sheet’s deferred revenue line and the footnotes disclosing remaining performance obligations.
When Salesforce reports $26.4 billion in current RPO and SAP discloses €15.4 billion in current cloud backlog, most investors treat these as interchangeable forward-looking metrics. They’re not.
The accounting mechanics, contract structures, and economic reality behind these numbers reveal critical differences in revenue quality, customer commitment, and reinvestment discipline that can make or break your thesis.
TL;DR
Deferred revenue shows cash collected but not yet earned; RPO adds contracted-but-unbilled backlog for total future obligations
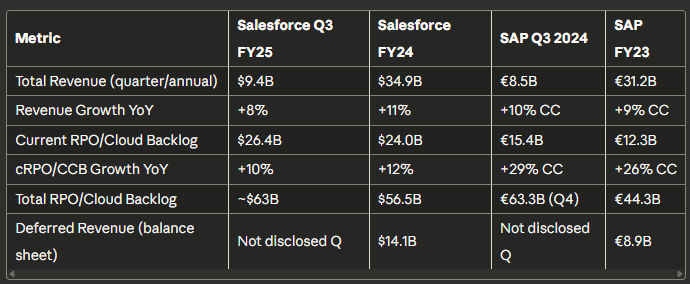
Salesforce’s cRPO (current RPO) grew 10% to $26.4B as of Q3 FY25, while SAP’s current cloud backlog surged 29% CC to €15.4B in Q3 2024
Contract duration, billing frequency, and revenue recognition timing create material differences between reported metrics and economic reality
High-quality RPO shows: accelerating growth, lengthening contract duration, minimal cancellations, and strong conversion to recognized revenue
The RPO-to-revenue conversion rate and deferred revenue days outstanding are critical quality signals often ignored by investors
Why Deferred Revenue and RPO Matter
Most investors anchor on recognized revenue growth. But enterprise software contracts create a timing mismatch between cash collection, customer commitment, and GAAP revenue recognition. This creates blind spots.
The base rate problem: Revenue growth accelerates or decelerates with a 3-12 month lag to actual business momentum. A company with slowing new bookings can show stable revenue growth for quarters as it burns through deferred revenue. Conversely, a business with surging new deals but annual upfront billing will show muted near-term revenue growth despite strong fundamentals.
Where investors go wrong: Three common mistakes compound. First, treating deferred revenue and RPO as simple “prepaid subscription” metrics without examining contract quality. Second, ignoring the RPO composition (current vs. non-current, billed vs. unbilled). Third, failing to track RPO conversion rates—how efficiently backlog becomes recognized revenue.
Quality investing demands understanding the economic revenue, not just the GAAP revenue. Deferred revenue and RPO bridge this gap, revealing customer commitment depth, contract duration trends, pricing power, and sales execution quality.
The Revenue Recognition Cascade — Shows the flow from Contract Signed → Cash Received → Deferred Revenue → Revenue Recognized → Cash from Operations
Core Accounting Concepts: Quality Lens
ROIC, Capital Intensity, and Contract Economics
Enterprise software businesses deliver exceptional ROIC when they achieve high gross margins (75-85%), minimal capex requirements, and negative working capital from deferred revenue.
The deferred revenue balance represents an interest-free loan from customers, a powerful source of capital.
Evidence of quality: When deferred revenue grows faster than revenue, the company is accelerating cash collection relative to delivery obligations. This signals pricing power and strong customer relationships.
For capital allocation, management should reinvest this working capital gift into high-ROIC initiatives: R&D for product moats, strategic M&A, or shareholder returns via buybacks at reasonable multiples.
The ROIC bridge: Deferred revenue directly impacts ROIC calculation denominator (invested capital). A company with $10B in deferred revenue effectively operates with $10B less true capital than balance sheet equity suggests.
When calculating normalized ROIC, adjust invested capital by subtracting excess deferred revenue to reveal economic returns.
Understanding RPO (Remaining Performance Obligations)
ASC 606 revenue recognition standards introduced RPO disclosure in 2018. RPO equals the sum of (1) deferred revenue already invoiced and sitting on the balance sheet, plus (2) contracted-but-unbilled future obligations not yet on the balance sheet.
The accounting mechanics: When a customer signs a three-year $360K contract with annual billing, Year 1’s $120K invoice creates deferred revenue (a liability). The $240K for Years 2-3 doesn’t appear on the balance sheet but must be disclosed as unbilled RPO. Total RPO = $360K.
As time passes, deferred revenue is recognized monthly, and the unbilled portion is recorded on the balance sheet each year as invoices are issued.
Current vs. non-current split: Current RPO (cRPO) represents obligations expected to convert to revenue within 12 months. This provides a revenue “floor” for the next four quarters, making it a critical metric for forecasting and understanding near-term visibility. Non-current RPO reveals multi-year contract strength and customer commitment depth.
ARR: The Normalized Run Rate
ARR (Annual Recurring Revenue) represents the annualized value of all active subscriptions at a point in time. Unlike RPO (a stock metric of total obligations), ARR is a run-rate metric showing current subscription velocity.
The relationship: For a stable business with consistent billing, ARR ≈ Next 12 months revenue ≈ Current RPO. But contract dynamics create divergences. A business signing big multi-year deals with annual billing will temporarily have cRPO > ARR.
A business with lots of monthly billing will have ARR > cRPO. Understanding this relationship reveals the nuances of the business model.
Quality signals in ARR: Look for ARR growth exceeding revenue growth (indicating acceleration), stable or expanding Net Revenue Retention (showing pricing power and expansion within existing customers), and low revenue concentration (no single customer >10% of ARR).
ARR per employee reveals sales force productivity, while ARR growth vs. sales & marketing spend shows go-to-market efficiency.
Moats and Durability Through the RPO Lens
RPO quality signals moat strength. High-quality RPO exhibits four characteristics:
Retention evidence: Non-cancellable contracts with 2-3 year terms demonstrate customer commitment. Track renewal rates in the RPO footnotes—best-in-class enterprise software shows >90% gross retention and >110% net retention (expansion revenue exceeds churn).
Pricing power: RPO growing faster than unit count (seats, transactions, etc.) proves pricing expansion. SAP’s cloud backlog growing 29% when cloud revenue grew 27% suggests contract value expansion outpaces new customer additions.
Switching costs: Long contract durations (2-3+ years) and low cancellation rates indicate high switching costs. Mission-critical systems like ERP (SAP) or CRM (Salesforce) embed deeply into customer operations, creating durable moats reflected in multi-year commitments.
Margin stability: As RPO converts to revenue, watch gross margins. Stable 75-80%+ margins prove the revenue is high-quality SaaS, not low-margin services disguised as subscriptions.
Worked Example: Salesforce vs. SAP Deep Dive
Let’s dissect two enterprise software giants using identical quality-investing frameworks. Both serve enterprise customers with mission-critical applications, but their accounting disclosures and business models differ materially.
Company Profiles and Market Position
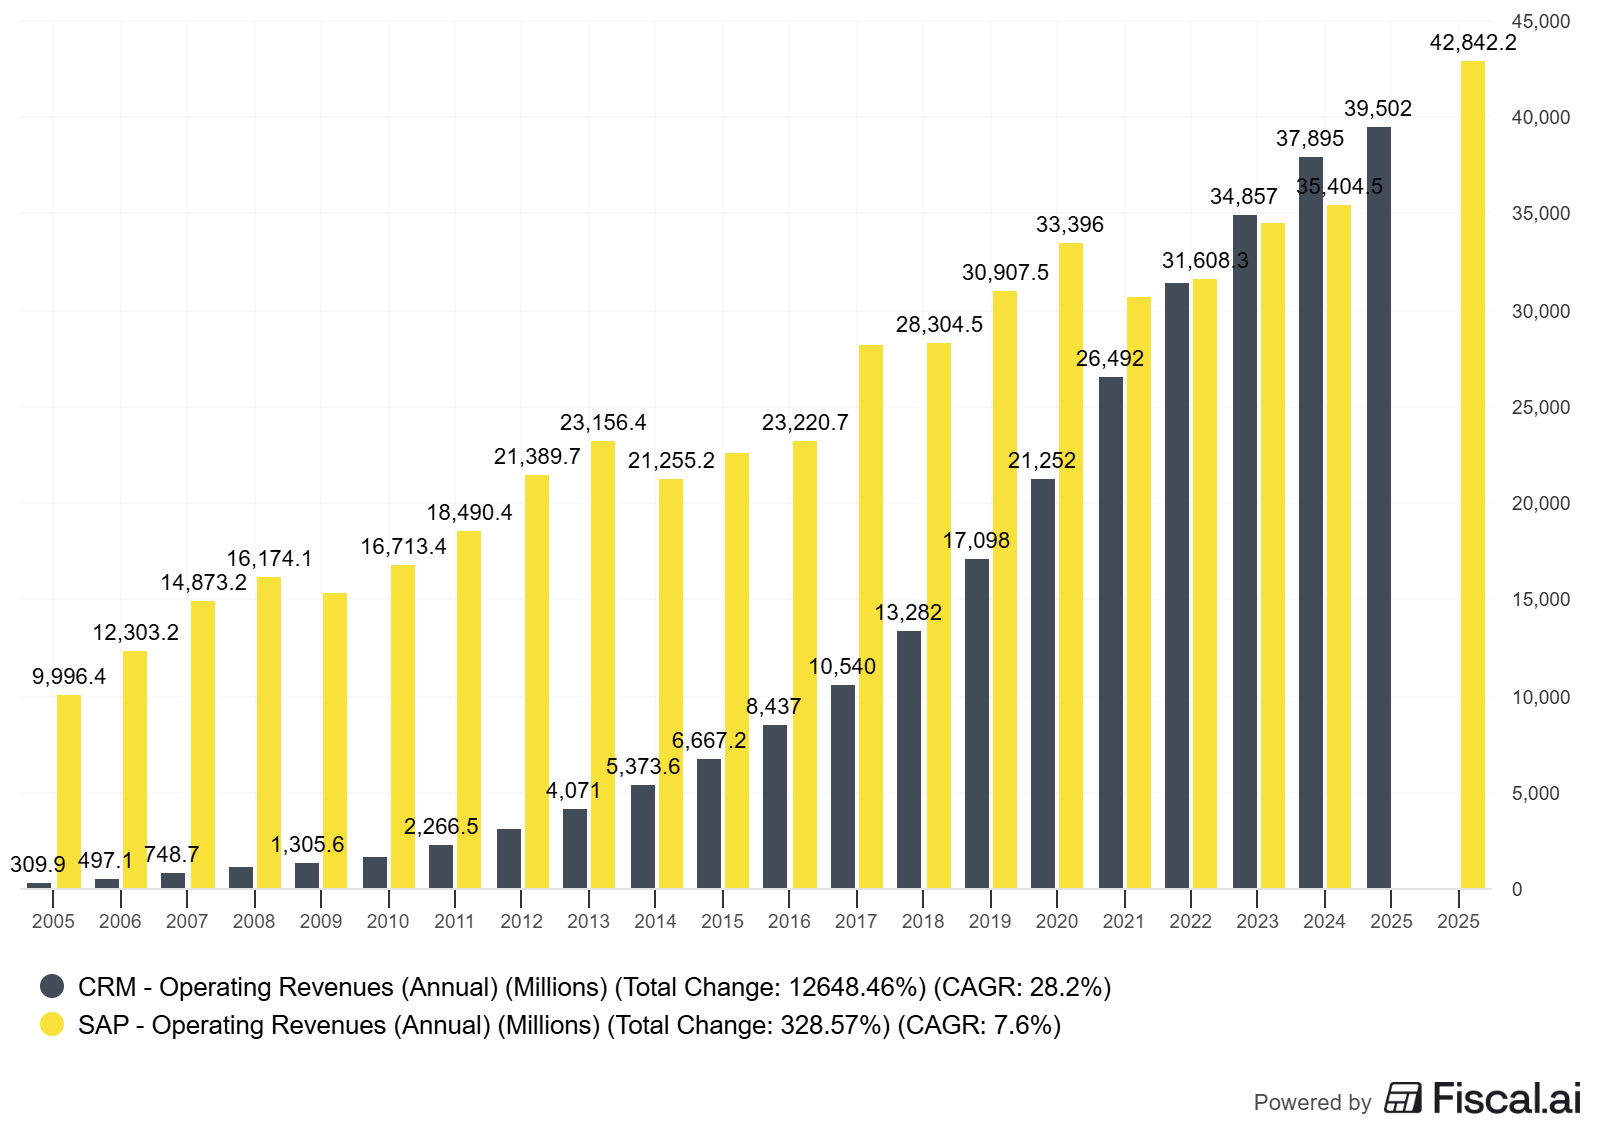
Salesforce (CRM): The dominant CRM platform with $37.9B in fiscal 2025 revenue (as of January 31, 2025), up 9% YoY. Subscription & support revenue comprises 94% of total. Market cap ~$370B.
Serves 150,000+ customers across all segments with products spanning Sales Cloud, Service Cloud, Marketing Cloud, and the newer Data Cloud and AI offerings.
SAP SE (SAP): The European ERP leader with €33.2B in revenue for 2024 (as of Q4 2024 results), up 10% YoY. Cloud revenue represents 51% of total and grew 27% YoY.
Market cap ~$265B. Serves 300,000+ customers with flagship S/4HANA ERP system, plus solutions for supply chain, HR, and analytics.
Strategic context: Both companies are transitioning customers from on-premise to cloud subscriptions, creating multi-year tailwinds. Salesforce is cloud-native and mature; SAP is in mid-transition, with a significant on-premises base still converting. This difference shows up in their RPO mechanics.
Deferred Revenue and RPO Trends (5-Year View)
Salesforce fiscal year ends January 31; SAP calendar year ends December 31. Data as of latest available filings.
Sources: Salesforce Q3 FY25 earnings, SAP Q3 2024 earnings
Key observations from the table:
Acceleration differential: SAP’s current cloud backlog growth (29% CC) significantly outpaces Salesforce’s cRPO growth (10%).
This reflects SAP’s earlier-stage cloud transition—customers are signing large multi-year RISE with SAP transformation deals, creating backlog surges.
Salesforce’s slower cRPO growth suggests maturity, not weakness. With 94% subscription revenue already, Salesforce has less runway for mix-shift acceleration.
Total RPO comparison: Both companies show ~$60-63B in total obligations, remarkable given SAP’s cloud revenue is only ~€17B annually vs. Salesforce’s $36B. This indicates SAP’s much longer average contract duration.
SAP’s ERP transformations span 3-5 years with phased implementations, while Salesforce’s CRM seats often run 1-2 year contracts.
Deferred revenue significance: Salesforce’s $14.1B deferred revenue represents 3-4 months of revenue coverage—standard for annual-upfront billing. SAP’s €8.9B represents ~3 months of cloud revenue but only 1 month of total revenue, reflecting the remaining on-premise business which follows different billing cycles.
Contract Quality and Economic Reality
Let’s analyze what these numbers reveal about contract quality using a quality-investing lens:
Contract duration evidence: SAP’s total RPO-to-current RPO ratio is ~4.1x (€63.3B / €15.4B), implying ~3 years average remaining contract life. Salesforce’s ratio is ~2.4x ($63B / $26.4B), implying ~18 months.
Result: SAP’s customers are making longer-term commitments, signaling deeper moat and switching costs in mission-critical ERP vs. departmental CRM tools.
Conversion efficiency: Salesforce converted ~$35.7B of subscription revenue from ~$56.5B starting total RPO in FY24—a 63% conversion rate. This is healthy, indicating strong delivery execution.
Track this annually; declining conversion rates suggest project delays or professional services bottlenecks.
Billing optimization: Salesforce’s cRPO growth (10%) lagging revenue growth (9%) by just 1 point is optimal—it means the company is efficiently converting backlog to revenue without building excess obligations it can’t deliver.
SAP’s 29% cRPO growth vs. 27% cloud revenue growth shows good conversion despite rapid new bookings.
Working capital gift: Salesforce’s $14.1B deferred revenue on a $370B market cap provides ~$14B in zero-cost financing for R&D and buybacks. Over the past 5 years, Salesforce has returned $21B to shareholders via buybacks—funded partially by customer prepayments. This capital allocation excellence exemplifies quality investing principles.
The Per-Share Story
Enterprise software RPO analysis is incomplete without per-share framing. Salesforce has aggressively bought back stock, retiring ~10% of shares outstanding since 2020. SAP has also repurchased shares, retiring ~5% since 2020.
Salesforce:
RPO per share grew ~12% CAGR 2020-2025 ($285/share to $655/share based on ~965M shares)
Buybacks accelerated RPO-per-share growth by ~3%/year vs. absolute RPO growth
FCF per share grew 18% CAGR, funding returns
SAP:
Cloud backlog per share grew ~35% CAGR 2020-2024 (€37/share to €53/share based on ~1.19B shares)
Mix shift to cloud plus modest buybacks drive per-share value
FCF per share grew 25% CAGR
Quality signal: Both companies demonstrate reinvestment discipline by converting revenue quality improvements (stable margins, working capital benefits) into per-share value through buybacks. This beats empire-building M&A or hoarding cash.
Reconciliation: RPO to Economic ARR
Neither company discloses ARR explicitly, but we can bridge from disclosed metrics to economic run rates:
Salesforce economic ARR estimate:
Subscription & support revenue: $35.7B (FY25)
Exit run rate: ~$38B annualized based on Q4 revenue
Net Revenue Retention: ~105% (implied from cRPO growth + customer count)
Conclusion: ~$38B ARR with steady growth driven by existing customer expansion
SAP economic cloud ARR estimate:
Cloud revenue: €17.3B (2024 full year)
Exit run rate: ~€19B annualized based on Q4 trajectory
Net Revenue Retention: ~110-115% (implied from backlog acceleration + customer adds)
Conclusion: ~€19B cloud ARR with strong 25%+ growth
[Table: RPO-to-ARR Bridge]
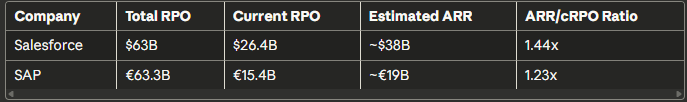
Interpretation: Salesforce’s ARR exceeds cRPO by 44%, indicating faster billing velocity (more monthly/quarterly vs annual). SAP’s 23% premium suggests longer payment terms and phased project billing. Neither is “better”—they reflect different customer segments and contract structures.
How to Analyze RPO and Deferred Revenue Yourself
Follow this step-by-step process for any enterprise software company:
Step 1: Gather the data sources
Pull the latest 10-K/20-F and past four quarters of 10-Q/interim filings. You need: (a) Balance sheet deferred revenue (current and non-current), (b) Revenue footnote with RPO disclosure (required under ASC 606 for public companies), (c) Cash flow statement to calculate billings.
Data location: Balance sheet → Liabilities → “Deferred revenue” or “Unearned revenue” or “Contract liabilities.” Revenue footnote → “Remaining Performance Obligations” section. Most companies report total RPO and current RPO (next 12 months).
Step 2: Calculate billings (proxy for bookings)
Billings = Revenue recognized + Change in deferred revenue
Example for Salesforce Q3 FY25:
Revenue: $9.44B
Deferred revenue increased ~$500M quarter-over-quarter (estimate)
Billings ≈ $9.94B
Billings growth > revenue growth signals acceleration. Track this quarterly to spot inflection points 6-9 months before they show up in revenue.
Step 3: Calculate deferred revenue days outstanding
Deferred Revenue Days = (Deferred Revenue / Quarterly Revenue) × 90
Salesforce example:
Deferred revenue: ~$14B (estimated)
Quarterly revenue: $9.44B
Days = (14 / 9.44) × 90 ≈ 133 days
Decision rule: Stable or rising days = healthy. Falling days = potential red flag (customer reluctance to prepay, or shift to usage-based billing). Best-in-class enterprise software maintains 90-150 days.
Step 4: Analyze RPO composition and growth
Current RPO (cRPO) is your forward revenue indicator. Track:
cRPO growth rate vs. revenue growth rate (should be similar or higher)
cRPO as % of annual revenue (best-in-class: 65-80%)
Non-current RPO for multi-year visibility
Example decision tree:
If cRPO growth > revenue growth by >5%: acceleration likely in 2-3 quarters
If cRPO growth < revenue growth: deceleration risk
If cRPO flat or down: significant business deterioration
Step 5: Calculate RPO conversion rate
RPO Conversion Rate = (Current Period Revenue) / (Prior Period Current RPO)
This measures how efficiently last year’s backlog converted to this year’s revenue.
Salesforce FY25 example:
FY25 revenue: $37.9B
FY24 beginning cRPO: ~$23B
Conversion = 37.9 / 23 = 1.65x
Interpretation: Conversion >1.0x is expected (cRPO is just next 12 months, while new bookings add throughout the year). Watch for trends: declining conversion signals execution issues (project delays, customer churn).
Step 6: Assess contract duration (average remaining contract life)
Average Remaining Life = (Total RPO / Current RPO) - 1
Salesforce: (63 / 26.4) - 1 = 1.39 years remaining average SAP: (63.3 / 15.4) - 1 = 3.11 years remaining average
Decision rule: Lengthening contract duration = moat strengthening. Shortening = churn risk or pilot projects rather than enterprise commitments. Target 18-36 months for most enterprise software.
Step 7: Cross-check with cash flow and working capital
Verify RPO quality by checking operating cash flow growth. High-quality RPO converts to cash quickly with minimal working capital drag.
Quality checks:
OCF growth ≥ RPO growth: excellent (efficient cash collection)
Days Sales Outstanding (DSO) <60 days: strong collection discipline
Negative cash conversion cycle: world-class (deferred revenue > receivables)
Salesforce shows OCF growth of 28% vs. 10% cRPO growth—exceptional quality, reflecting collections efficiency.
Pitfalls and False Positives
Even sophisticated investors trip over these common RPO analysis mistakes:
Pitfall 1: Conflating RPO growth with revenue quality
A company can manufacture RPO growth through aggressive sales tactics—offering upfront discounts for multi-year commitments, or signing deals with weak credit customers. Check the allowance for credit losses in the receivables footnote. Rising allowances despite RPO growth = low-quality bookings.
Real example pattern: Some companies show strong RPO growth but flat revenue 4 quarters later. This indicates (a) deals signed but not implemented, (b) usage-based components not materializing, or (c) customers churning before full contract delivery.
Pitfall 2: Ignoring unbilled vs. billed mix
Unbilled RPO (backlog not yet invoiced) carries execution risk. A company with 80% unbilled RPO faces higher cancellation risk than one with 80% billed (sitting as deferred revenue).
Check: Calculate billed ratio = Deferred Revenue / Current RPO. Salesforce runs ~53% billed ($14B / $26.4B). SAP likely lower given longer contract terms. Ratios below 40% warrant scrutiny—are these firm commitments or soft pipeline?
Pitfall 3: Missing the revenue recognition policy nuances
Some software companies recognize revenue at project milestones rather than ratably. This creates RPO that sits dormant for months. Read the revenue recognition policy carefully. Look for phrases like “milestone-based” or “project completion” vs. “time-based ratable.”
Quality signal: Ratable recognition (monthly/quarterly) is more predictable and higher quality than milestone-based. Salesforce and SAP both use predominantly ratable, which is appropriate for subscription businesses.
Pitfall 4: Seasonality confusion
Software bookings concentrate in Q4 (December/January) due to enterprise budget cycles. Q1 typically shows the highest RPO growth, then gradual burndown through the year as revenue recognizes faster than new bookings. Don’t mistake normal seasonality for business deterioration.
Decision rule: Compare year-over-year, not quarter-to-quarter. Q3 FY25 cRPO vs. Q3 FY24 cRPO (Salesforce +10%) tells the true story, not Q3 vs. Q2 sequential.
Pitfall 5: Treating all RPO disclosures as comparable
Companies have discretion in RPO disclosure details. Some report total RPO, others only current. Some break out by product, geography, or billing term; others provide minimal detail. SAP calls it “cloud backlog” not RPO. Normalize terminology before comparing across companies.
Solution: Build a standard template that maps each company’s unique disclosures to common metrics: total obligations, 0-12 month obligations, 12+ month obligations, billed vs. unbilled if disclosed.
Actionable One-Page Checklist
Gather RPO data: Current RPO, total RPO, deferred revenue (current + non-current) from 10-K/Q filings
Calculate growth rates: cRPO YoY%, revenue YoY%, billings YoY% (revenue + Δ deferred revenue)
Assess contract duration: Total RPO / Current RPO should be 2-4x for healthy multi-year commitments
Check conversion efficiency: Current period revenue / prior period cRPO should be >1.0x and stable
Verify cash quality: OCF growth ≥ cRPO growth, DSO <60 days, deferred revenue growing faster than receivables
Glossary
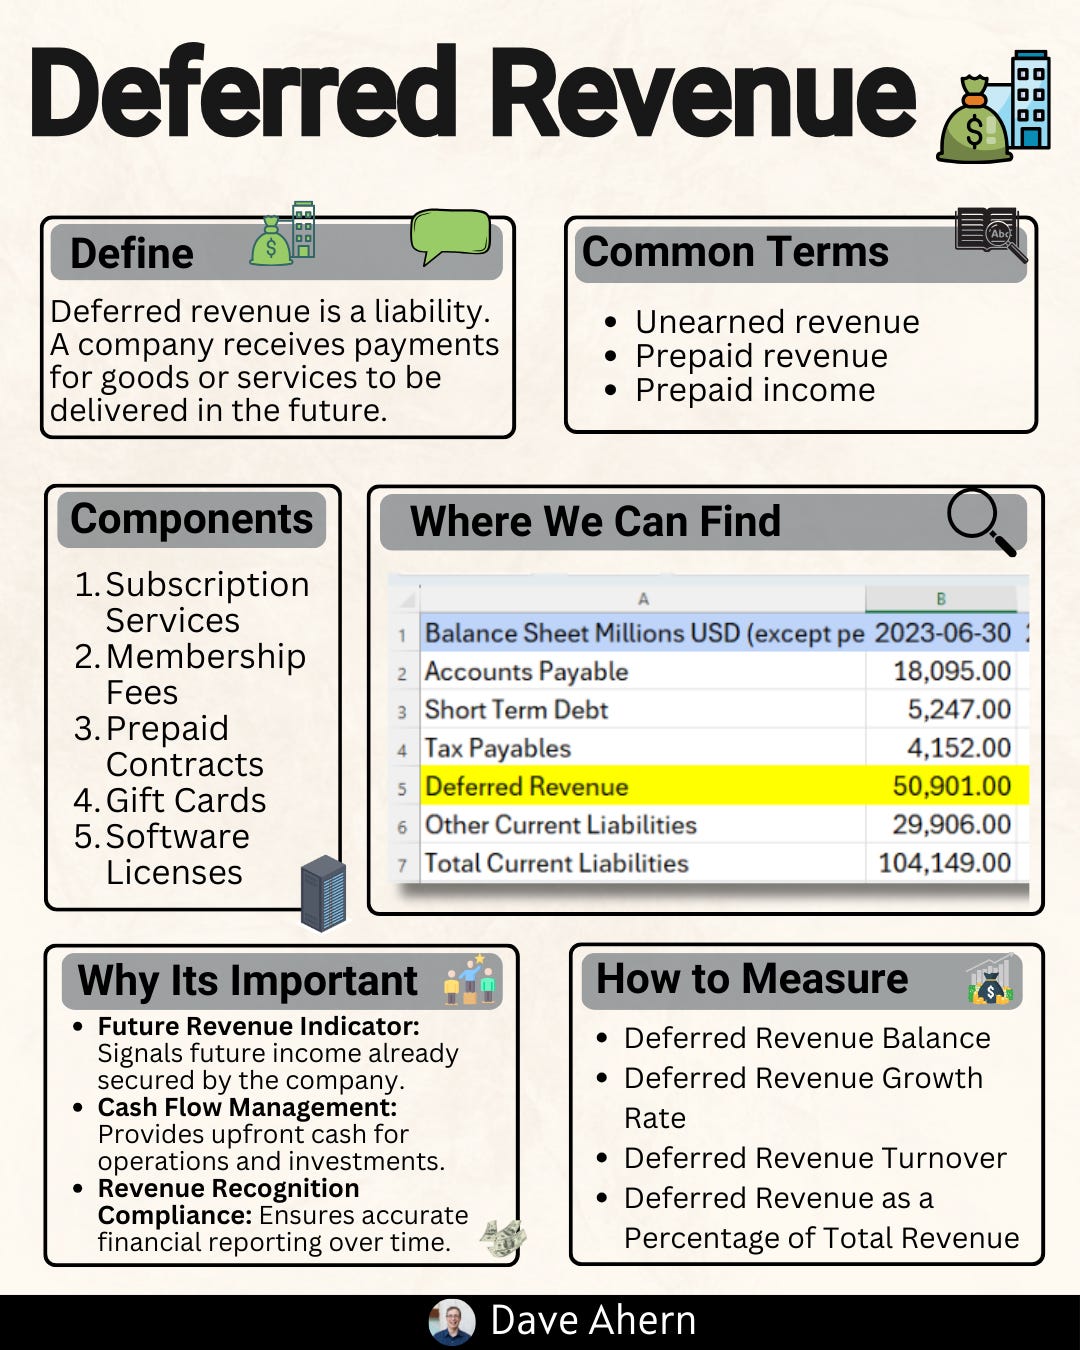
Deferred Revenue: Liability representing cash collected from customers for services not yet delivered.
RPO (Remaining Performance Obligations): Total contracted revenue not yet recognized, including both billed (deferred revenue) and unbilled backlog.
Current RPO (cRPO): Portion of RPO expected to convert to revenue within 12 months.
Billings: Revenue recognized plus change in deferred revenue; proxy for cash collected from customers.
Backlog: Contracted-but-unbilled future obligations; not on balance sheet but disclosed in RPO.
Revenue Recognition: Accounting principle determining when revenue is recorded on income statement (typically when services delivered).
Contract Liabilities: GAAP term for deferred revenue under ASC 606.
ASC 606: Accounting standard requiring RPO disclosure for public companies.
Bessemer Cloud Index Reports — Quarterly benchmarks for SaaS metrics including RPO trends (updated quarterly)
KeyBanc Capital Markets SaaS Survey — Annual survey covering 400+ private SaaS companies with billing and RPO data (published June annually)
Salesforce FY25 Annual Report (10-K) — Full revenue recognition policy and RPO footnotes (filed March 2025)
SAP Quarterly Statements — Detailed cloud backlog disclosures with segment breakouts (quarterly updates)
GAAP and Revenue Recognition (ASC 606) — Full accounting standard text for deep technical understanding
Educational content, not investment advice. This analysis presents frameworks for evaluating the accounting metrics of enterprise software companies. Investors should conduct their own due diligence and consult financial advisors before making investment decisions. Past performance does not guarantee future results.
This is very useful and interesting thank you so much!