
S& Global (SPGI): Durable Earnings or Not?

S&P Global’s earnings durability is underpinned by a highly recurring, asset-light information-services model with diversified monetization across credit ratings, indices, data/analytics, and commodity insights.
Structural moats include network effects (indices AUM-linked fees), brand and regulatory accreditation (NRSRO ratings), switching costs (embedded workflows, historical time series), and scale/data advantages. The largest swing factors are (1) ratings issuance cyclicality, (2) potential regulatory actions affecting take rates or methodology, and (3) competitive dynamics in data/analytics and index licensing.
Durability Score: 88/100.
It could rise with continued mix-shift to subscription/recurring revenues, broadened index AUM penetration, and stable regulatory posture; it could fall with prolonged issuance droughts or material regulatory/take-rate changes that compress margins.
1) Business model and end-market mapping
Revenue drivers:
Price: subscription list pricing, contractual escalators; licensing rates on AUM-linked indices; transaction fees on ratings.
Volume: bond/loan issuance volumes, index AUM and ETF creations, data seats/users, consumption-based data feeds, commodity assessments/trading services.
Mix: shift toward data feeds/enterprise solutions; higher-yield index licensing; non-transaction ratings and surveillance.
Value chain and risk bearing:
Credit risk is borne by issuers/investors; SPGI bears primarily reputational and regulatory risk (especially in Ratings).
No inventory/commodity risk; Commodity Insights monetizes price assessments and analytics.
Regulatory exposure meaningful in Ratings (NRSRO, ESMA, FCA, etc.).
Secular vs cyclical exposure:
Secular: growth in passive investing (indices), data proliferation/automation, private markets data, climate/ESG analytics, energy transition insights.
Cyclical: credit issuance cycles; macro risk appetite; market volumes affecting index-linked AUM.
Cash flow model:
Asset-light; low maintenance capex and high inherent operating leverage.
High gross margins; structural scalability as datasets, methodologies, and platforms are reused across clients.
Source: segment and business model descriptions in 10-Ks (2024 10-K).
2) Moats and competitive dynamics
Moat sources:
Network effects: S&P DJI indices embedded in trillions of AUM; benchmark standard status supports durable licensing.
Switching costs: deep integration of datasets (Capital IQ Pro, Ratings, Platts) into client models, workflows, back-tests.
Brand and regulatory accreditation: S&P Global Ratings is a leading NRSRO with entrenched market acceptance.
Scale/data/IP: proprietary time series, methodologies, price assessments; breadth across asset classes and sectors.
Distribution: global enterprise relationships; multi-segment cross-sell.
Competitive set and disruption vectors:
Ratings: Moody’s, Fitch; potential platform disintermediation limited by regulation and investor requirements.
Indices: MSCI, FTSE Russell; threats include custom/direct indexing, fee pressure; but category remains oligopolistic.
Market Intelligence/Data: Bloomberg, FactSet, LSEG/Refinitiv, Morningstar; open-source/AI agents could pressure “commodity data,” but proprietary content + workflow tools mitigate.
Commodity Insights: Argus, ICIS; methodology trust and adoption create barriers.
Concentration/embeddedness:
10-Ks typically disclose no single customer >10% of revenue; long-term contracts with auto-renew mechanics for many subscriptions; multiyear index/ETF arrangements.
Source: risk factors, business, and competition sections in 10-Ks (2024 10-K).
3) Financial signals of durability
Durable earnings narrative (based on the above)
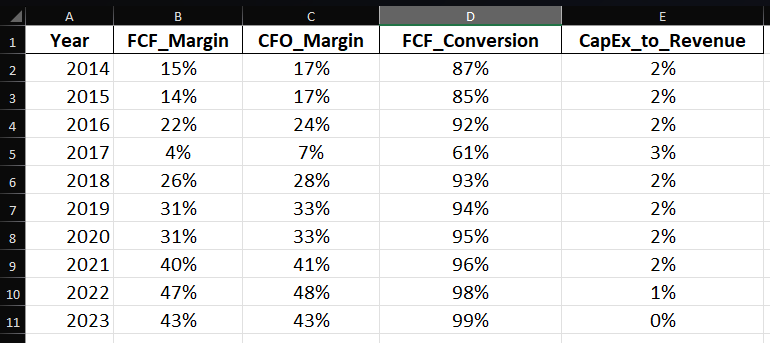
Recurring, high-margin model: Average CFO margin ~29% and FCF margin ~27% over a decade indicate strong cash generation relative to sales, consistent with subscription/data/rating franchises. Low CapEx intensity (~1.8% of revenue) supports robust cash conversion into FCF without heavy reinvestment needs.
Capex-light durability: With limited PP&E investment required, growth has been funded primarily through operating cash. This structure typically scales well and cushions cash flows in down-cycles.
FCF resilience and improvement: Despite a pronounced dip in 2017 (FCF margin ~4%), the company rebounded quickly, with FCF margins in the 25–47% range from 2018 onward. The step-up through 2021–2023, alongside revenue CAGR of ~7.7%, underscores durable cash profitability.
Strong FCF conversion: Average FCF/CFO conversion of ~90% (using only CapEx) highlights minimal leakage from operating cash flows to sustain the asset base, amplifying cash available for debt service, buybacks, dividends, or selective M&A.
Scale benefits and mix shift: From 2014 to 2023, revenue roughly doubled (4.27B → 8.30B), while FCF increased more than 5× (0.63B → 3.56B), implying expanding operating leverage and mix toward higher-value analytics/benchmarks. The 2022 integration period aligns with the visible step-up in both revenue and cash generation afterward.
Volatility note: 2017 is the outlier year in this series. Excluding that year, both margins and FCF growth display a steadier trajectory, reinforcing the “durable earnings” characterization over the broader period.
Key formulas:
Sustainable growth: g=Reinvestment Rate×ROIC
Accruals ratio (simplified): Accruals=Average Total Assets(ΔCurrent Assets−ΔCash)−(ΔCurrent Liabilities−ΔDebt)−Depreciation
4) Stress tests and “kill switches”
Prior shock performance:
2020 issuance volatility; 2022–2023 Ratings downturn; resilience from non-transaction and index/data segments.
Source: MD&A discussions (2022–2024 10-Ks).
Scenario tests (illustrative structure):
Scenario A: Credit issuance shock −30% for 4 quarters → Ratings revenue/margin down; partial offset from subscriptions and indices AUM if markets recover.
Scenario B: Regulatory take-rate cut in indices or pricing oversight in Ratings (e.g., −20–50 bps on specific fee lines) → multiple compression risk; mitigants include product mix and volume growth.
Scenario C: Share loss to competing data/desktop in EMEA financials (e.g., −5% data seats) → modest revenue impact; counter by bundling and workflow stickiness.
Single points of failure and mitigants:
Ratings methodology credibility/regulatory status → governance, compliance, transparency.
Index AUM concentration risk → product breadth, custom indices, derivatives/ETP ecosystem depth.
5) Reinvestment runway
New products/adjacencies:
Private markets datasets/analytics, climate/ESG (Sustainable1), AI-enabled research and data engineering, index innovation (thematics, factors), commodity transition analytics.
Geographic white space:
EM debt/ETFs penetration; APAC data and index adoption; local-language workflow tools.
Returns on new investments:
Historically strong IRR for IP-rich expansions; watch post-merger synergy capture and integration ROI (IHS Markit merger closed 2022).
Source: strategy disclosures and FY releases (2022 results note Investor Day model).
Capital allocation:
Dividends and buybacks (ASRs in 2022–2024), selective M&A and divestitures to optimize portfolio (e.g., regulatory-related asset sales).
Source: capital returns and repurchase program details in 10-Ks (2024 10-K).
6) Linking durability to valuation
Higher ROIC + reinvestment → higher and longer growth g.
Predictable cash flows and recurring mix → lower required return k.
Stable-growth intuition: EP=(k−g)(1−b),b=retention rate
What can expand/contract the multiple:
Expanders: issuance up-cycle, recurring mix gains, AI/data monetization, benign regulation, lower real rates.
Contractors: regulation/take-rate pressure, prolonged issuance drought, fee deflation in indices/data, higher rates.
Optional narrative (DCF/EVA):
Durability supports long advantage period; terminal fade modest if moats persist. Use 10-K cash flows and Yahoo Finance WACC inputs to frame scenarios (do not fabricate).
7) Return decomposition (5–10 years)
TSR framework: TSR≈FCF/share growth+Dividend Yield+ΔMultiple
Base case (qualitative assumptions):
FCF/share growth: MSD-to-HSD from mix-shift to recurring + issuance normalization; modest margin expansion; ongoing buybacks reduce share count.
Dividend yield: low current yield with steady annual raises; payout remains conservative versus FCF.
Multiple: stable to modest compression if rates rise; expansion if durability narrative strengthens.
Bear case:
Ratings trough extended; regulatory friction; limited index fee growth → lower FCF growth and some multiple compression.
Bull case:
Strong multi-year issuance rebound; index AUM compounding; AI-enabled operating leverage → higher FCF/share growth; multiple holds or expands.
Sensitivity (qualitative):
±1–2 P/E turns meaningfully impacts TSR given elevated starting multiple; ±200 bps in g has outsized effect via both earnings path and justified multiple.
8) Practical checklist (score each 1–10; weight)
Network effects and switching costs (15): 9
Pricing power (15): 9
Cyclicality and shock resilience (10): 7
Customer/supplier concentration (10): 9
Cash conversion and capital intensity (10): 9
ROIC level and fade risk (15): 9
Regulation risk (10): 6
Disruption risk (10): 7
Reinvestment runway (10): 8
Accounting quality (5): 8
Durability Score (0–100) = 88
Biggest drivers: network effects and brand/regulatory status in Ratings and Indices; asset-light cash conversion.
What could move it ±10: Regulatory/take-rate actions (down), or accelerated recurring mix/AI-enabled productivity gains (up).
9) What to monitor quarterly
Core issuance/transaction trends vs market volumes; monthly Billed Issuance (as disclosed).
Index AUM, ETF flows, licensing yields; new index launches.
Subscription growth in Market Intelligence and Commodity Insights; attach and seat metrics.
Margin trajectory (adjusted vs GAAP); cost discipline and synergy capture.
FCF conversion; buybacks; share count; leverage.
Regulatory developments (SEC/ESMA/FCA) and any notable cases.
Key partnerships, renewals, and ecosystem integrations (ETF sponsors, exchanges).
Guidance changes and variance analysis.
Sources: quarterly earnings materials (see Quarterly Earnings hub) and 10-Qs.
10) Risks and catalysts
Risks:
Issuance cyclicality (medium likelihood/medium–high impact).
Regulatory/take-rate changes (low–medium likelihood/high impact).
Fee pressure in indices/data or share loss to competitors (medium/medium).
Methodology/operational lapses (low/high due to reputational leverage).
Catalysts:
Issuance rebound cycles; new index adoptions; major data contract wins.
AI features that increase product differentiation and pricing.
Portfolio optimization (value-accretive M&A/divestitures).
Regulatory clarity or positive rulings.
11) Sources
Primary sources:
FY2024 results release: Press Release
Annual report: Annual Report 2024 | S&P Global
Disclosures: Educational content. Not investment advice.
The only one should invest is by learning price volume action and the ability to take losses.