
Reverse DCF: What Growth Is Priced In?

You already know Mastercard is a great business. Network effects, 60% operating margins, and minimal capital requirements. The quality is obvious. But here’s the question that actually matters: At $521 per share, what growth rate does the market expect Mastercard to deliver?
Most investors run a DCF model to estimate a stock’s value. That’s useful, but it requires you to forecast growth rates, which means you’re just guessing. A reverse DCF flips this around. You start with the current stock price and work backward to determine which growth assumptions are already baked into it. This tells you what the market expects, and you can then decide whether those expectations seem reasonable or absurd.
In this article, I’ll show you how to run a reverse DCF on Mastercard and Visa, what the results reveal about market expectations, and how to use this tool to make better buy/sell decisions.
Why Reverse DCF Matters More Than Forward DCF
Traditional DCF models are a trap. You plug in your best guess for revenue growth over the next 10 years, pick a discount rate, calculate a terminal value, and get a precise-looking number. The problem? Garbage in, garbage out. Your intrinsic value estimate is only as good as your growth assumptions, and nobody can reliably forecast a decade of growth.
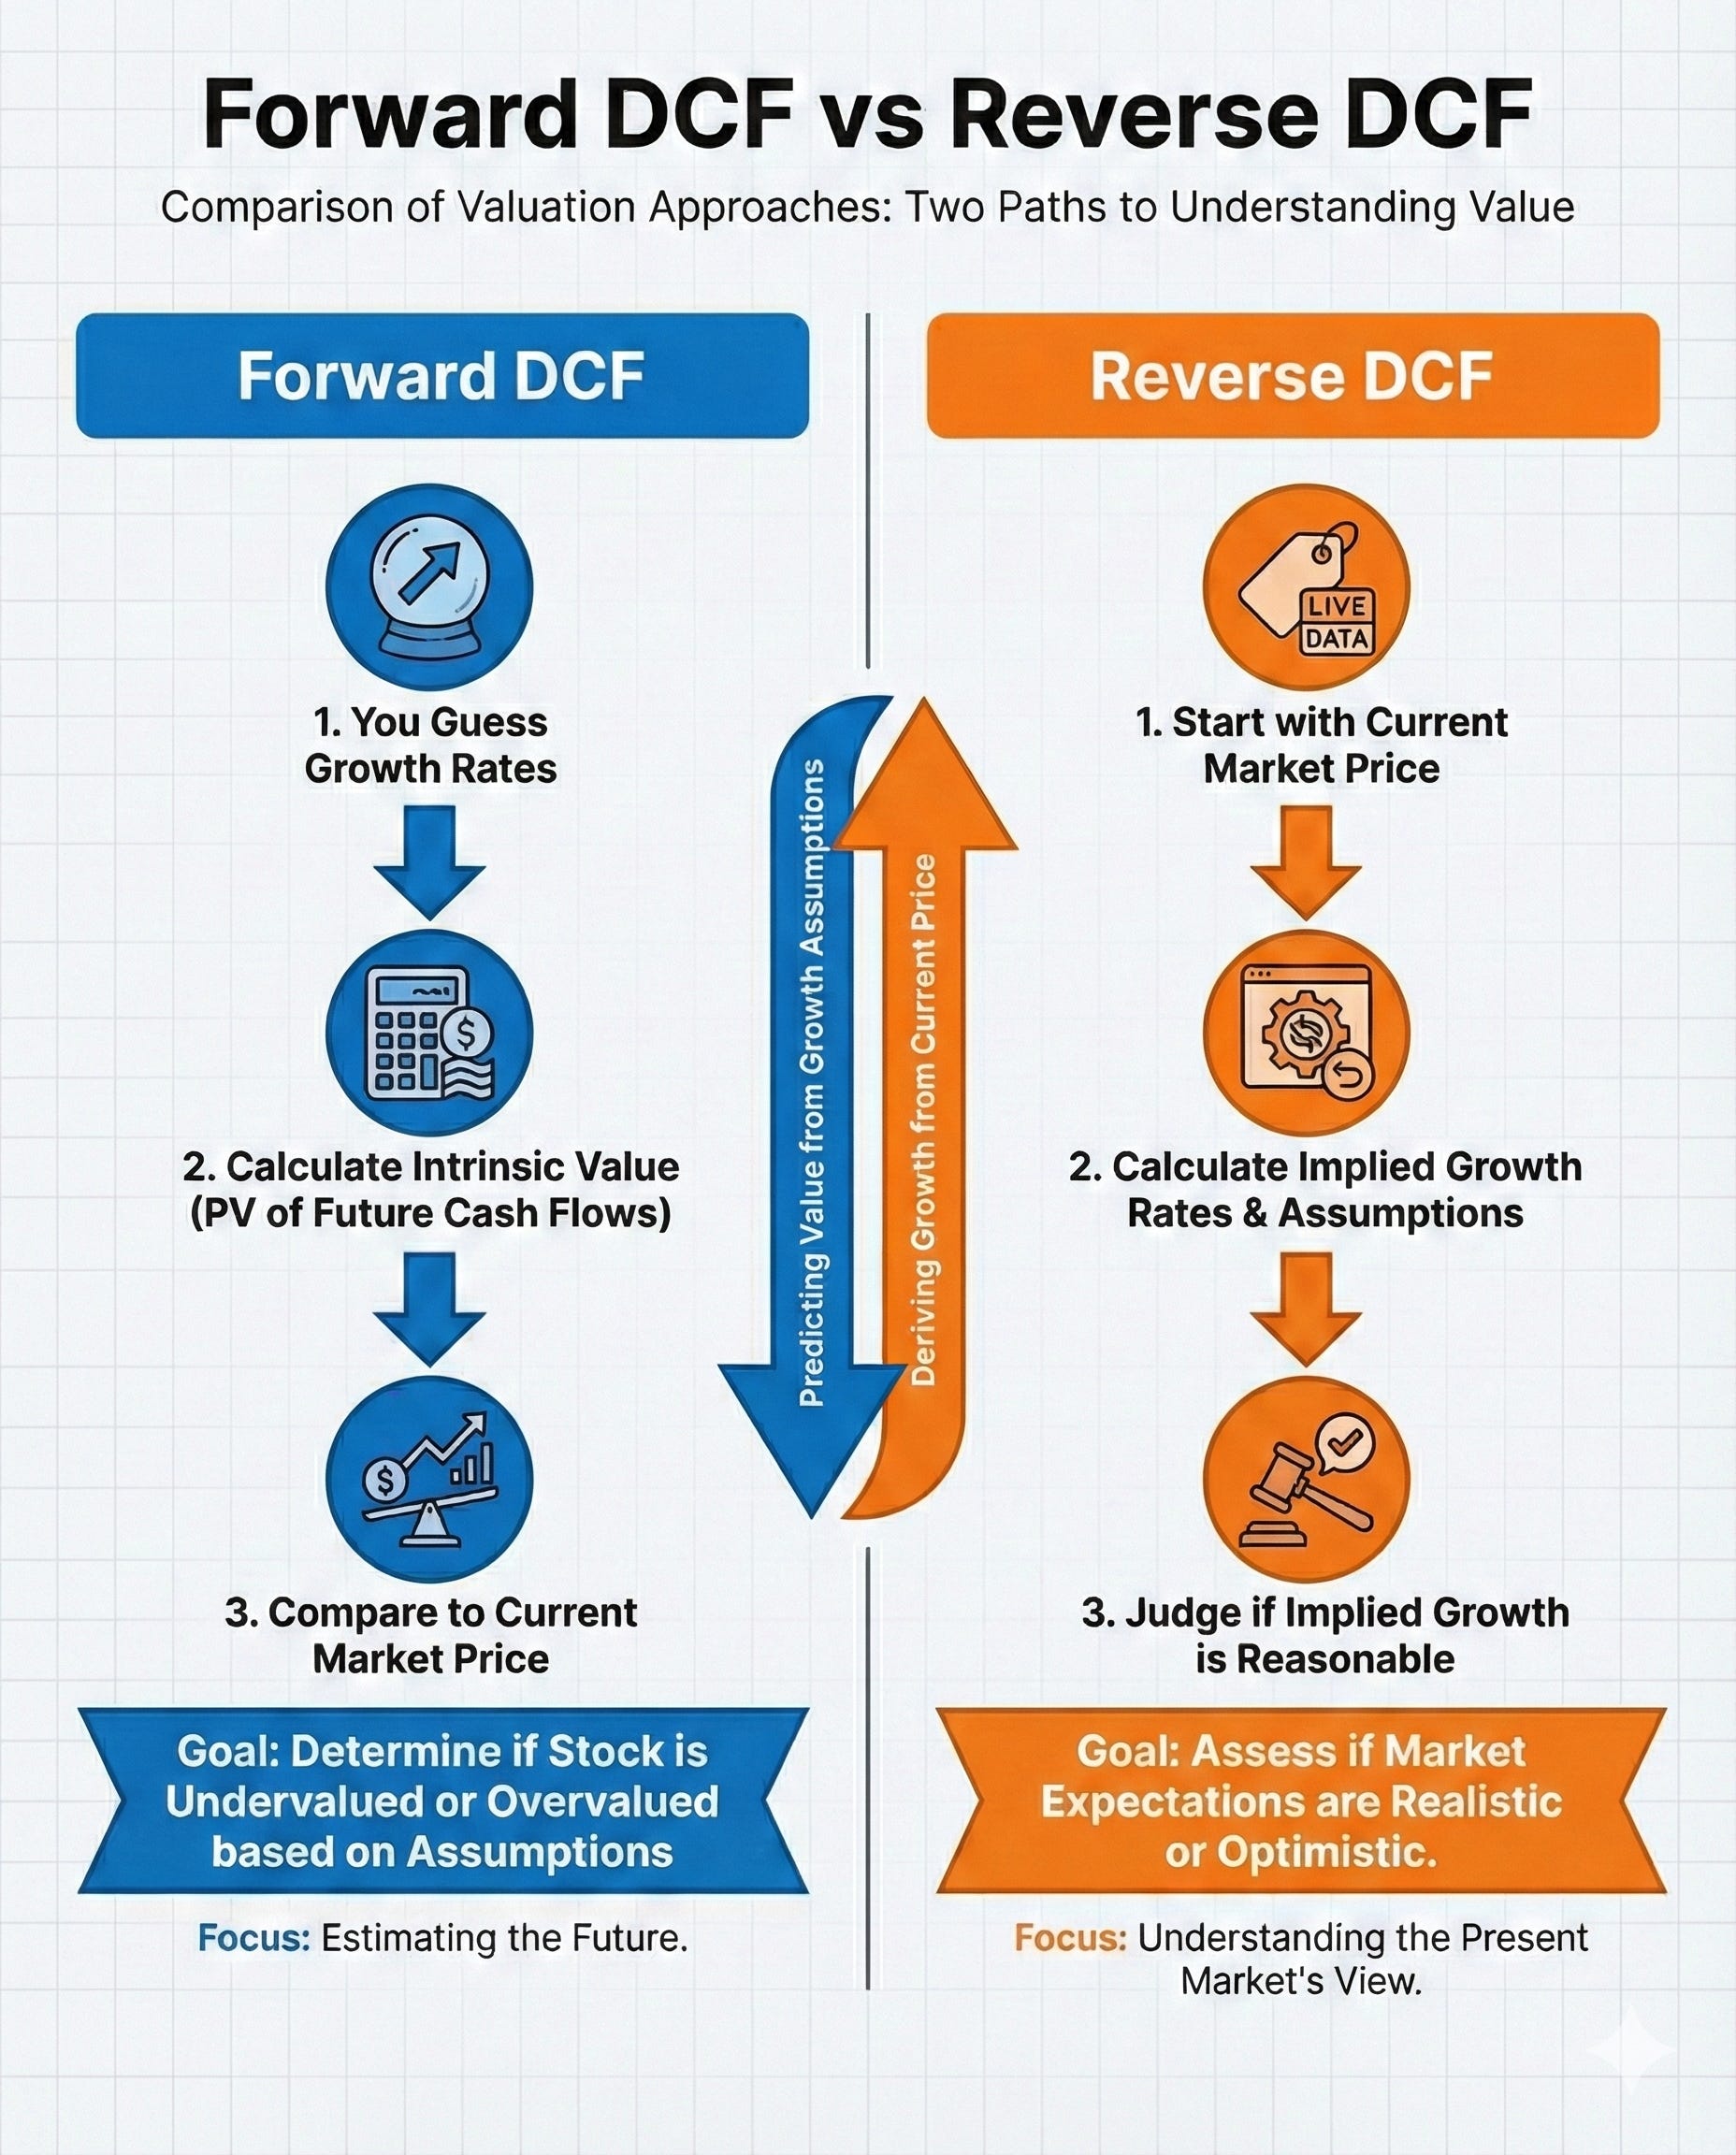
A reverse DCF solves this problem. Instead of asking “What is this worth?” it asks “What does the market think this is worth?“ You take the current stock price as a given and solve for the implied growth rate. This number becomes your benchmark. If the market expects 15% annual revenue growth and you think the company can only manage 10%, you know the stock is overpriced. If the market expects 8% and you believe 12% is achievable, you’ve found a potential opportunity.
The key insight: you don’t need to be right about the exact intrinsic value. You just need to be more right than the market’s current expectations.
Want to screen for all three types yourself? Paid members get my Dividend Safety Spreadsheet, built-in formulas that score any dividend stock in minutes, no setup needed.
The Reverse DCF Formula
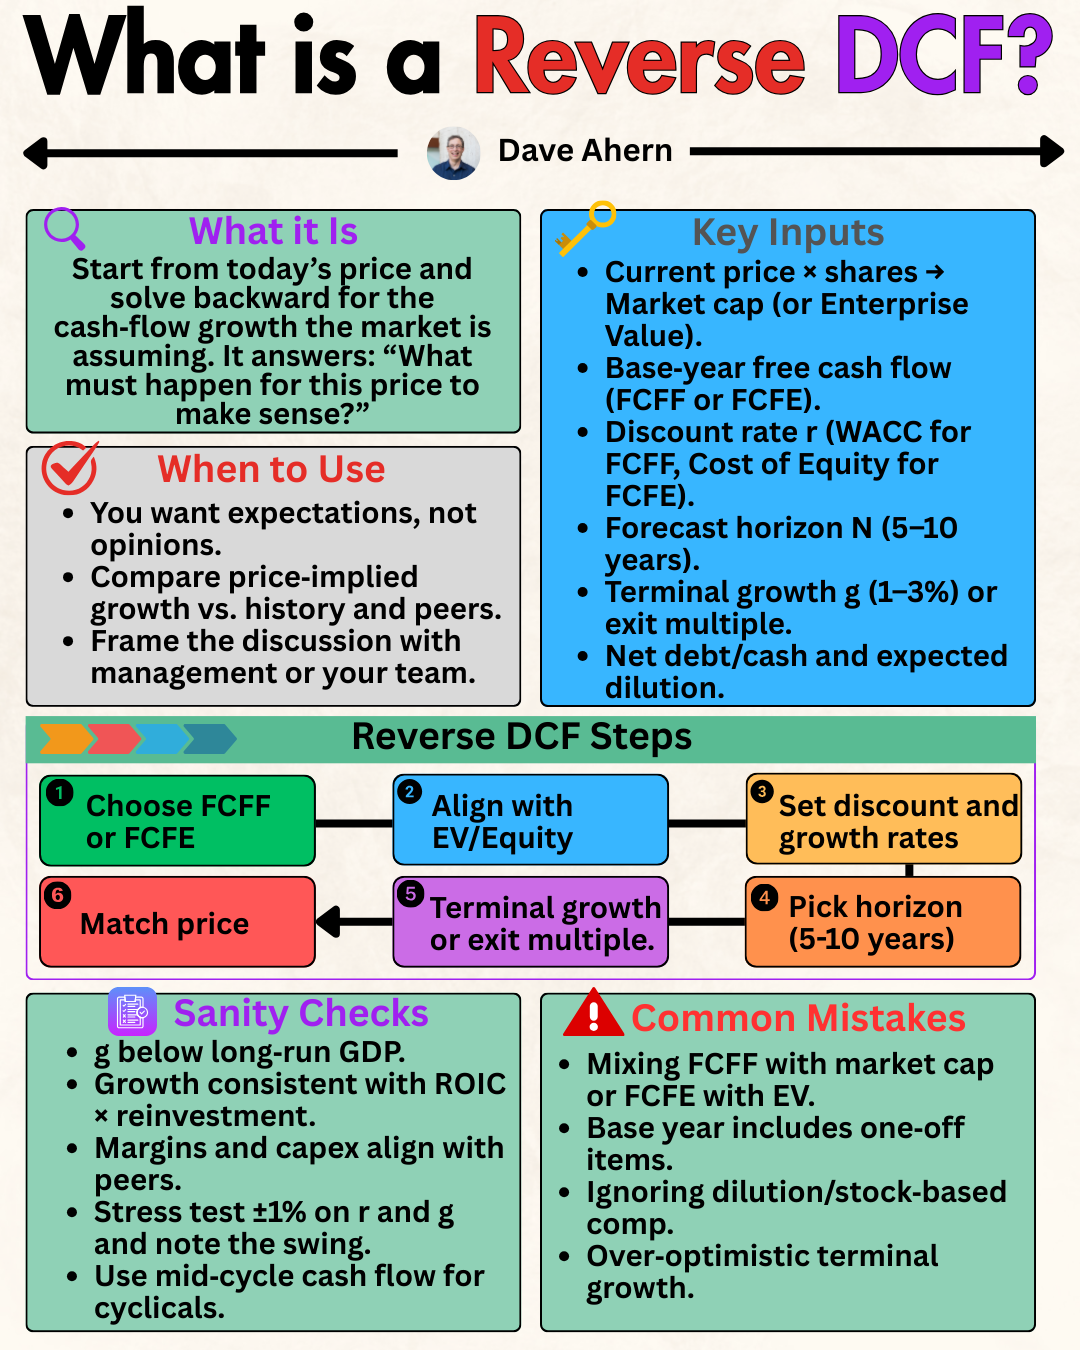
Here’s what you need for a reverse DCF calculation:
Current stock price (what the market says it’s worth)
Current free cash flow (or net income as a proxy)
Shares outstanding (to convert per-share price to total market value)
Discount rate (typically 9-10% for most companies)
Terminal growth rate (2-3% perpetual growth assumption)
The formula works like this:
Market Cap = PV of Future Cash Flows
We know the market cap (stock price × shares outstanding). We know today’s cash flow. We’re solving for the growth rate that makes the present value of all future cash flows equal the current market cap.
The math gets complex because you’re solving for growth rate in a multi-stage DCF model, but the concept is simple: what growth rate justifies this price?
Mastercard: What Growth Is Priced In?
Let’s run the numbers for Mastercard using data from fiscal.ai (sourced from SEC filings).
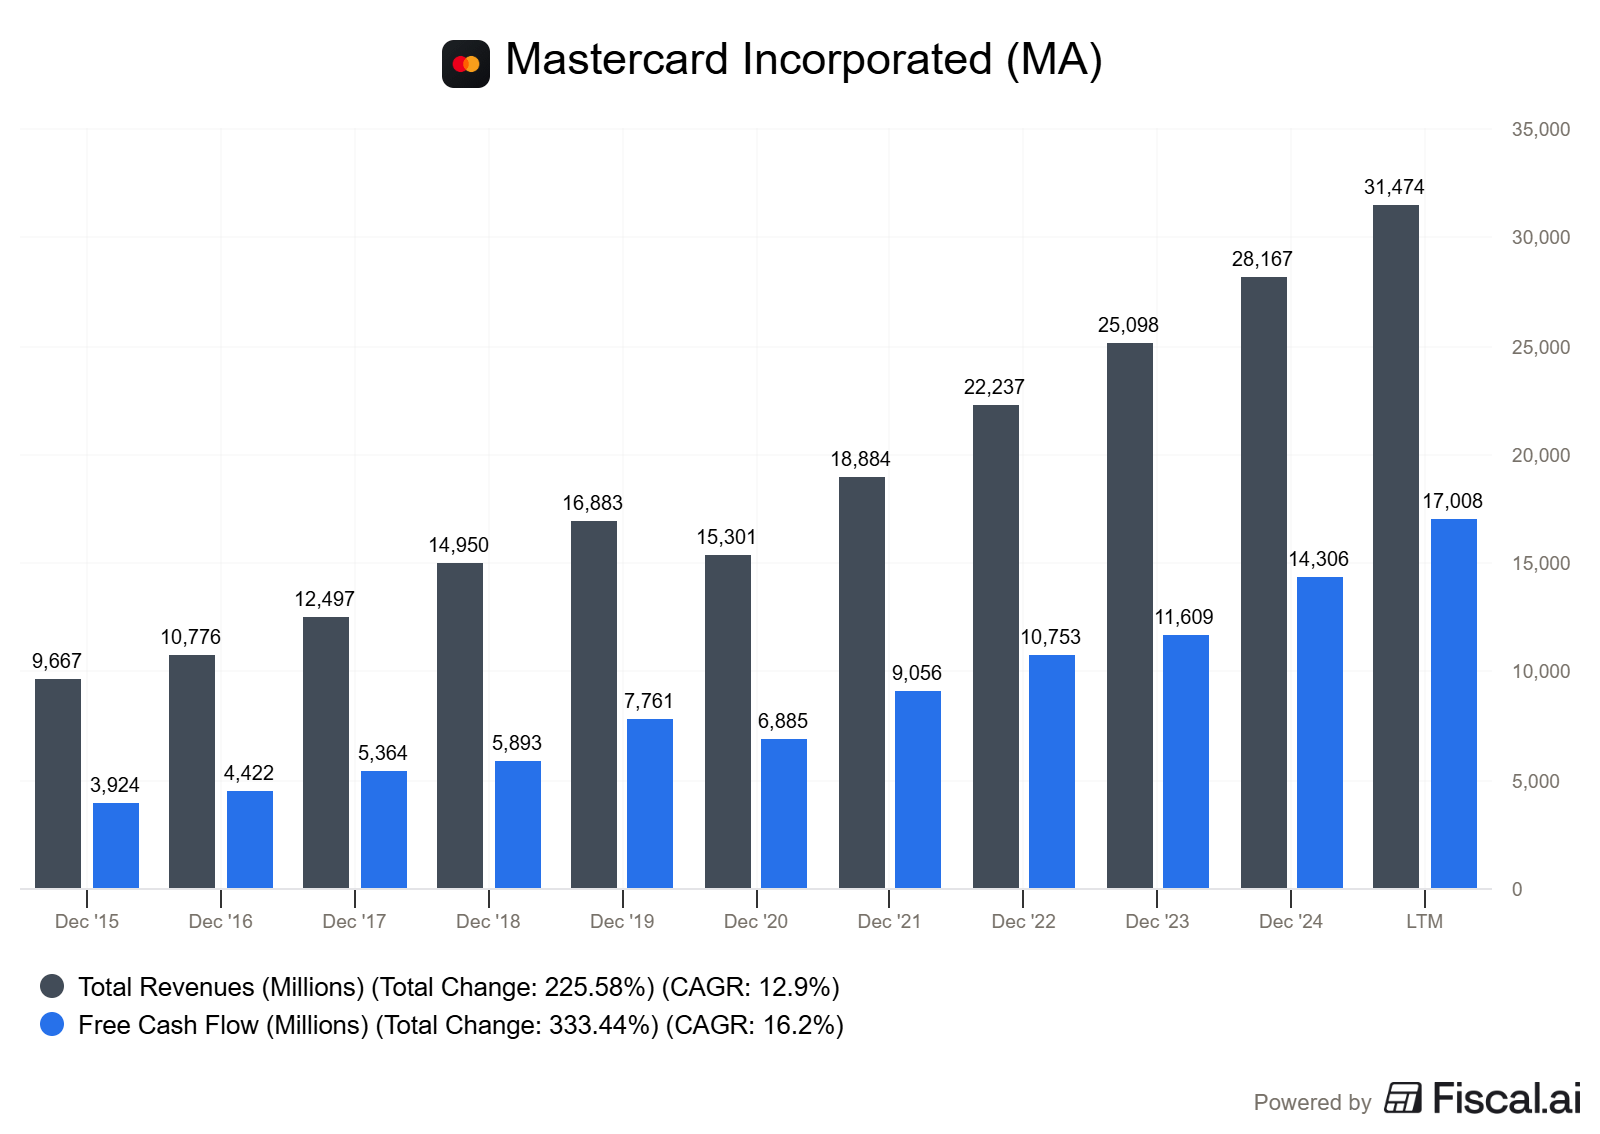
Mastercard’s Current Metrics (as of the latest twelve months):
Stock price: $521.49
Shares outstanding: 898 million
Market cap: $468 billion ($521.49 × 898M)
Free cash flow: $17.0 billion
Historical revenue CAGR (2015-LTM): 12.9%
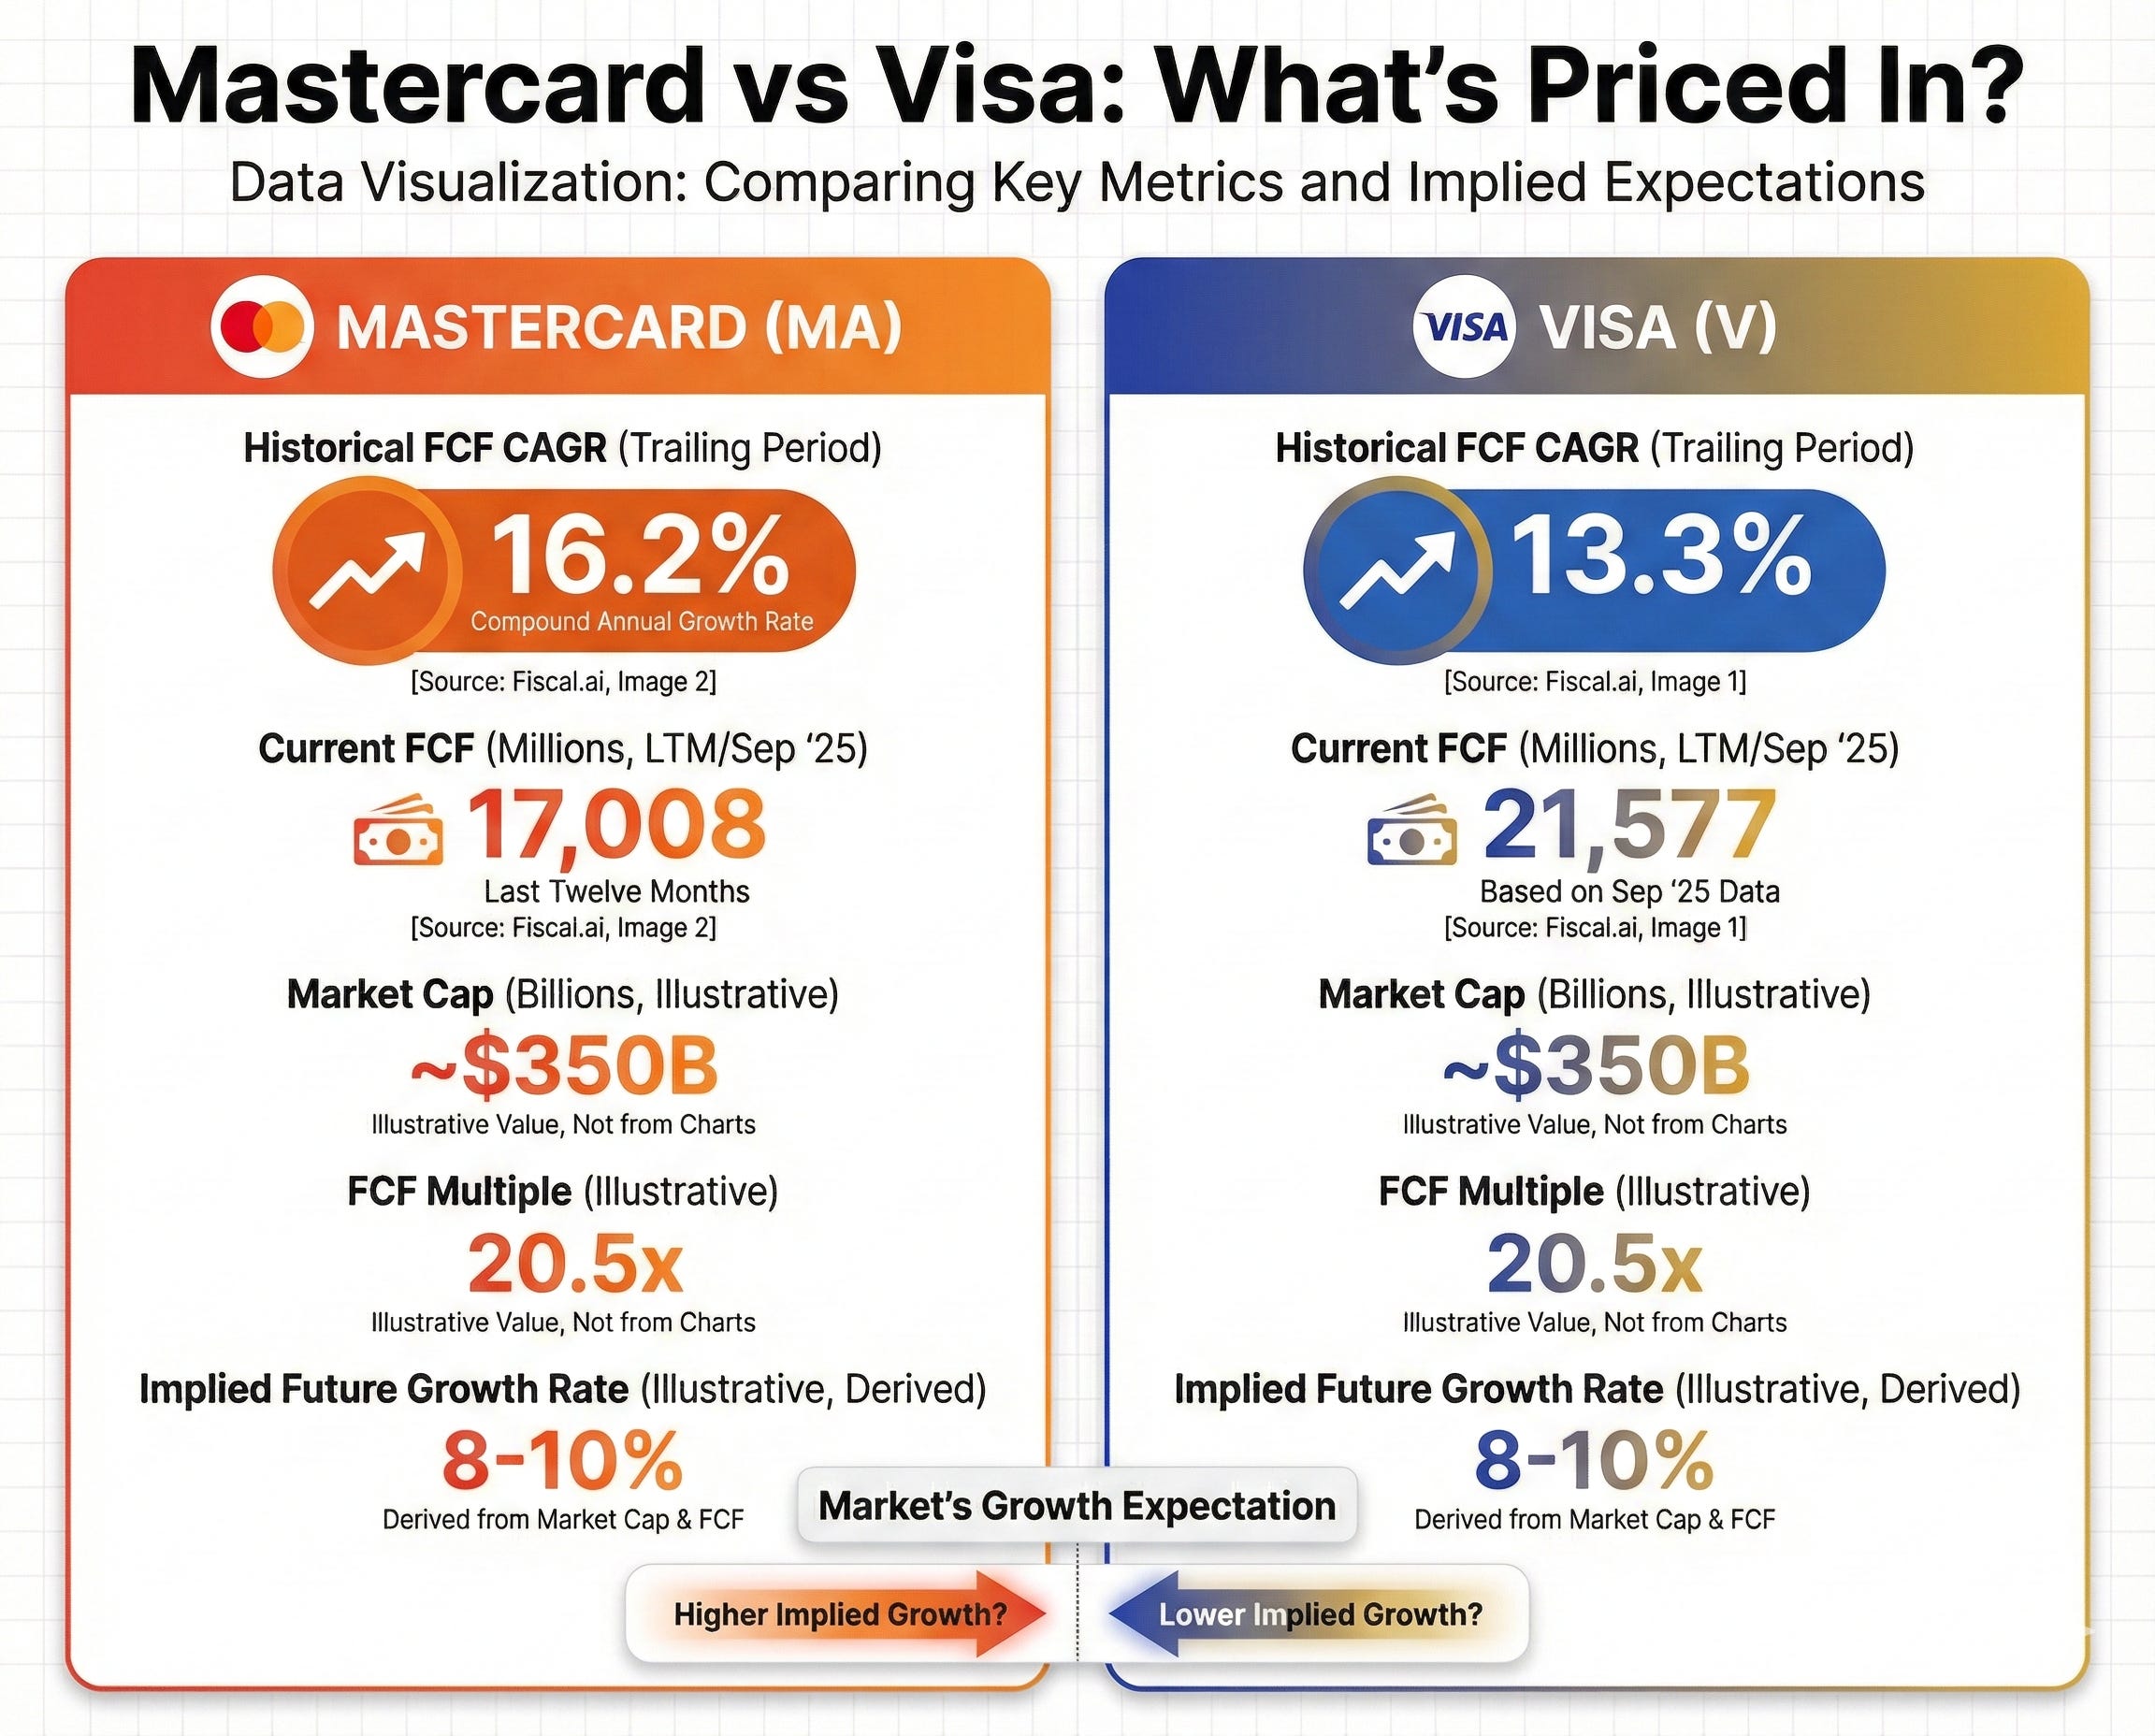
Historical FCF CAGR (2015-LTM): 16.2%
Mastercard generated $17.0 billion in free cash flow over the last twelve months. The market is valuing this cash flow stream at $468 billion. That implies significant growth expectations.
Using a 10% discount rate and 3% terminal growth rate, I can work backwards from the $468 billion market cap. The calculation shows that the market is pricing in approximately 13-14% annual free cash flow growth for the next 10 years.
Let’s put that in context. Over the past decade (2015-LTM), Mastercard delivered:
Revenue CAGR: 12.9%
Free cash flow CAGR: 16.2%
The market expects Mastercard to maintain its historical pace. Not accelerate. Just keep doing what it’s been doing. That’s a reasonable expectation for a company with Mastercard’s competitive position, but it leaves little room for disappointment.
If Mastercard grows free cash flow at 10% annually instead of 14%, the stock is overvalued at current prices. If it sustains 16% growth (matching its historical rate), there’s upside from here.
Visa: A Direct Comparison
Now let’s look at Visa, Mastercard’s closest peer.
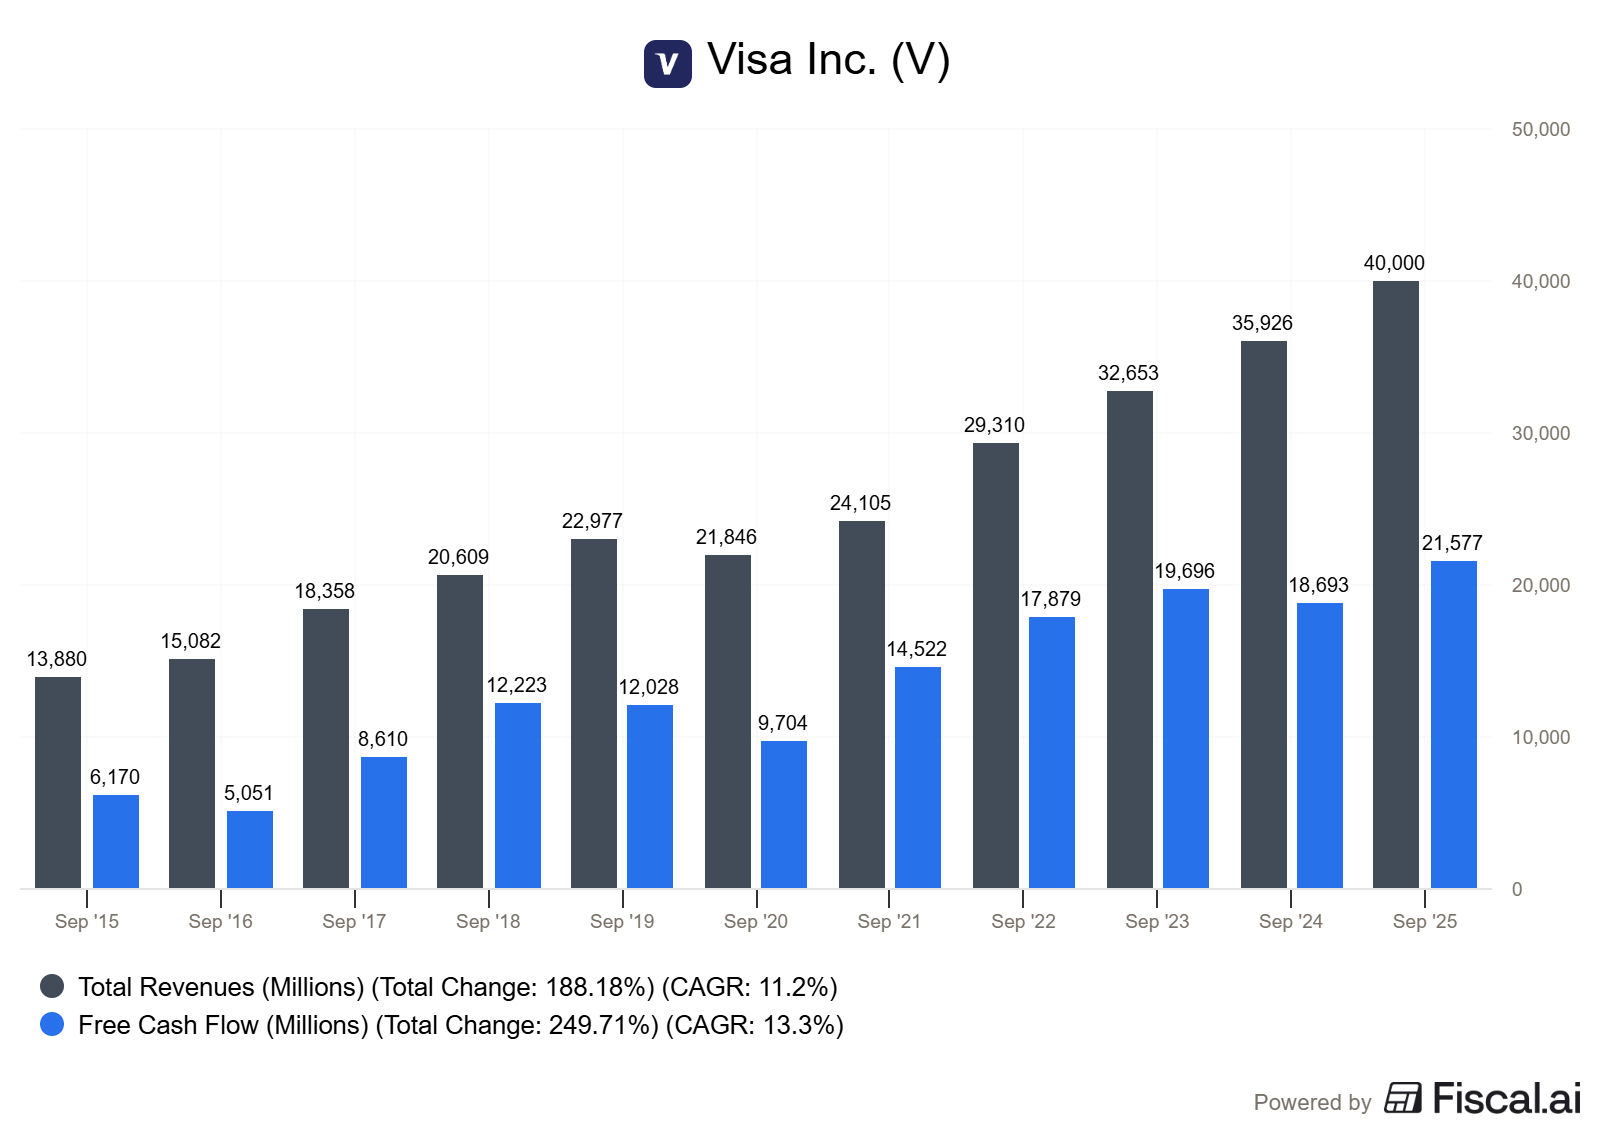
Visa’s Current Metrics (as of September 2025):
Stock price: $326.53
Shares outstanding: 1,927 million
Market cap: $629 billion ($326.53 × 1,927M)
Free cash flow: $21.6 billion
Historical revenue CAGR (2015-2025): 11.2%
Historical FCF CAGR (2015-2025): 13.3%
Visa generated $21.6 billion in free cash flow. The market values this at $629 billion. Using the same 10% discount rate and 3% terminal growth, the market is pricing in approximately 12-13% annual free cash flow growth for the next decade.
Here’s what’s interesting: Visa has a larger market cap ($629B vs $468B) despite similar growth expectations. This makes sense when you look at scale. Visa produces $21.6B in annual FCF versus Mastercard’s $17.0B. Visa is 27% larger by cash flow but only 34% larger by market cap, suggesting slightly more favorable pricing for Visa on a relative basis.
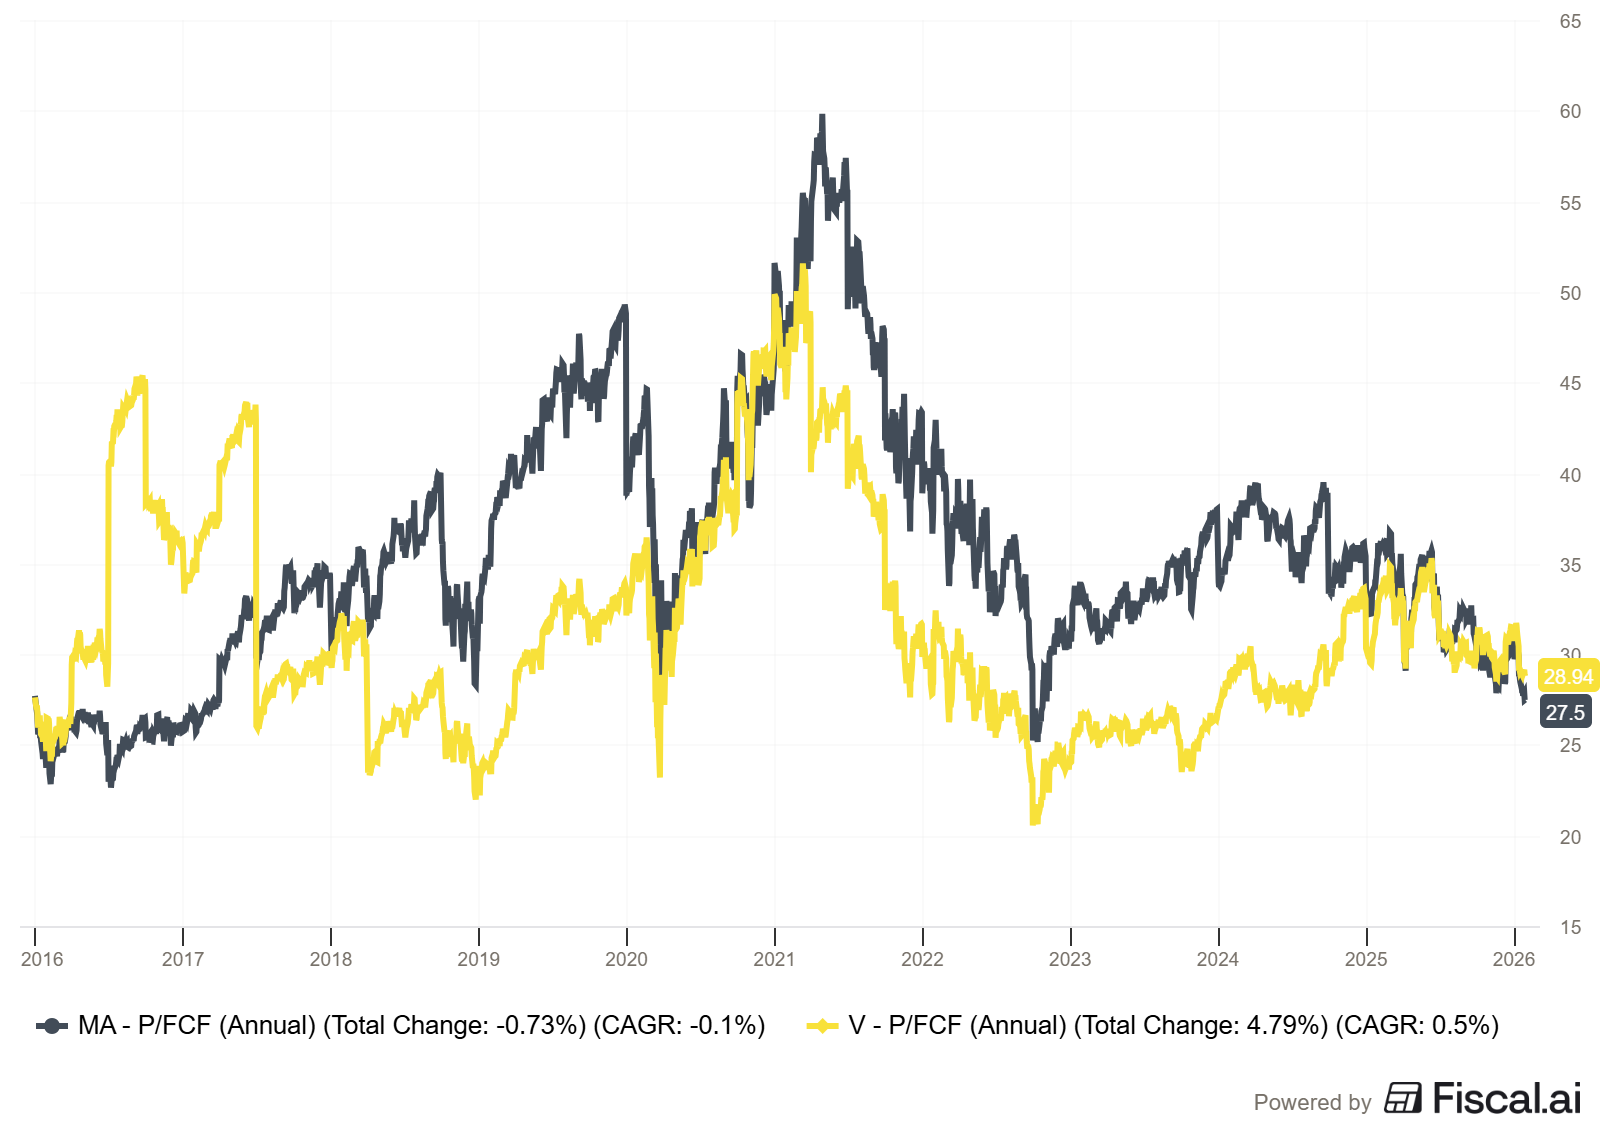
Both companies trade at roughly 28-29x trailing free cash flow, and both are priced for mid-teens growth. The market sees them as essentially interchangeable from a valuation perspective.
The framework is the easy part. Knowing whether a specific stock actually qualifies as a safe Compounder or Anchor is where most investors get stuck.
The Dividend Safety Spreadsheet, included with paid membership, does that work for you.
What This Means for Your Investment Decision
A reverse DCF doesn’t tell you whether to buy or sell. It tells you what you need to believe.
To justify buying Mastercard at $521:
You need to believe the company can sustain 13-14% annual FCF growth for the next decade
You need to believe its competitive moat remains intact as digital payments saturate developed markets
You need to believe international expansion and value-added services can offset slowing transaction volume growth
To justify buying Visa at $327:
You need to believe roughly the same things, with nearly identical growth expectations priced in
The historical data shows that both companies have delivered this level of growth. Mastercard’s 16.2% FCF CAGR and Visa’s 13.3% FCF CAGR over the past decade suggest these expectations are achievable. But here’s the risk: both companies benefited enormously from the secular shift away from cash toward digital payments over the last 10 years. That tailwind won’t blow as strongly going forward.
The question isn’t “Are these great businesses?” They obviously are. The question is “Can they meet the market’s baked-in growth expectations?” If you think yes, the valuation is fair. If you think not, wait for a better price.
How to Use Reverse DCF in Your Process
Here’s how I use reverse DCF when evaluating quality companies trading at premium valuations:
Step 1: Calculate the implied growth rate using the current price and historical cash flows. This shows you what the market expects.
Step 2: Compare to historical performance. If the implied growth rate exceeds the company’s track record, the market is pricing in acceleration. If it’s lower, the market is pricing in deceleration. Both scenarios require extra scrutiny.
Step 3: Assess the competitive position. Does this company have the moat strength to sustain that growth rate? For Mastercard and Visa, the answer is likely yes in the medium term, but there are real questions about long-term runway as cash usage declines and digital payment penetration reaches saturation in developed markets.
Step 4: Create a sensitivity table. What happens to implied value if growth is 2% higher or lower than expected? This shows you the margin of safety (or lack thereof) in the current price.
Step 5: Monitor actual results against expectations. If the company starts delivering 10% growth when the market is priced in 14%, the stock will likely decline even though the business is still growing and healthy. Reverse DCF helps you understand this disconnect before it happens.
The power of this approach is that it forces you to think like a contrarian. When everyone loves a stock and bids it up, reverse DCF shows you exactly what optimism is priced in. When everyone hates a stock and sells it down, reverse DCF reveals whether the pessimism has gone too far.
Common Mistakes to Avoid
Mistake #1: Using net income instead of free cash flow without adjusting. Net income includes non-cash charges and doesn’t account for capital expenditures. For capital-light businesses like Mastercard and Visa, the difference is small, but for capital-intensive businesses, this error can yield wildly inaccurate results.
Mistake #2: Forgetting about share buybacks. Both Mastercard and Visa aggressively repurchase shares. Share count declined 19-21% over the past decade for both companies. This means per-share metrics can grow faster than the underlying business. When running a reverse DCF, use total free cash flow and market cap, not per-share figures, to avoid this distortion.
Mistake #3: Assuming linear growth. The reverse DCF calculation assumes smooth, consistent growth. Real businesses grow in lumps. They have good years and bad years. A company might deliver 14% average growth over a decade through a mix of 20% years and 8% years. The reverse DCF gives you the average expectation, not a year-by-year forecast.
Mistake #4: Ignoring the terminal value problem. In a traditional DCF, 60-80% of the intrinsic value typically comes from the terminal value assumption, which is essentially a guess about what happens after year 10. The reverse DCF faces the same limitation. Small changes to your terminal growth assumption (2% vs 3% perpetual growth) can significantly change the implied growth rate you calculate. Be aware of this sensitivity.
The Bottom Line
Mastercard at $521 and Visa at $327 are priced for 12-14% annual free cash flow growth over the next decade. Both companies have delivered this level of growth historically, making these valuations defensible but not cheap.
If you believe the digital payments revolution still has a long runway and these companies can maintain their competitive positions, current prices are reasonable. If you worry about saturation in developed markets, emerging fintech competition, or regulatory pressure, you should wait for a better entry point.
The reverse DCF doesn’t make the buy/sell decision for you. It clarifies what you’re betting on when you make that decision. And in investing, clarity about your assumptions is often more valuable than precision in your calculations.
Most investors understand dividend frameworks. Fewer can actually sit down with a stock and run the numbers.
Paid membership gives you the tools to bridge that gap — a Dividend Safety Spreadsheet, visual reference library, AI research prompts, and analytical calculators. Everything built to make analysis faster and more confident.