

Most dividend investors never open a 10-K or do any fundamental analysis. Instead, they rely on a yield number and a payout ratio from a screener. Meaning they are trusting someone else’s math. That’s a hard way to invest, and a little scary to gamble with their retirement money.
In the next 30 minutes, you will learn how to check the math yourself.
In today’s post, we will learn:
What a 10-K is and where to find it for free
The 30-minute tour through the filing, step by step
The numbers that tell you whether the dividend is safe and where to find them
A checklist you can save and reuse on any dividend payer
Okay, let’s dive in and read a 10-K together.
What a 10-K is and where to find it
A 10-K is the annual report every US public company files with the SEC. In it you will find the audited financial statements (income statement, balance sheet and cash flow statement), business description, risks, and any legal problems they would rather not discuss.
Pro tip: These are documents prepared by lawyers, polished by management and HR teams. They must disclose all pertinent financial information so any investor can make an informed decision. It does not mean they disclose everything willingly.
There are many ways to pull a 10-K, several of them free.
The first free one, and the most reliable, is sec.gov. Go to the EDGAR full-text search, type the company name or ticker, and filter for the “10-K.” No subscription is needed. Here you will find every U.S. publicly traded company and all of their financial reports from the 10-K and others such as:
10-Q (quarterly report)
8-K (news and updates)
Proxy filing (management voting and incentives)
13f (equity disclosures - what they have invested in)
Another free resource is the company website. Go to any company and look for the Investor Relations link. Here you will find tons of investor-related information, including links to the above filings. You will also find investor presentations, meeting notes, and other interesting information. A true treasure trove which most investors ignore.
Lastly, you can find the same information at your brokerage account, financial websites such as Fiscal.ai or Seeking Alpha. Many of these are paid, so keep that in mind.
Let’s use Johnson & Johnson as our guinea pig. J&J filed its most recent 10-K on February 11, 2026, covering the fiscal year that ended December 28, 2025. Every number we use below comes from that filing.
One note before the clock starts on our 30 minutes.
A 10-K can run a hundred pages, give or take; Netflix runs around 65, and JP Morgan over 200. Today you are not going to read all of them. The skill we will cover today is knowing which 20 pages matter for a dividend investor and saving the rest for later.
The best practice is to read the whole thing, time permitting. It is the best source of information for every company; remember, Warren Buffett has spent his whole career reading 10-Ks.
Set a timer. Here we go.
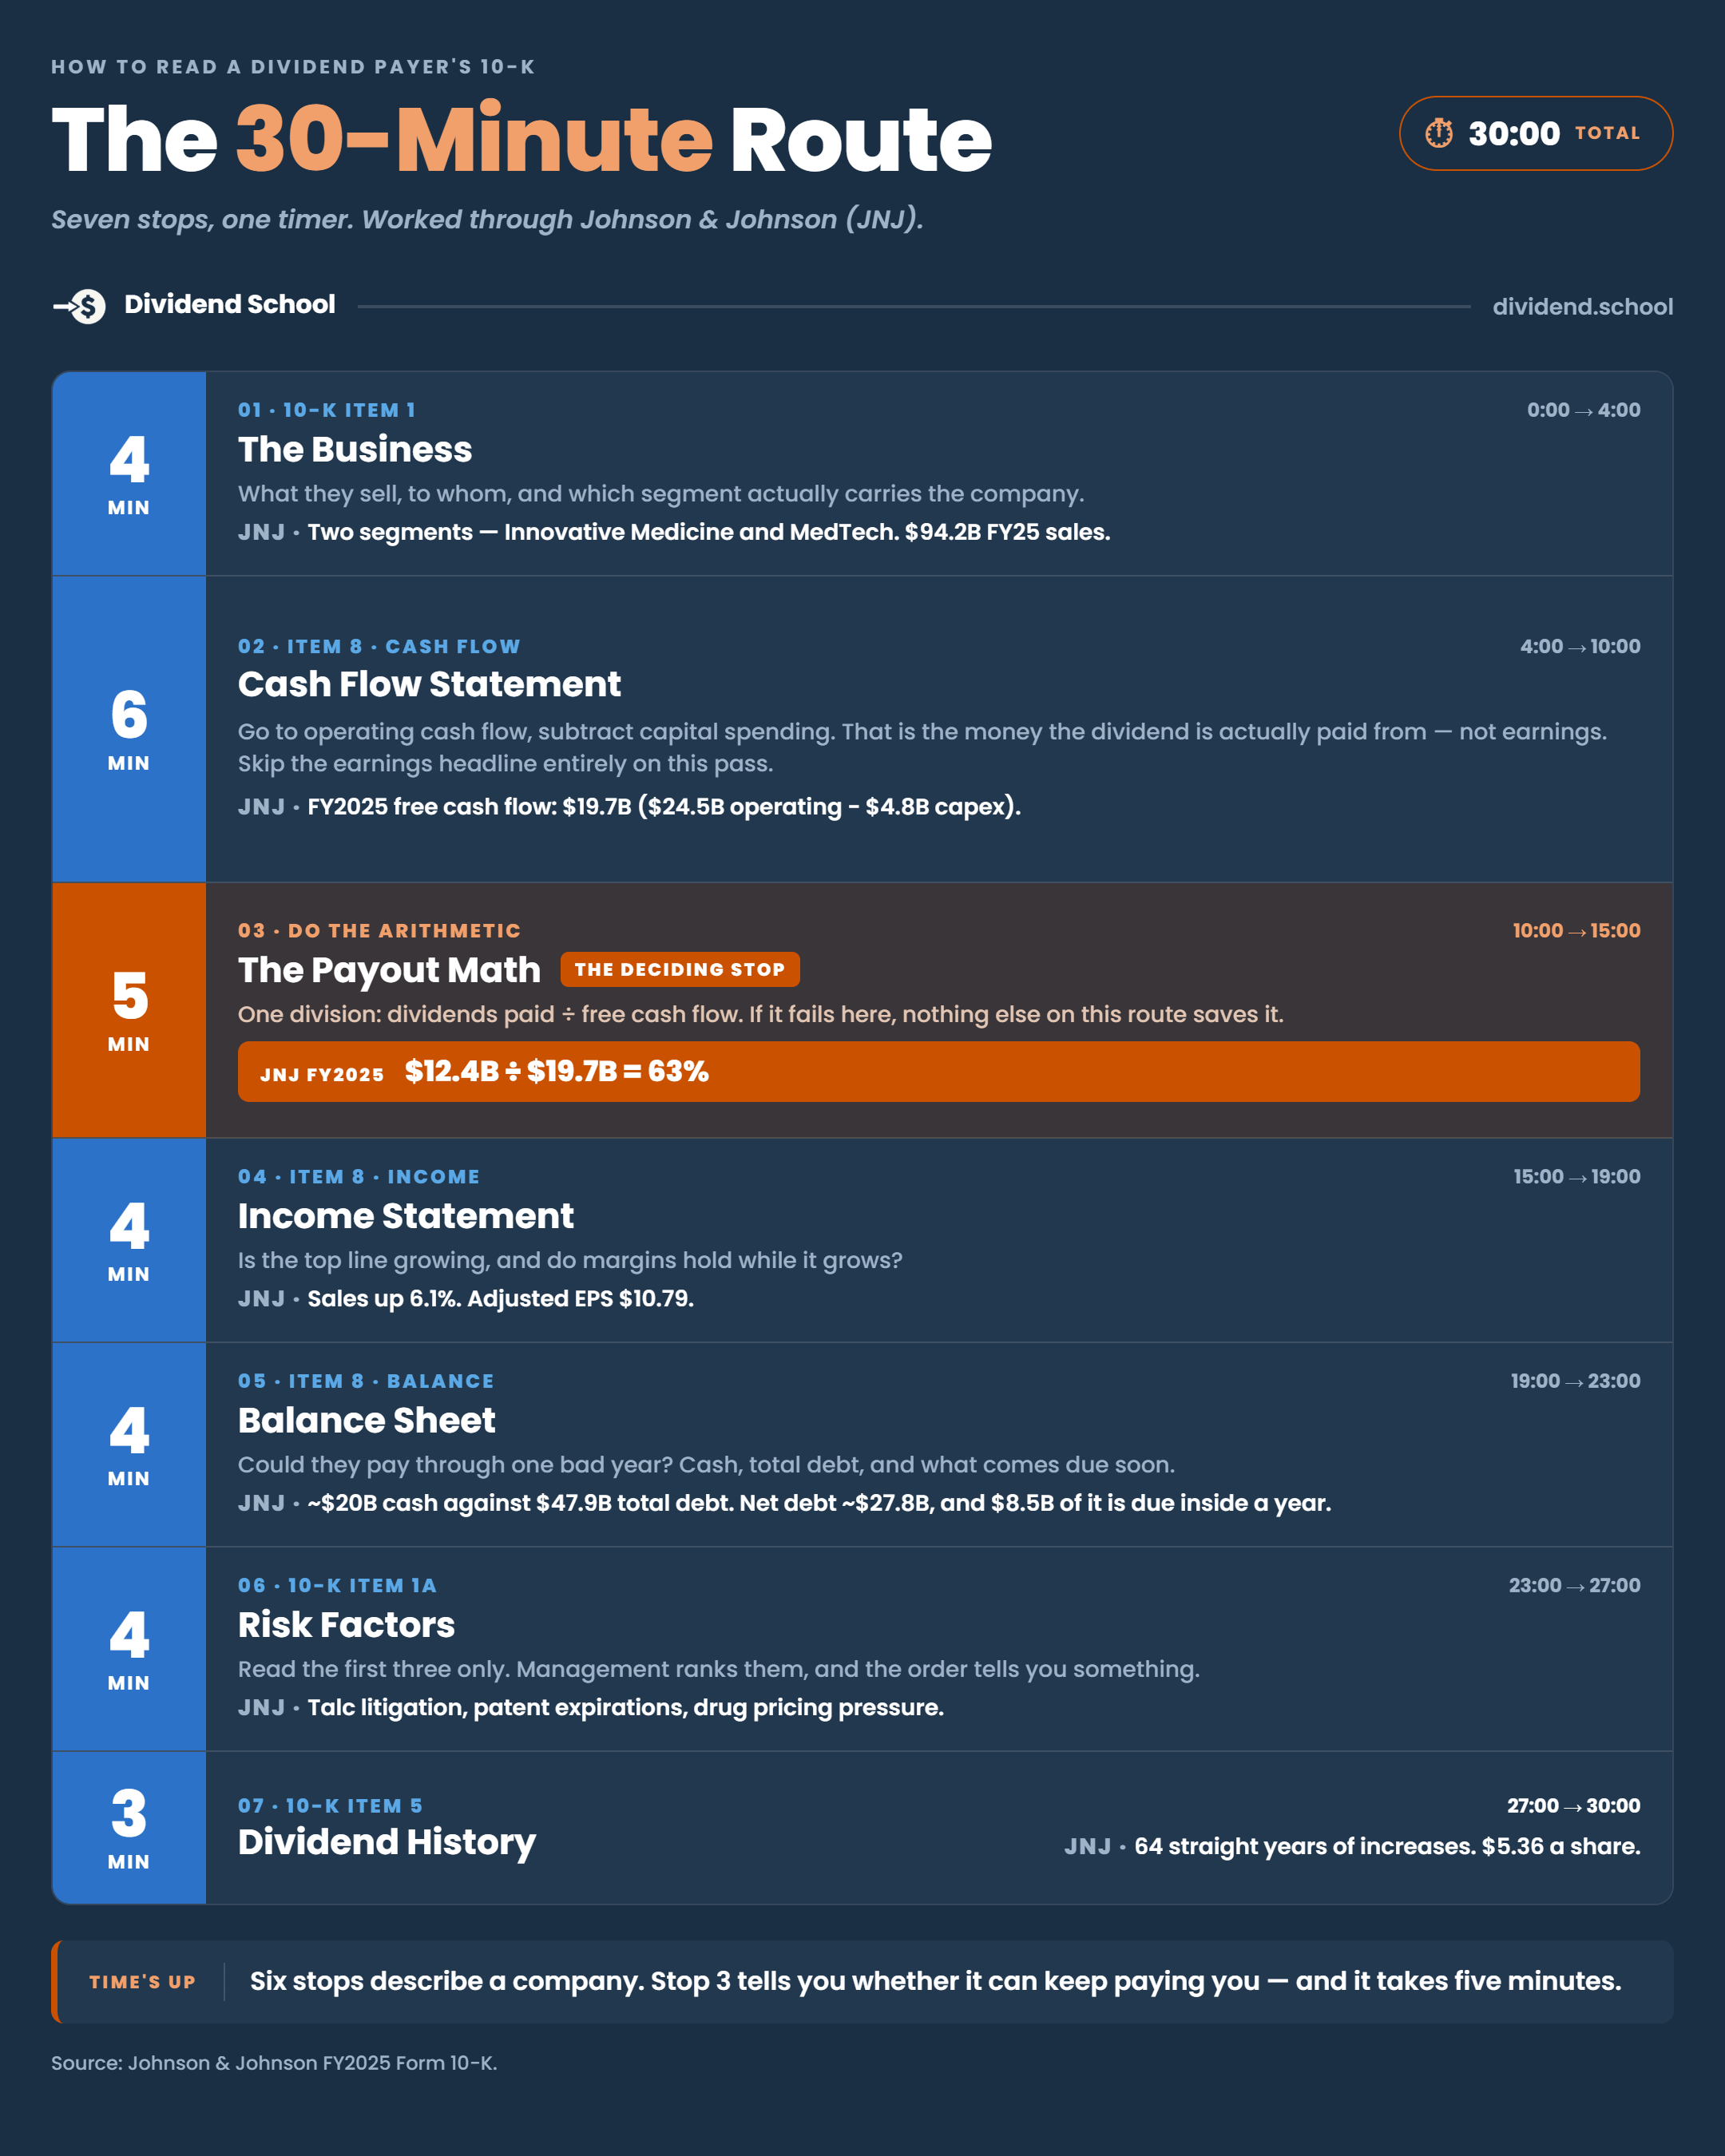
Minutes 0 to 3: what does this company sell? (Item 1)
The 10-K opens with Item 1, the business description. Our main goal here. Answering this question: how do they make money?
Read the first couple of pages until you can explain the business in two sentences. A good practice: if you can explain it to a five-year-old, you understand the business.
For J&J: the company sells prescription drugs such as Tremfya and Stelara through its Innovative Medicine segment and surgical devices, orthopedics, and vision products like Acuvue contacts through its MedTech segment.
This includes brands you grew up with (Band-Aid, Tylenol) which left in 2023 when J&J spun off Kenvue.
If you can’t explain the business in two sentences after three minutes, that tells you something too. A dividend backed by a business you don’t understand is a dividend you will struggle to evaluate.
A shortcut if you are having issues figuring out what the company does: run it through your favorite AI and ask it to explain to you like a five-year-old. I do this all the time. If after that, you still can’t, move on. It’s not worth trying to force it.
Warren Buffett called it his “too hard” pile. Let it build up; it’s a strength, not a weakness.
Minutes 3 to 10: go straight to the cash flow statement (Item 8)
Skip the CEO letter; if there is one, pass the properties section and the MD&A (Management Discussion and Analysis), for now.
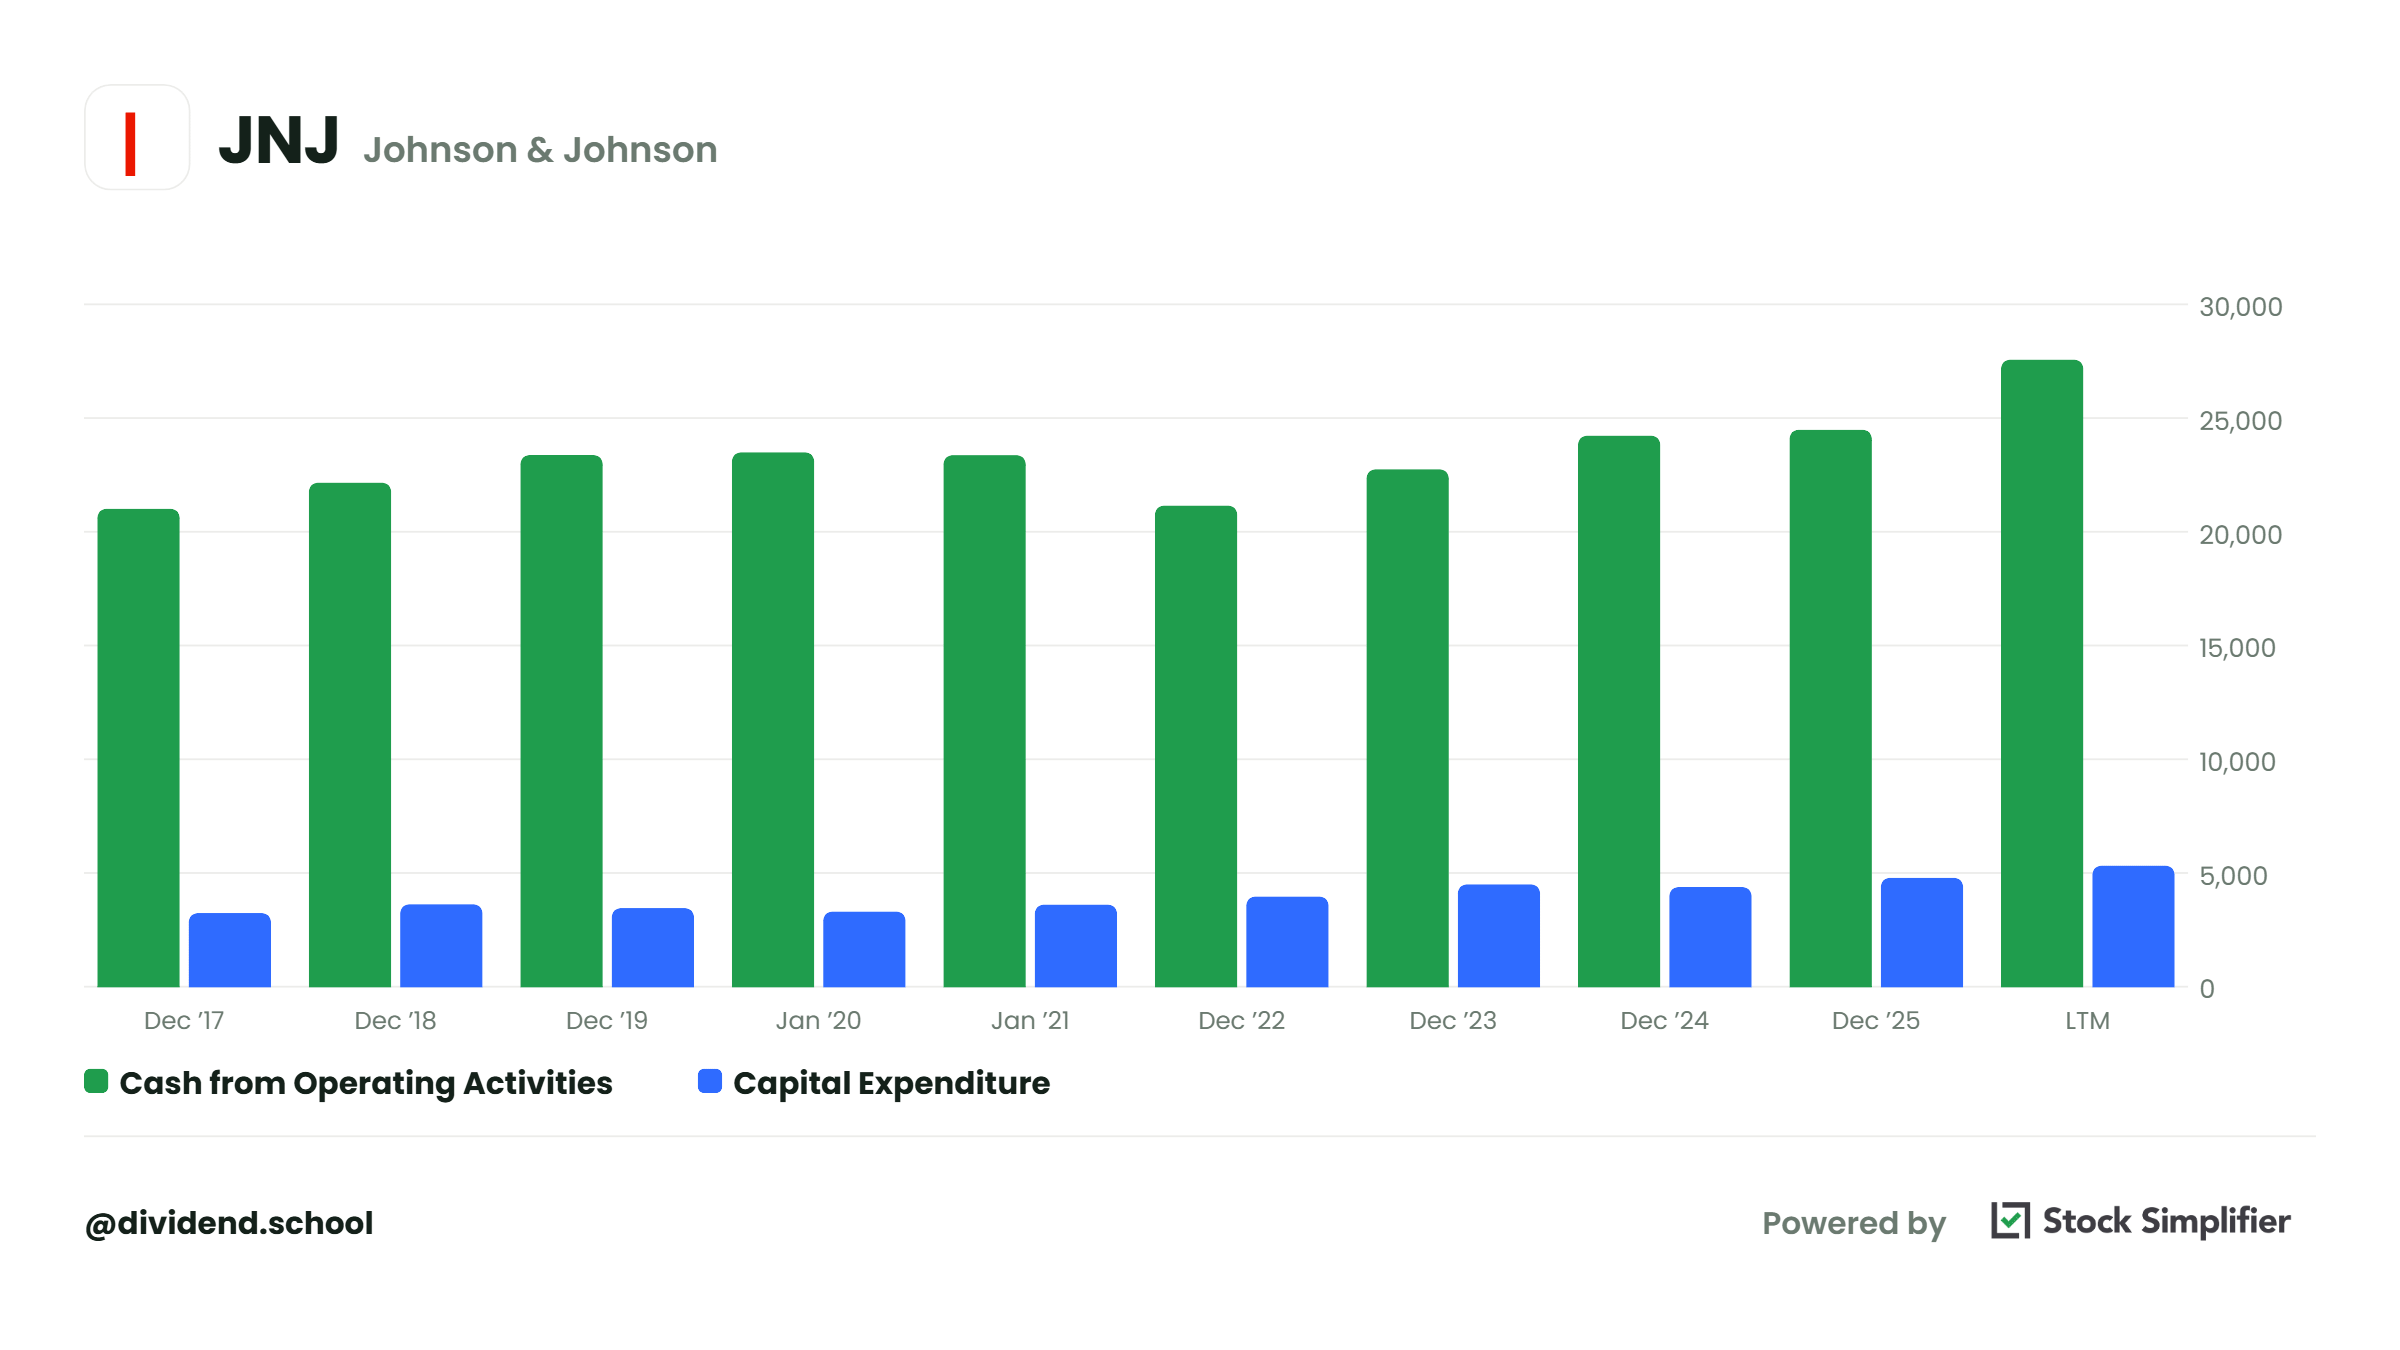
Scroll down to Item 8, the financial statements, and look for the consolidated statement of cash flows or the cash flow statement.
Bottom line, dividends get paid with cash, so this statement matters more than any other page in the 10-K.
Look for the line “cash flows from operations” (the total at the bottom of the operating section). You also might find it labeled operating cash flows, they don’t standardize the language, only the filing.
Next, find capital expenditures or additions to property, plant, and equipment (PP&E) in the investing section.
Now, subtract the capital expenditures (the second item) from the cash flows from operations (first item).
This gives us free cash flow, the cash left over after running and maintaining the business. This is the most important number you will find and calculate. Without it, no company survives for long. It is the lifeblood and pays for all the running, growth, and dividends.
Here is the numbers from J&J’s 2025 10-K, consolidated statements of cash flows:
Cash flows from operations: $24.5 billion ($24,530 million)
Additions to property, plant and equipment: $4.8 billion ($4,832 million)
Free cash flow: $19.7 billion ($19,698 million)
That $19.7 billion is the cash the dividend gets paid from. Now let’s see how much of the total cash the dividend drains.
If you're the kind of investor who wants to check the math before you buy, Dividend School is for you. One concept every week, explained in plain English with numbers straight from sec.gov. Free, no spam, and you can unsubscribe anytime.
Minutes 10 to 15: locate the dividend and run the payout math
Let’s stay on the cash flow statement and drop down to the financing section. Every dollar Johnson and Johnson sends to shareholders is listed here. We will find dividends paid and share buybacks, the other capital return method.
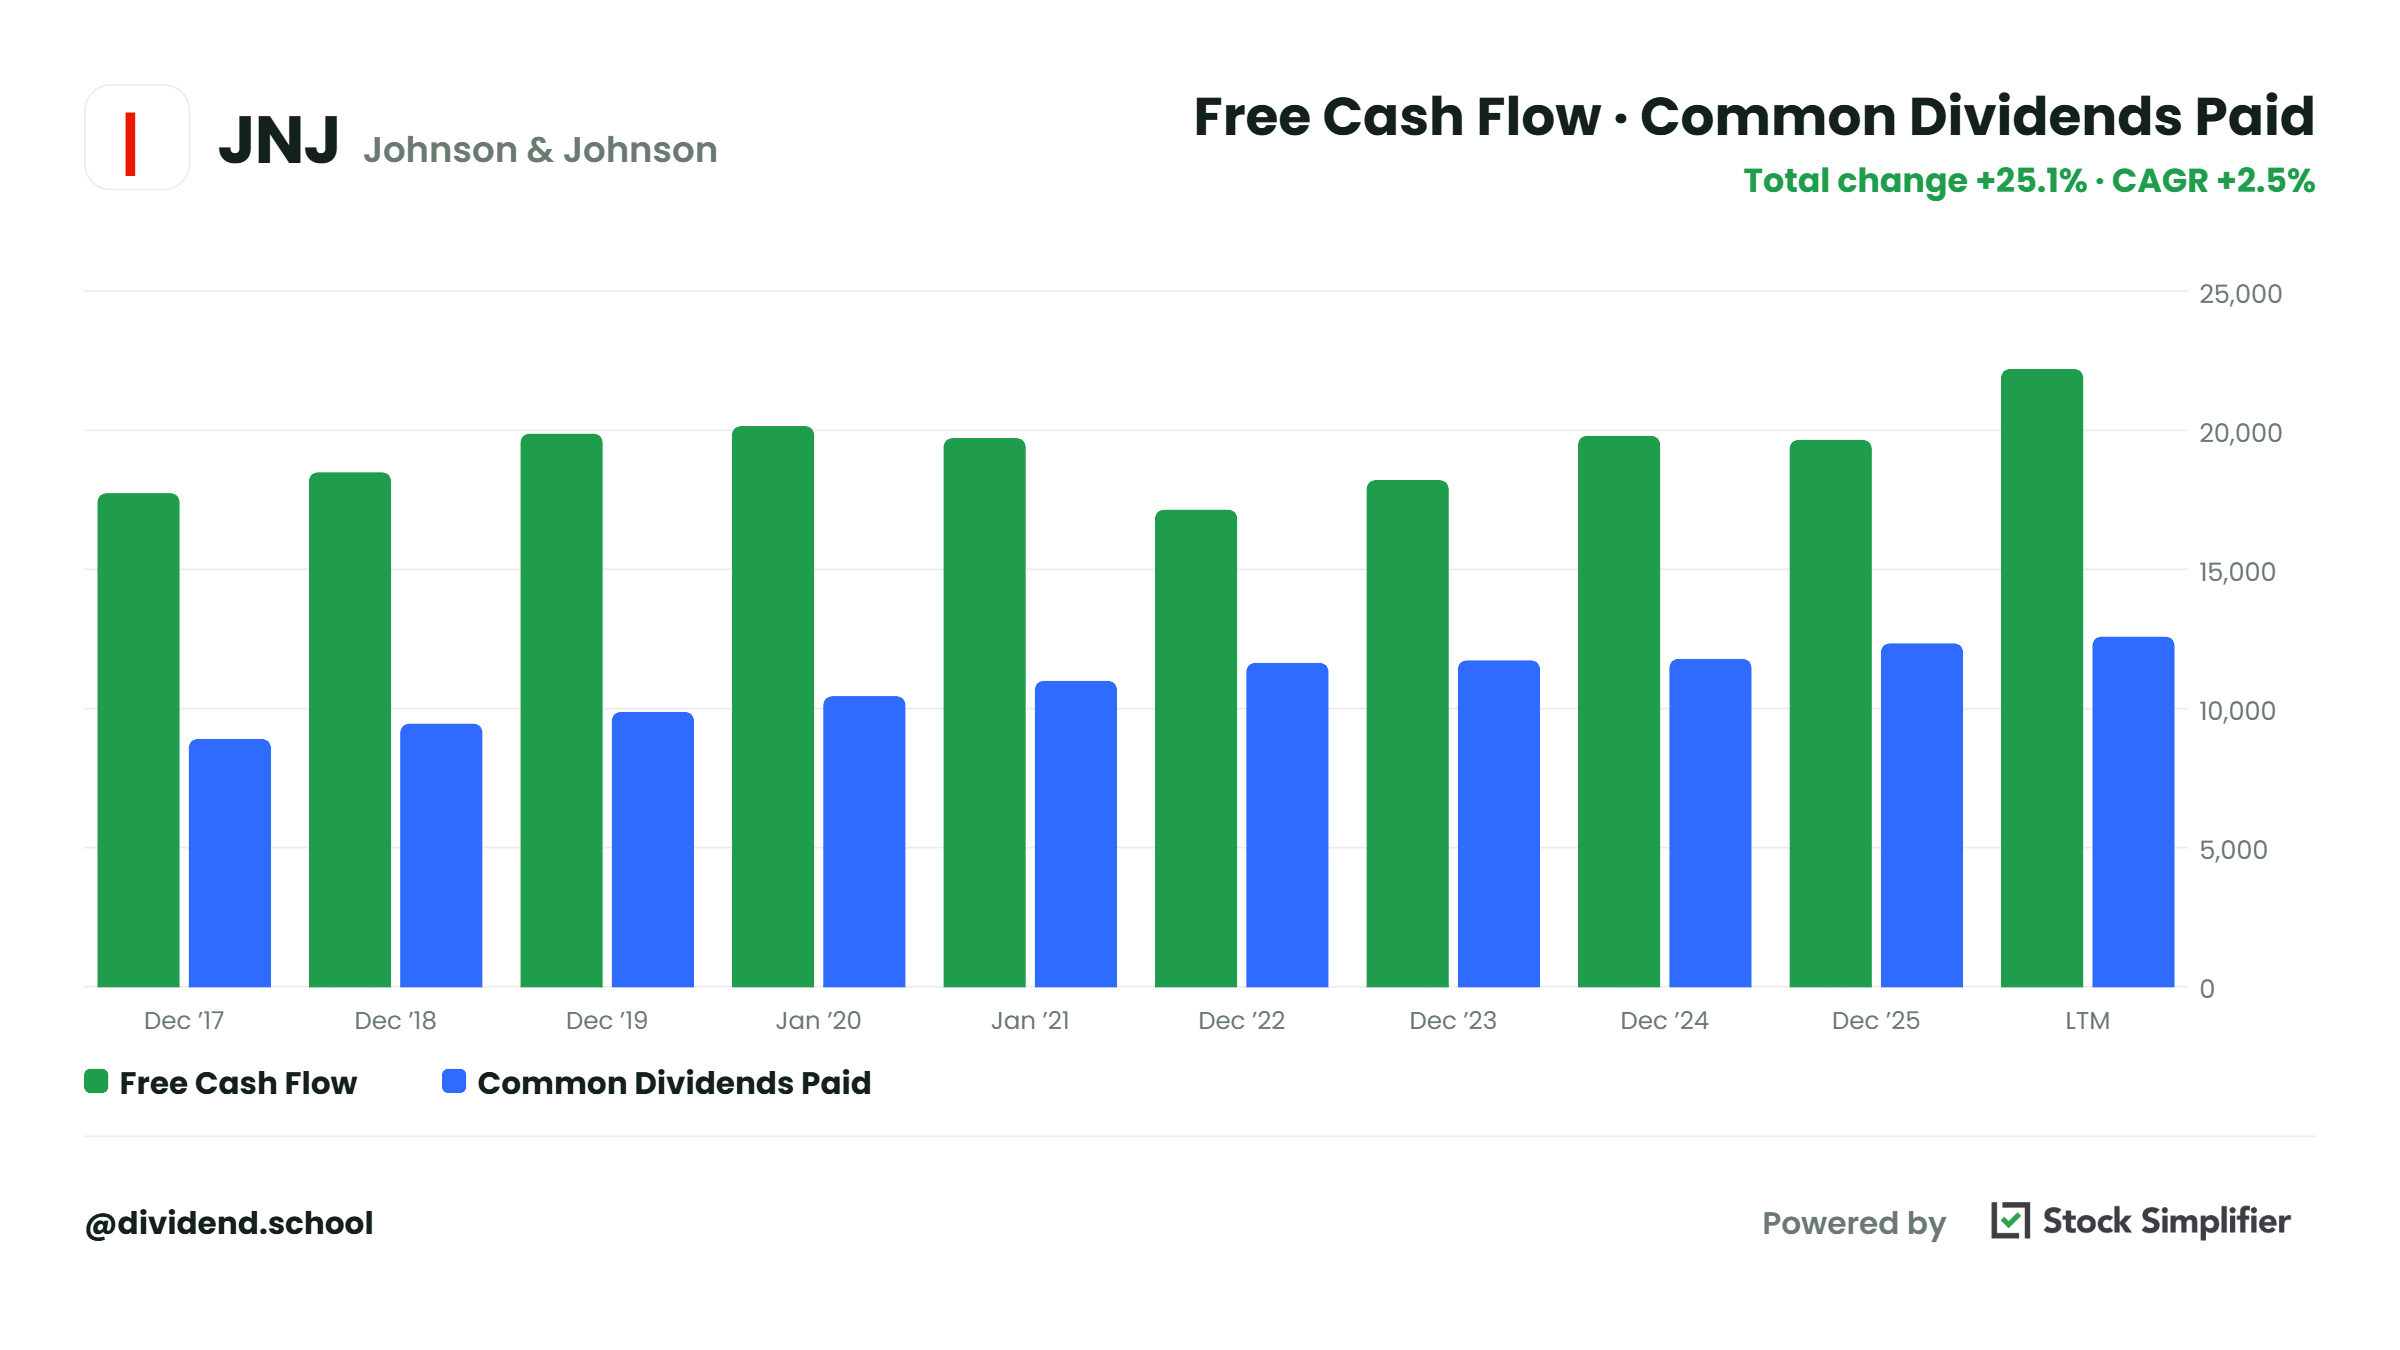
J&J’s line “dividends to shareholders” shows $12,381 million paid in fiscal 2025. To determine the free cash flow payout ratio (the best method of measuring the strength of the dividend payout).
To calculate the FCF Payout Ratio, we divide the dividend by free cash flow; here are the latest numbers:
Dividends paid: $12.4 billion
Free cash flow: $19.7 billion
Free cash flow payout ratio: 63%
Here’s how you can read the ratio. Below 60% is ideal, depending on the company, and gives the company room to raise the dividend even in a rough year. Between 60% and 80% deserves a closer look to determine how stable the cash flows are. Above 80%, we start to enter the caution zone, meaning the cushion starts to get thin. And anything above 100% is a big red flag and must be investigated. A percentage greater than 100% means the company is borrowing or selling assets to pay the dividend, which is not sustainable.
Always check these over a longer time frame, ideally five to ten years. Use your favorite financial website to help with this; mine is Stock Simplifier.
One caveat: all of these ranges are broad, and each company and business model has to be determined on its own standing. For example, a REIT must pay out 90% of its cash in dividends, and banks don’t generate “cash” in the same manner because of their structure.
This is why it helps to understand the business model.
Currently, J&J sits at 63% with cash flows that barely move in recessions. That reads as safe to me.
Minutes 15 to 19: the income statement, and why I trust it less
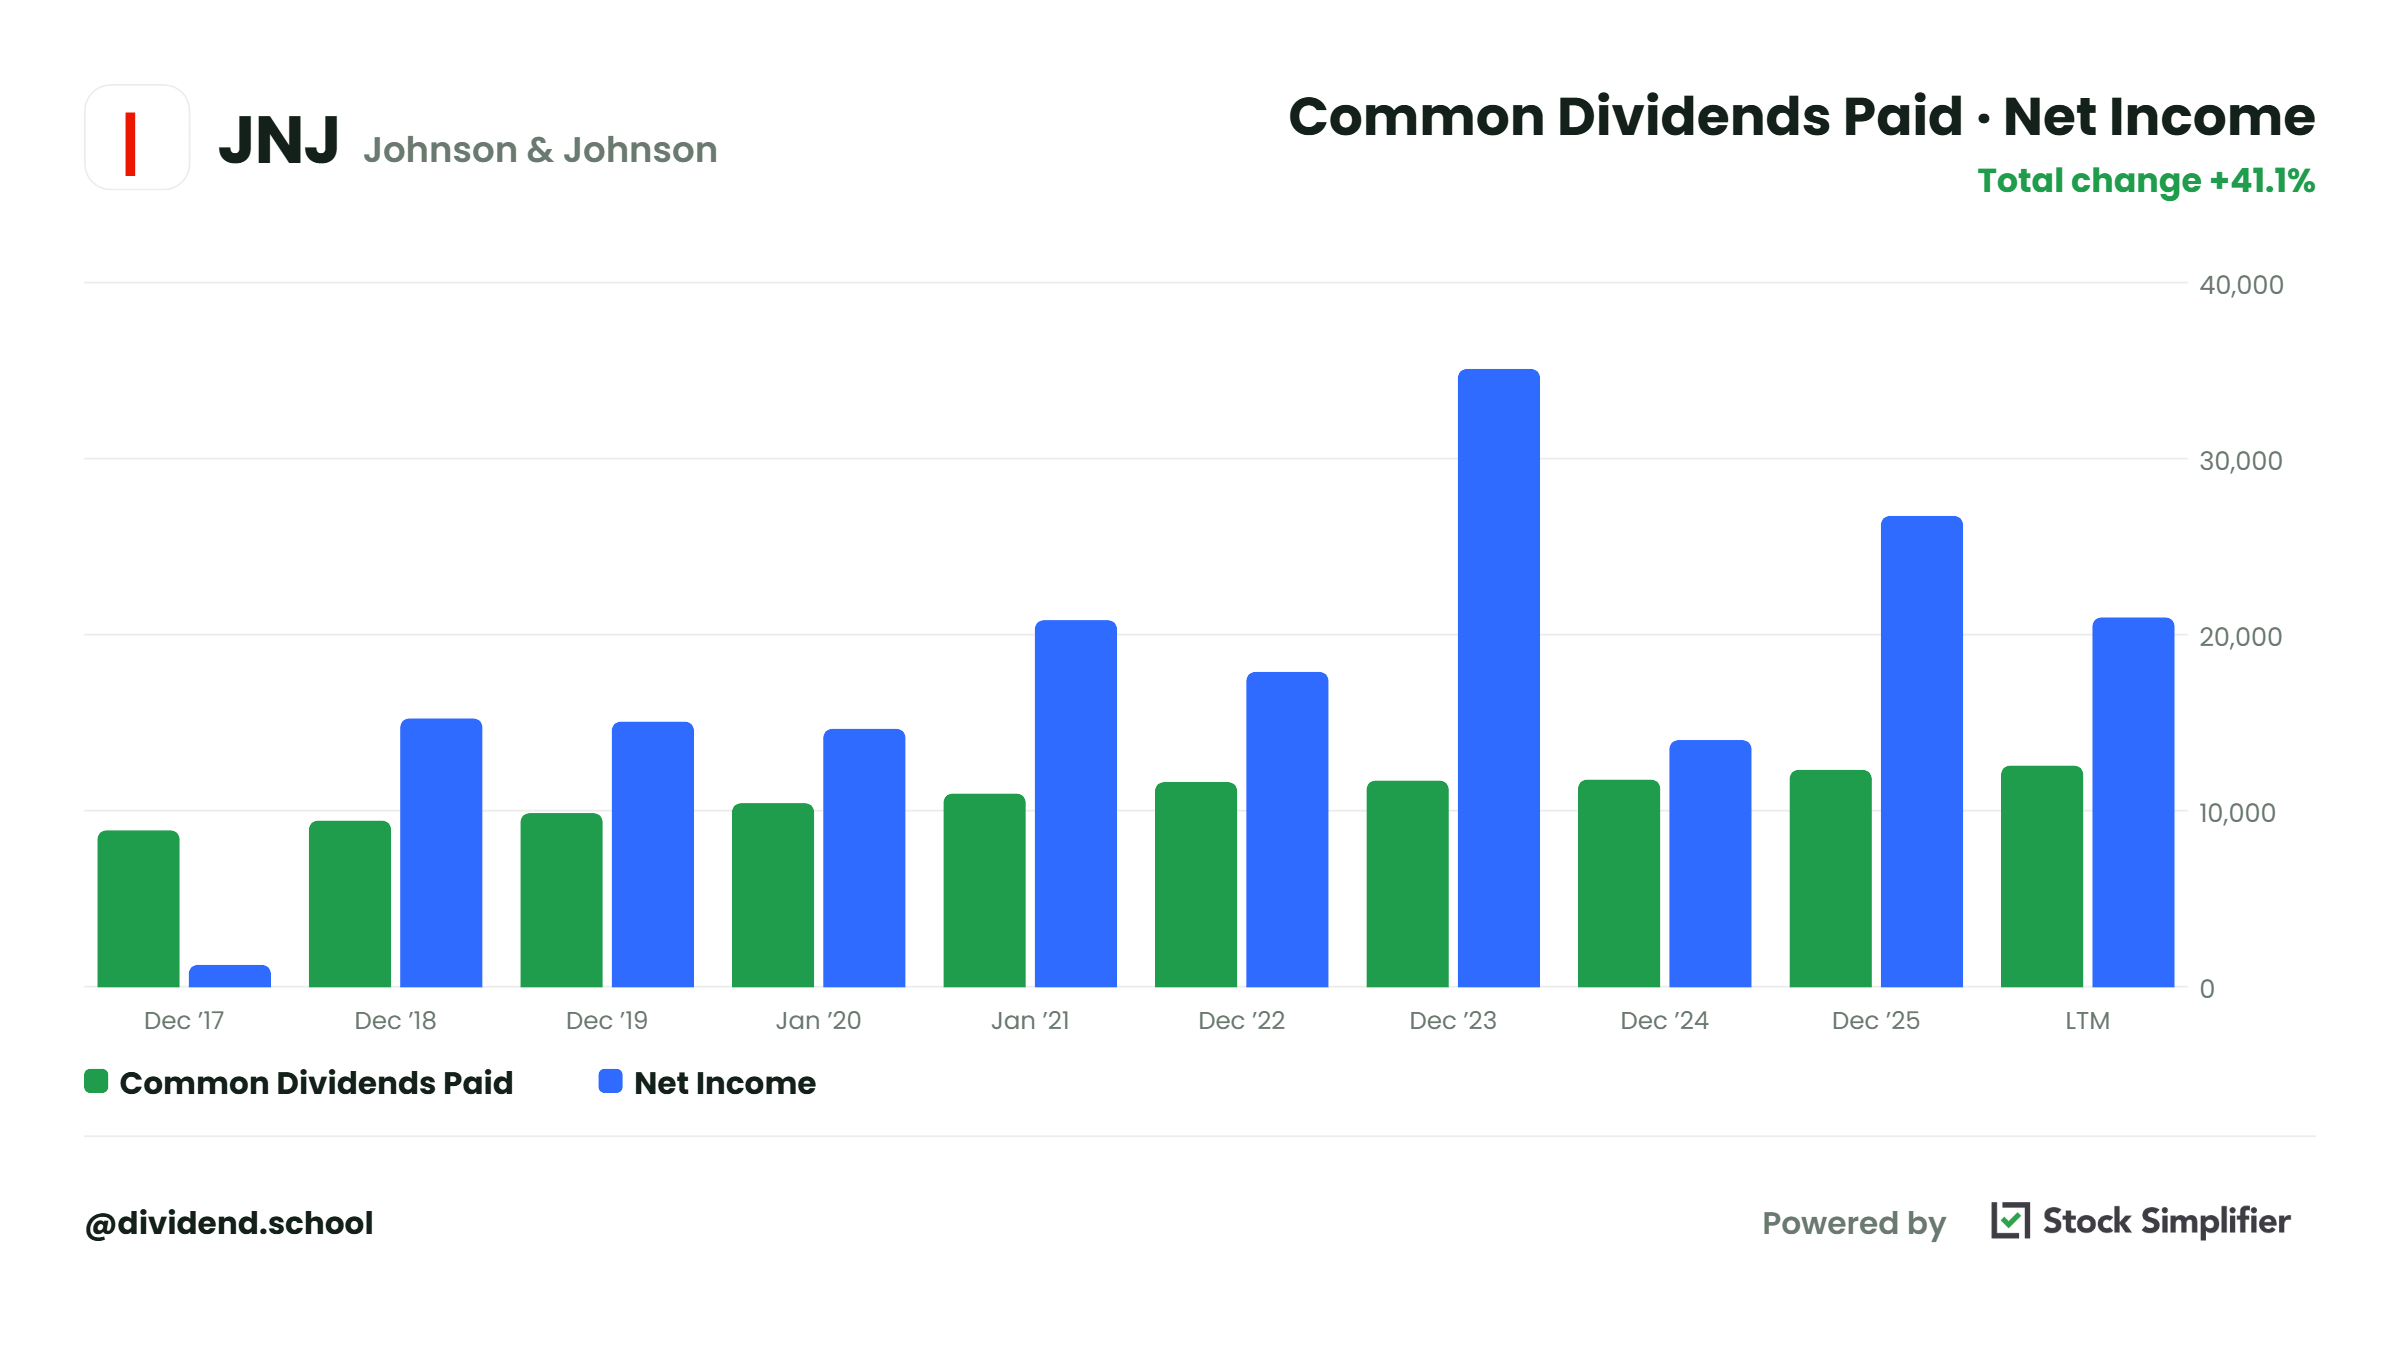
Now, let’s flip back to the income statement for a quick look. we want to see the three trends of both revenue and net income (earnings).
J&J’s revenue, from the 2025 10-K:
2023: $85.2 billion
2024: $88.8 billion
2025: $94.2 billion
Growing, steady as they go. Now look at net income over the same stretch:
2023: $35.2 billion
2024: $14.1 billion
2025: $26.8 billion
Revenue climbed steadily while net income bounced around. Digging deeper into net income, we see that the 2023 figure was inflated by a one-time gain from the Kenvue separation, while 2024’s figure declined due to special charges, including litigation costs (talc litigation). Free cash flow barely moved through all of it.
This is why I focus on the free cash flow payout ratios and treat earnings payout ratios as a second opinion. Remember, earnings are an opinion; cash is a fact.
A screener using earnings would have shown J&J paying out 85% of its profits in 2024 ($4.91 in dividends against $5.79 in diluted EPS). The free cash flow payout that same year was 60%. Two numbers, different stories. One says things are tight (earnings), and the other says the weather is fine (free cash flow).
Minutes 19 to 24: the balance sheet
Moving to the balance sheet next.
We have two questions to answer here. How much cash and how much debt?
From J&J’s 2025 10-K balance sheet:
Cash and cash equivalents: $19.7 billion (top of the statement)
Long-term debt: $39.4 billion, up from $30.7 billion a year earlier (towards the bottom)
As we can see, an $8.8 billion jump in long-term debt is exactly the kind of thing this 30-minute run-through is designed to catch. When we discover a jump like this, go to the long-term debt footnote (search using CTRL-F). Here you will find a list of every new borrowing, the interest rates, and when each note comes due.
What we want to know is whether the new debt funded something productive, such as an acquisition or a new asset (capacity). Or whether it plugged a hole in a leaky business.
For a company like J&J, generating $19.7B in annual free cash flow, $39.4B in long-term debt remains manageable.
For a company generating $19.7 billion in annual free cash flow, $39.4 billion of long-term debt is a manageable load. For a company generating $2 billion, it would be a five-alarm fire.
The reason this matters, debt competes with your dividend for the same cash. Interest payments come first, always.
Minutes 24 to 28: risk factors and legal proceedings (Items 1A and 3)
The risks section is important, but remember you will not read all of Item 1A, nobody does. It’s written by lawyers to cover the company’s butt.
Better, skim the bolded headings and slow down only for risks specific to this company, skipping the boilerplate about pandemics and cyberattacks that appears in every filing.
Next, check Item 3, legal proceedings, which points you to the litigation note.
For J&J, that is where we will find talc litigation, and it is the single most important non-financial item in the filing. As a dividend investor, we don’t need to predict the outcome. We need to know that the exposure exists, roughly how large the reserves are, and whether it has grown since last year.
Four minutes here is enough to learn whether the company’s biggest legal exposure grew since last year, and that is all this pass needs.
Minutes 28 to 30: the dividend record (Item 5)
Let’s wrap up our tour with Item 5. Here the company discusses its stock and dividends. We can confirm the streak with the per-share history.
Here are J&J’s dividends paid per share, from the 2025 10-K:
2023: $4.70
2024: $4.91
2025: $5.14
This translates to approximately 4.5% to 4.7% dividend growth each year, and the April raise marked the company’s 63rd consecutive year of dividend increases. A streak like that survives only when the payout math we ran in minute 12 keeps working, which is why you check the math first and admire the streak second.
Okay, timer off, we did it in 30 minutes, one 10-K, and now you know more about J&J’s dividend than most investors who own the stock.
How to use this in your investing process
Simple, run this process before you buy any dividend stock, and once a year after the new 10-K drops. This will happen, depending on the company, in February to March for any company with December as their year-end.
Our 30-minute read works primarily as a filter. It helps answer one question: does this dividend deserve any more of my time? If the free cash flow payout ratio passes my filter, the debt is manageable, and nothing in the legal note makes you pause, the company earns a deeper look at valuation and competitive position.
If you find a 95% payout ratio and ballooning debt, you saved yourself a yield trap and a lot of heartache in half an hour.
A simple habit: keep your numbers in a simple spreadsheet, one row per year. By year three you have a trend, and trends are where the real signal lives. It can live in Excel or Google Sheets, whichever works best for you. Keep it someplace you will remember.
Lastly, if you have time, read section 7, the MD&A; this is management’s section to explain everything going on with the business. They will explain the company’s operations and why they are doing well or not; they will also lay out their future plans and how they plan to execute them. And finally, any capital allocation decisions. It is a treasure trove of information, but it does take some time to read through it.
What this pass can’t tell you
A few honest limitations.
The 30-minute read says nothing about valuation. J&J can have a safe dividend and still be a bad investment at the wrong price.
One year of free cash flow is a snapshot. A single strong year can mask a decaying business, which is why the spreadsheet habit matters.
And the 10-K won’t tell you about management skill or whether the moat is holding. Those take longer than 30 minutes, and they always will.
A good practice after your 30-minute pass is to look at longer time horizons; five to ten years is best. Then run valuation, and spend some time thinking about its competitive position.
The 30-minute 10-K checklist (save this)
Item 1: Can I explain the business in two sentences? (3 min)
Cash flow statement: Operating cash flow minus capex = free cash flow (7 min)
Financing section: Dividends paid ÷ free cash flow = free cash flow payout ratio. Under 60% ideal, over 80% caution (5 min)
Income statement: Is revenue growing? Is net income lumpy from one-time items? (4 min)
Balance sheet: Cash vs long-term debt, and did debt grow year over year? (5 min)
Items 1A and 3: Skim company-specific risks, read the litigation note (4 min)
Item 5: Dividend per share history and the growth streak (2 min)
The big takeaway: a dividend is only as safe as the free cash flow behind it, and after spending 30 minutes with the 10-K, we can see that cash flow for ourselves.
Until next time, take care and be safe out there,
Dave