
Price to Sales Ratio: A Simple Valuation Metric for Investors

Finding the right valuation metric can feel overwhelming for new investors. With so many ratios and formulas floating around, where do you even start? The Price-to-Sales (P/S) ratio is one of the most straightforward ways to evaluate whether a stock is over- or undervalued.
The beauty of the P/S ratio remains its simplicity. Unlike earnings-based metrics, sales figures are harder to manipulate and provide a cleaner picture of a company’s business fundamentals. For investors seeking to understand valuation without getting lost in accounting adjustments, the P/S ratio serves as an excellent starting point.
In today’s post, we will learn:
What is the Price to Sales Ratio?
Why the P/S Ratio Matters to Investors
How to Calculate the Price to Sales Ratio
Worked Examples: Amazon, Walmart, and Nike
Comparing P/S Ratios Across Different Sectors
Limitations of the P/S Ratio
Investor Takeaway
Okay, let’s dive in and learn more about the Price to Sales ratio.
What is the Price to Sales Ratio?
According to Investopedia, the Price to Sales ratio “is a valuation ratio that compares a company’s stock price to its revenues. It is an indicator of the value that financial markets have placed on each dollar of a company’s sales or revenues.”
In other words, the P/S ratio tells us how much investors are willing to pay for each dollar of sales a company generates. Think of it this way: if a company has a P/S ratio of 3, investors are paying $3 for every $1 of sales the company brings in.
The P/S ratio remains particularly useful when comparing companies within the same sector or evaluating companies that may not yet be profitable. Remember, a company can have negative earnings but still generate substantial sales revenue.
Why the P/S Ratio Matters to Investors
The P/S ratio offers several advantages that make it valuable for investors, particularly those just starting their investing journey.
First, sales are harder to manipulate than earnings. While companies can use various accounting methods to adjust earnings, sales figures remain more straightforward and transparent. This makes the P/S ratio a more reliable metric in some situations.
Second, it works for unprofitable companies. Many growth companies invest heavily in expansion and may not show profits for years. Traditional metrics like the P/E ratio don’t work for these companies, but the P/S ratio does. We can still evaluate whether their valuation remains reasonable relative to their revenue generation.
Third, it provides a quick screening tool. When comparing companies in the same industry, the P/S ratio helps us quickly identify which are over- or undervalued relative to their peers.
That said, the P/S ratio isn’t perfect, and we’ll discuss its limitations later. But it remains a valuable tool in our investing toolkit, especially when used alongside other metrics.
How to Calculate the Price to Sales Ratio
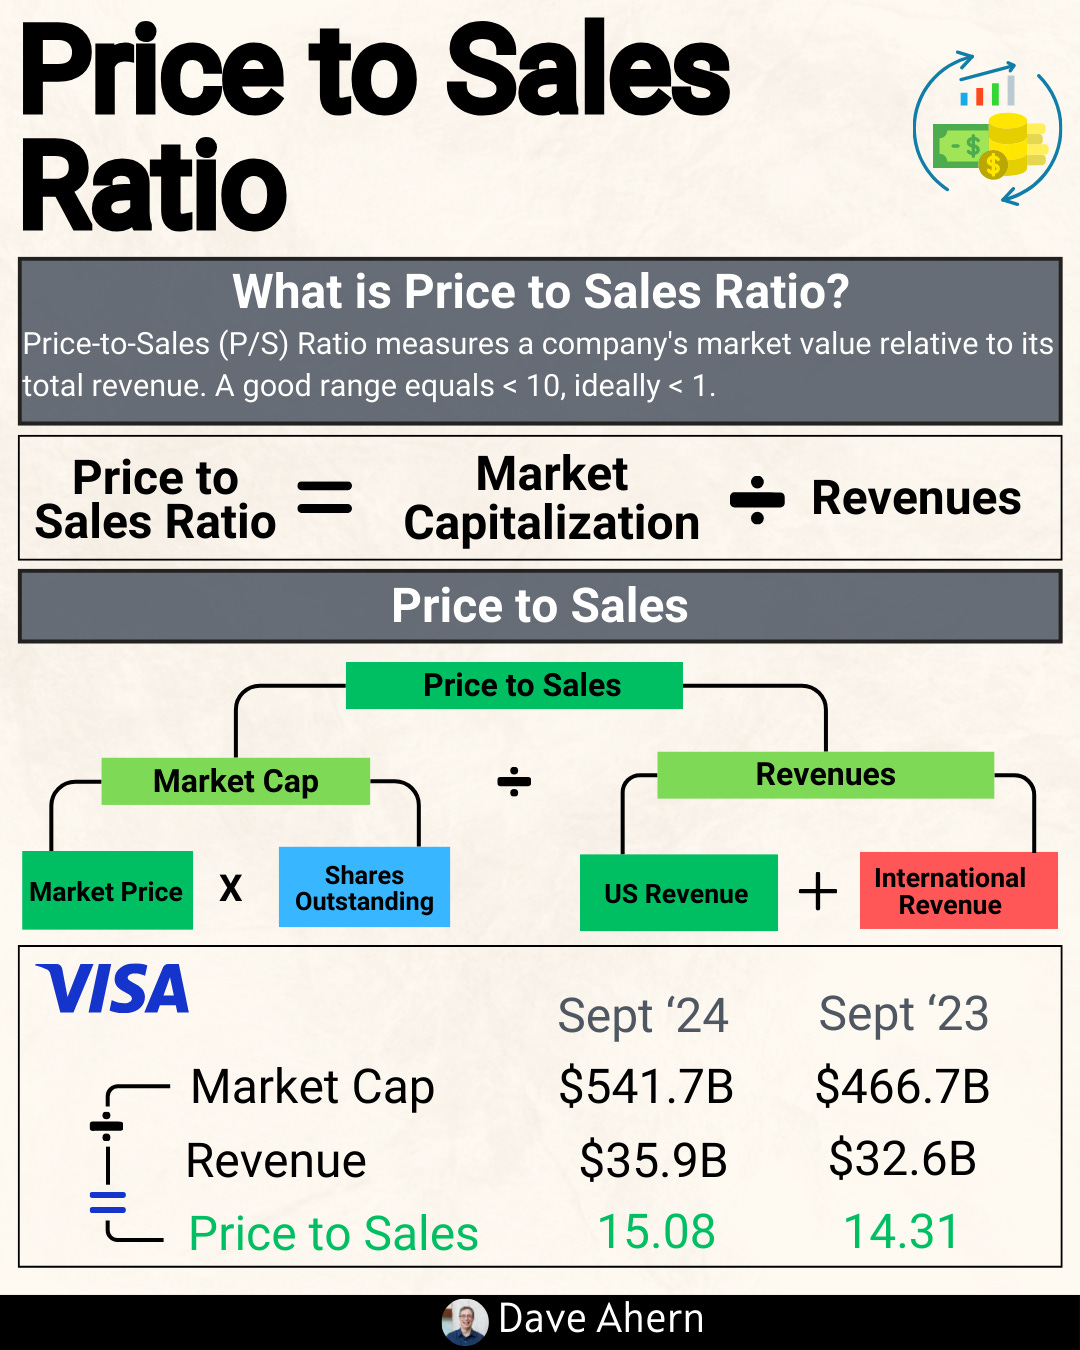
I know formulas can look intimidating, but this one is pretty straightforward. The formula for the Price to Sales ratio is as follows:
P/S Ratio = Market Capitalization ÷ Total Revenue
Or alternatively:
P/S Ratio = Stock Price ÷ Revenue Per Share
Where:
Market Capitalization = Current stock price × total shares outstanding
Total Revenue = The company’s total sales (found on the income statement)
Revenue Per Share = Total Revenue ÷ Shares Outstanding
Both formulas give the same result, so you can use whichever is more convenient given the data you have available.
Not too hard, was it? Now let’s walk through some real examples to see how this works in practice.
Worked Example #1: Amazon
Let’s use Amazon as our first guinea pig. Amazon remains one of the world’s largest e-commerce and cloud computing companies, making it an interesting case study for the P/S ratio.
As of November 2025, let’s imagine Amazon is trading at approximately $247 per share with about 10.7 billion shares outstanding. This gives us a market capitalization of roughly $2.66 trillion.
Now, we need to find Amazon’s total revenue. We can find this on Amazon’s income statement from their most recent 10-K filing. For this example, let’s say Amazon generated $691.3 billion in revenue over the trailing twelve months.
Let’s plug these numbers into our formula:
P/S Ratio = $2660 billion ÷ $691.3 billion = 3.84
What does this tell us? Investors are paying $3.84 for every dollar of sales Amazon generates. Now, before we determine if that’s good or bad, we need context. Let’s look at another company for comparison.
Worked Example #2: Walmart
For our second example, let’s look at Walmart, a traditional brick-and-mortar retailer with a massive physical presence.
Walmart’s stock trades at around $103 per share with approximately 8 million shares outstanding, giving us a market cap of roughly $816 billion.
Looking at Walmart’s income statement from its latest 10-K, we can see that it generated approximately $693.2 billion in revenue over the past 12 months.
Let’s calculate Walmart’s P/S ratio:
P/S Ratio = $816 billion ÷ $693.2 billion = 1.18
Interesting! Walmart’s P/S ratio of 1.18 remains significantly lower than Amazon’s 3.84. Investors are only paying $1.18 for every dollar of Walmart’s sales, compared to $3.84 for Amazon’s sales.
Does this mean Walmart is a better buy? Not necessarily. Let’s discuss why in a moment, but first, let’s look at one more example.
Worked Example #3: Nike
For our final example, let’s examine Nike, a leading athletic apparel and footwear company. Nike offers us a look at a branded consumer goods company with strong margins.
Nike trades at approximately $63 per share with about 1.5 billion shares outstanding, giving us a market cap of roughly $89 billion.
From Nike’s most recent 10-K, we can see they generated approximately $46 billion in revenue.
Let’s calculate:
P/S Ratio = $89 billion ÷ $46 billion = 1.93
Nike’s P/S ratio of 1.93 sits between Amazon’s ratio and Walmart’s, despite being in a completely different industry. Wasn’t that pretty simple?
Now that we have calculated the P/S ratio for three different companies, let’s discuss what these numbers actually mean and how to interpret them.
Comparing P/S Ratios Across Different Sectors
Here’s where things get interesting. Notice how Amazon has the highest ratio P/S with 3.84, and Nike’s is at 1.93, while Walmart’s ratio remains much lower at 1.18. This difference tells us something important about how markets value different types of businesses.
Walmart’s lower P/S ratio reflects several realities:
Traditional retail operates on thin profit margins (typically 2-3%)
Heavy competition keeps prices low
Slower growth compared to tech companies
The business model remains capital-intensive with physical stores
Amazon’s higher P/S ratio reflects different characteristics:
Amazon Web Services (AWS) operates at much higher margins than retail
Strong growth trajectory in cloud computing
Network effects and competitive advantages
Multiple revenue streams with different margin profiles
Nike’s P/S ratio reflects its position as a premium brand:
Strong brand value allows for higher margins (around 12-13%)
Pricing power in the athletic apparel market
Direct-to-consumer initiatives improving profitability
Global growth opportunities
The key insight remains this: we can’t simply compare P/S ratios across different sectors and declare winners and losers. A P/S ratio of 1.19 might be perfectly reasonable for a low-margin retailer like Walmart, while the same ratio might indicate significant undervaluation for a high-margin software company.
Remember, as Warren Buffett famously said, “It’s far better to buy a wonderful company at a fair price than a fair company at a wonderful price.” The P/S ratio helps us understand the price component, but we still need to evaluate the business's quality.
Limitations of the P/S Ratio
I know we’ve been building up the P/S ratio as a useful tool, and it is! But it’s important to understand its limitations. No single metric tells the complete story, and the P/S ratio has some significant weaknesses we need to acknowledge.
First, the P/S ratio tells us nothing about profitability. A company might generate billions in sales but lose money on every transaction. We’ve seen this with many high-growth tech companies that prioritize market share over profits. Sales without profits remain unsustainable in the long run.
Second, the P/S ratio doesn’t account for debt. Two companies might have identical P/S ratios, but one could be drowning in debt while the other operates debt-free. The P/S ratio won’t reveal this critical difference.
Third, profit margins vary dramatically across industries. As we saw in our examples, comparing Walmart’s P/S ratio to Amazon’s P/S ratio without considering their different business models and margin structures can lead to misleading conclusions. A software company with 80% gross margins should command a higher P/S ratio than a grocery store with 2% net margins.
Fourth, the P/S ratio can’t distinguish between high-quality and low-quality revenue. Recurring subscription revenue from loyal customers remains far more valuable than one-time sales or revenue from unprofitable customer acquisition tactics. The P/S ratio treats all sales equally.
Finally, sales can be manipulated too, just less easily than earnings. Companies can boost short-term sales through aggressive discounting, channel stuffing, or other unsustainable practices. While harder to manipulate than earnings, sales figures still require scrutiny.
The bottom line remains that the P/S ratio works best as a screening tool and comparison metric within the same industry, not as a standalone valuation method.
Investor Takeaway
The Price-to-Sales ratio offers investors a straightforward way to evaluate whether a company’s valuation remains reasonable relative to its revenue. By calculating the P/S ratio, we can quickly screen for opportunities that are potentially over- or undervalued within a specific sector.
Remember these key points as you use the P/S ratio in your investing journey:
Use it for comparison within industries, not across them. Comparing Walmart’s P/S ratio to Nike’s tells us very little because their business models and margin structures differ dramatically. Instead, compare Walmart to Target, or Nike to Adidas, or Amazon to other cloud computing companies.
Consider profit margins alongside the P/S ratio. A high P/S ratio might be justified if the company operates at high margins and generates strong cash flow. Conversely, a low P/S ratio might not be a bargain if the company barely breaks even on its sales.
Look at trends over time. A rising P/S ratio might indicate growing investor enthusiasm or increasing overvaluation. A falling P/S ratio could signal a buying opportunity or deteriorating business fundamentals. Context matters.
Combine the P/S ratio with other metrics. The P/S ratio works best when used alongside metrics like the PE ratio, price-to-book ratio, return on invested capital, and free cash flow analysis. Think of it as one tool in your investing toolkit, not the only tool.
Stay consistent with your methodology. Whether you use trailing twelve-month revenue or forward revenue estimates, stay consistent across all companies you compare. Mixing methodologies leads to apples-to-oranges comparisons.
As Warren Buffett reminds us, “It’s better to be approximately correct than precisely wrong.” The P/S ratio won’t give you a precise valuation, but it provides a reasonable approximation to guide your decision-making. Don’t get bogged down in the minutiae – focus on whether your assumptions remain logical and whether the overall picture makes sense.
With that, we will wrap up our discussion of the Price-to-Sales ratio today. As always, thank you for taking the time to read today’s post, and I hope you find something of value in your investing journey. If I can further assist, please don’t hesitate to reach out.
Until next time, take care and be safe out there,
Dave