
Novo Nordisk: A Case Study in Gross Margins, Moats, and Manufacturing Muscle

Novo Nordisk has become a household name, but behind the headlines about Ozempic and Wegovy lies a powerful financial engine. Today’s post delves into the accounting reality of a company firing on all cylinders, illustrating how its exceptional gross margins and reinvestment in manufacturing capacity create a durable competitive advantage that investors can track through the financial statements.
TL;DR
Exceptional Profitability: Novo Nordisk’s gross margins consistently exceed 80%, a clear sign of immense pricing power and a strong competitive moat rooted in its patented GLP-1 therapies.
Reinvestment at Scale: The company is investing tens of billions of dollars into new manufacturing capacity, a necessary step to meet the staggering demand. This massive capital expenditure temporarily lowers free cash flow conversion but signals a long reinvestment runway.
The Moat is Real: The durability of Novo's therapeutic franchise is not just a story; it's evident in its high Return on Invested Capital (ROIC), which significantly exceeds its weighted average cost of capital (WACC).
From Income to Owner Earnings: Reconciling GAAP Net Income to Free Cash Flow reveals the true cash-generating power, adjusted for heavy investments in future growth.
Per-Share Focus: Despite massive investments, Novo has consistently reduced its share count over the last decade, ensuring that long-term owners see their stake in the growing enterprise increase.
Why It Matters: Beyond the Narrative
It's easy to be captivated by the story of a company changing the world with blockbuster drugs. But great narratives don't always translate into great investments. For investors, the real story is told in the financial statements. Understanding the interplay between pricing power (gross margins), reinvestment needs (capital intensity), and competitive durability (the moat) is what separates speculation from analysis.
Investors often go wrong by focusing solely on revenue growth while ignoring the underlying unit economics and capital required to achieve that growth. A company that grows revenues by 50% but sees its Return on Invested Capital (ROIC) fall below its cost of capital is destroying value, not creating it. Novo Nordisk presents a fascinating case where explosive growth is matched by world-class profitability and a deliberate, massive reinvestment cycle. This is where we can see quality investing principles in action.
Core Concepts: The Quality Investor's Toolkit
To dissect a company like Novo Nordisk, we need the right tools. This isn't about complex models; it's about understanding the fundamental drivers of value creation.
ROIC vs. WACC and Value Creation
The single most important measure of a business's quality is its Return on Invested Capital (ROIC). It tells you how much profit the company generates for every dollar of capital it has invested in its operations (both debt and equity). The Weighted Average Cost of Capital (WACC) is the blended cost of that capital. A business creates value only when ROIC > WACC. The wider the spread, the more value is created.
Reinvestment Runway and Capital Intensity
A high ROIC is great, but for a company to compound its value over time, it must be able to reinvest its profits back into the business at similarly high rates. This is the "reinvestment runway." We measure this by examining capital expenditures (CapEx) and research and development (R&D) spending. Capital Intensity tells us how many dollars of assets are required to generate a dollar of sales. For a pharmaceutical company, this includes capital expenditures (CapEx) and research and development (R&D) expenses.
From GAAP Net Income to Owner Earnings
Net Income is an accounting opinion. Free Cash Flow (FCF), also known as "Owner Earnings," is the cash remaining for shareholders after all expenses and necessary reinvestments have been paid. The bridge is crucial:
FCF = Net Income + Depreciation & Amortization - Change in Working Capital - Capital Expenditures.
This formula helps us see the real cash impact of growth. Rapid growth often consumes working capital, and building new factories (high CapEx) will depress FCF in the short term.
Moat Durability and Evidence
A moat is a structural competitive advantage that protects those high returns (ROIC). We don't listen to management claims; we look for evidence in the numbers. Sustained high gross margins (>60%), stable operating margins, and a consistently wide ROIC-WACC spread are quantitative proof of a moat. For Novo, this comes from its patents, brand recognition, and complex manufacturing process.
Case Study: Novo Nordisk (NOVOB DC)
Novo Nordisk is a Danish pharmaceutical giant founded in the 1920s, historically focused on diabetes care. Its recent development of GLP-1 agonists—first for diabetes (Ozempic) and later for obesity (Wegovy)—has caused an explosion in demand, revenue, and market value.
The Margin of Victory
The first place to look for evidence of a moat is the gross margin. It reflects the company's pricing power. Novo's is simply staggering.
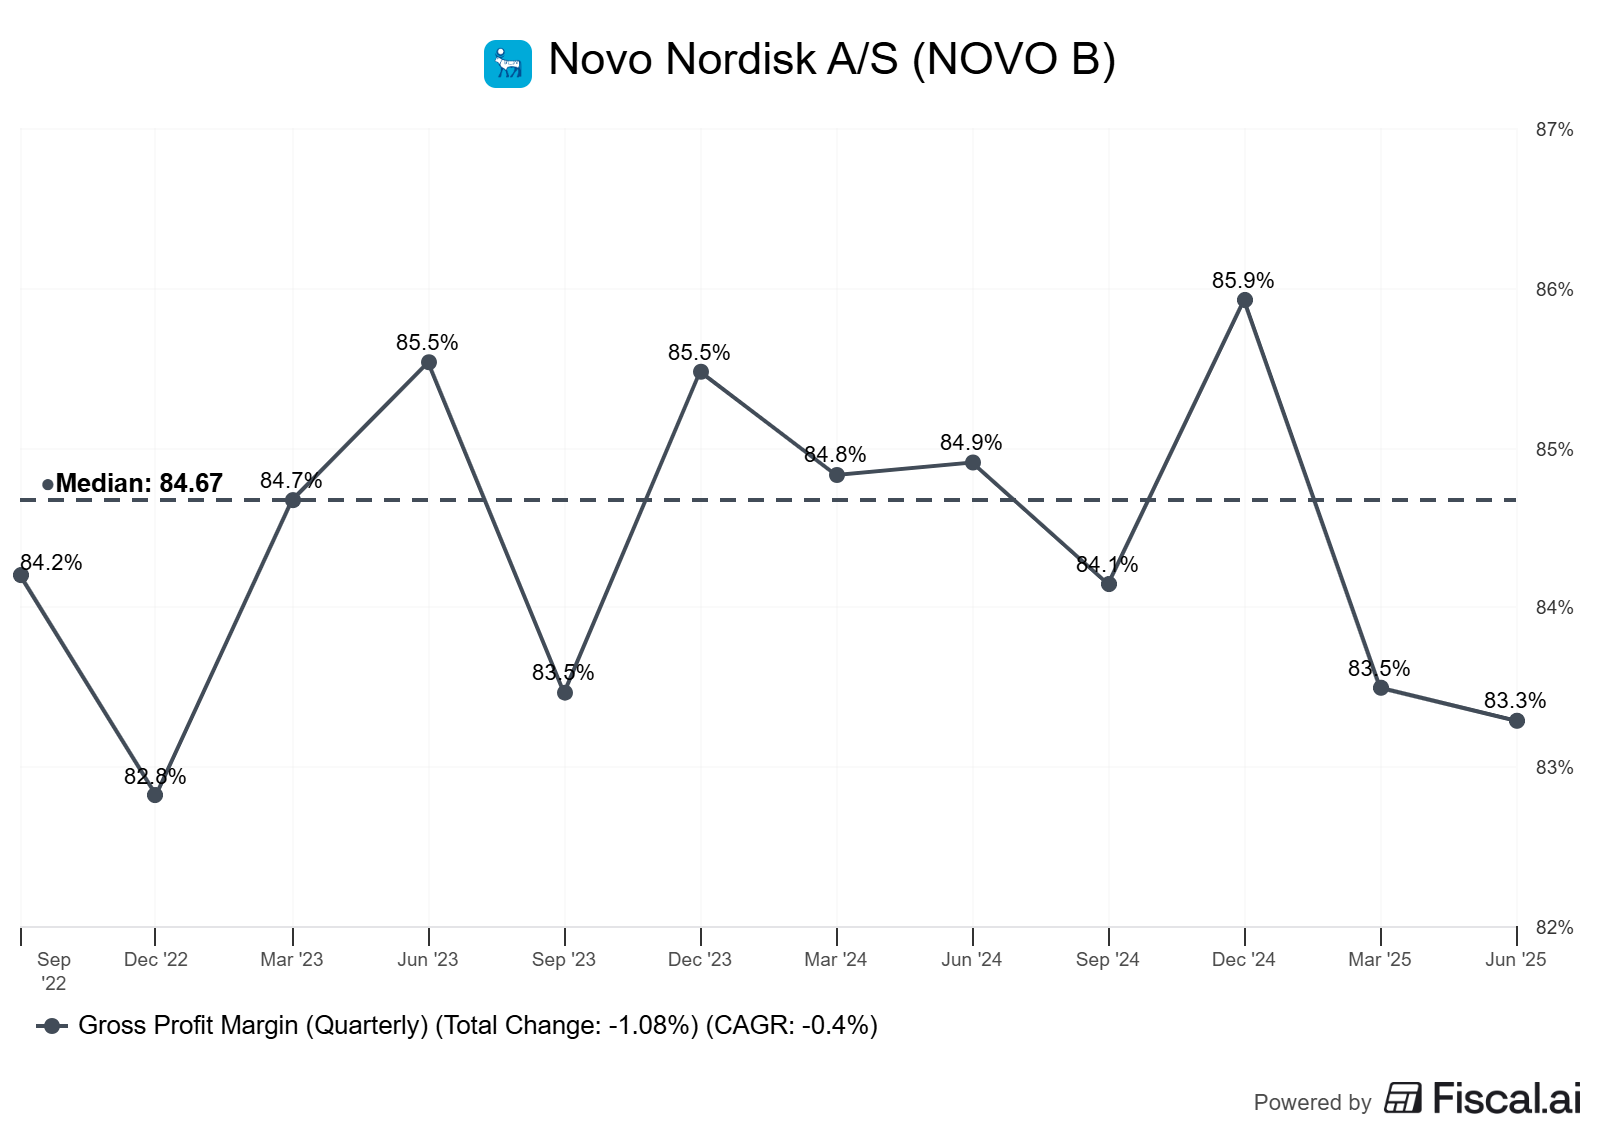
An 84%+ gross margin means that for every $100 of product sold, the direct cost of producing it (materials, factory labor) is less than $16. This leaves a substantial amount of gross profit to fund R&D, sales, and marketing, while still delivering exceptional operating profits.
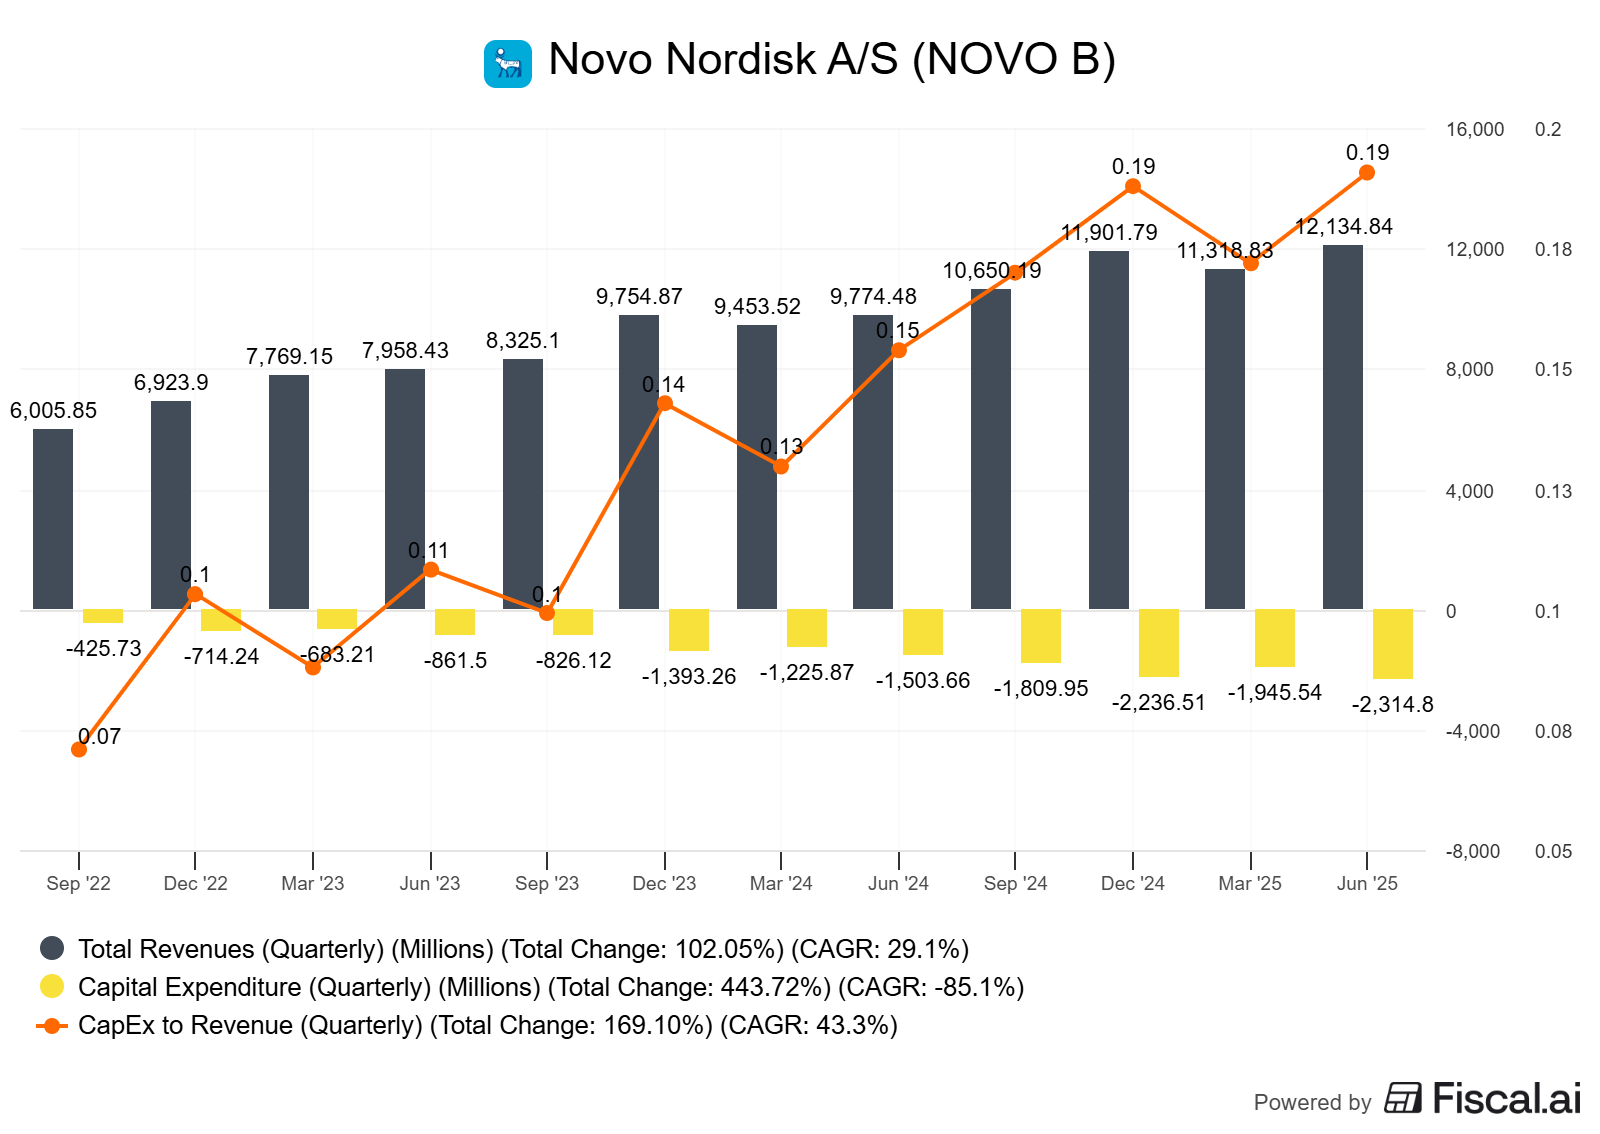
Reinvestment to Meet a Revolution
The GLP-1 drugs created a problem every company dreams of: demand far outstripping supply. To solve this, Novo is reinvesting at an unprecedented rate. In its 2023 Annual Report, the company projected capital expenditure of around DKK 45 billion (approximately $6.5 billion USD) for 2024, a significant increase from prior years (Novo Nordisk, 2024).
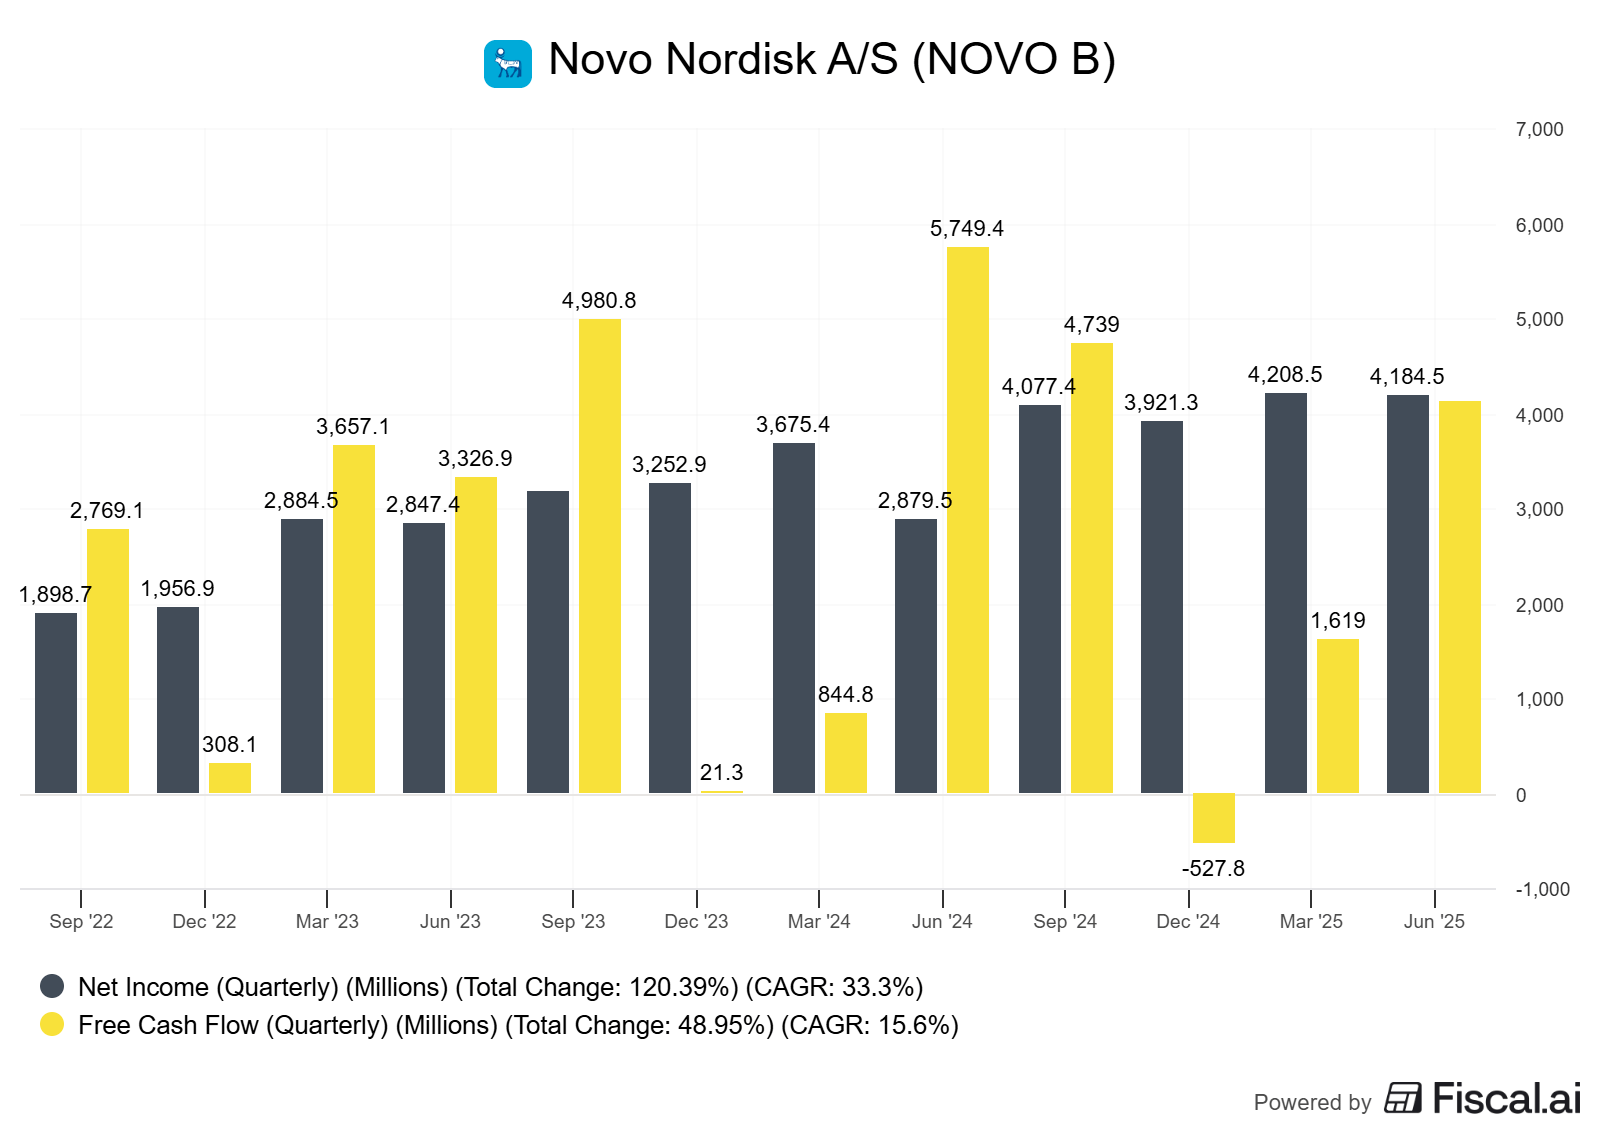
This spending directly impacts FCF. Let's build a simplified bridge from GAAP earnings to Owner Earnings to see this effect.
A reconciliation showing 2023 Net Income (DKK 83.7B), adding back D&A (DKK 13.9B), subtracting Change in WC (DKK -1.5B, a source of cash), and subtracting CapEx (DKK 26.1B) to arrive at a simplified FCF (DKK 73.0B). Note: Numbers are illustrative based on reported figures.
This bridge illustrates that while Net Income is a substantial number, the cash available to owners is reduced by the significant investment in future growth. The FCF conversion rate (FCF/Net Income) was approximately 87% in 2023. This is still healthy, but lower than in previous years, a direct result of the capital expenditure increases.
ROIC: The Ultimate Scorecard
Despite the heavy investment, Novo's profitability is so high that its ROIC remains in a league of its own.
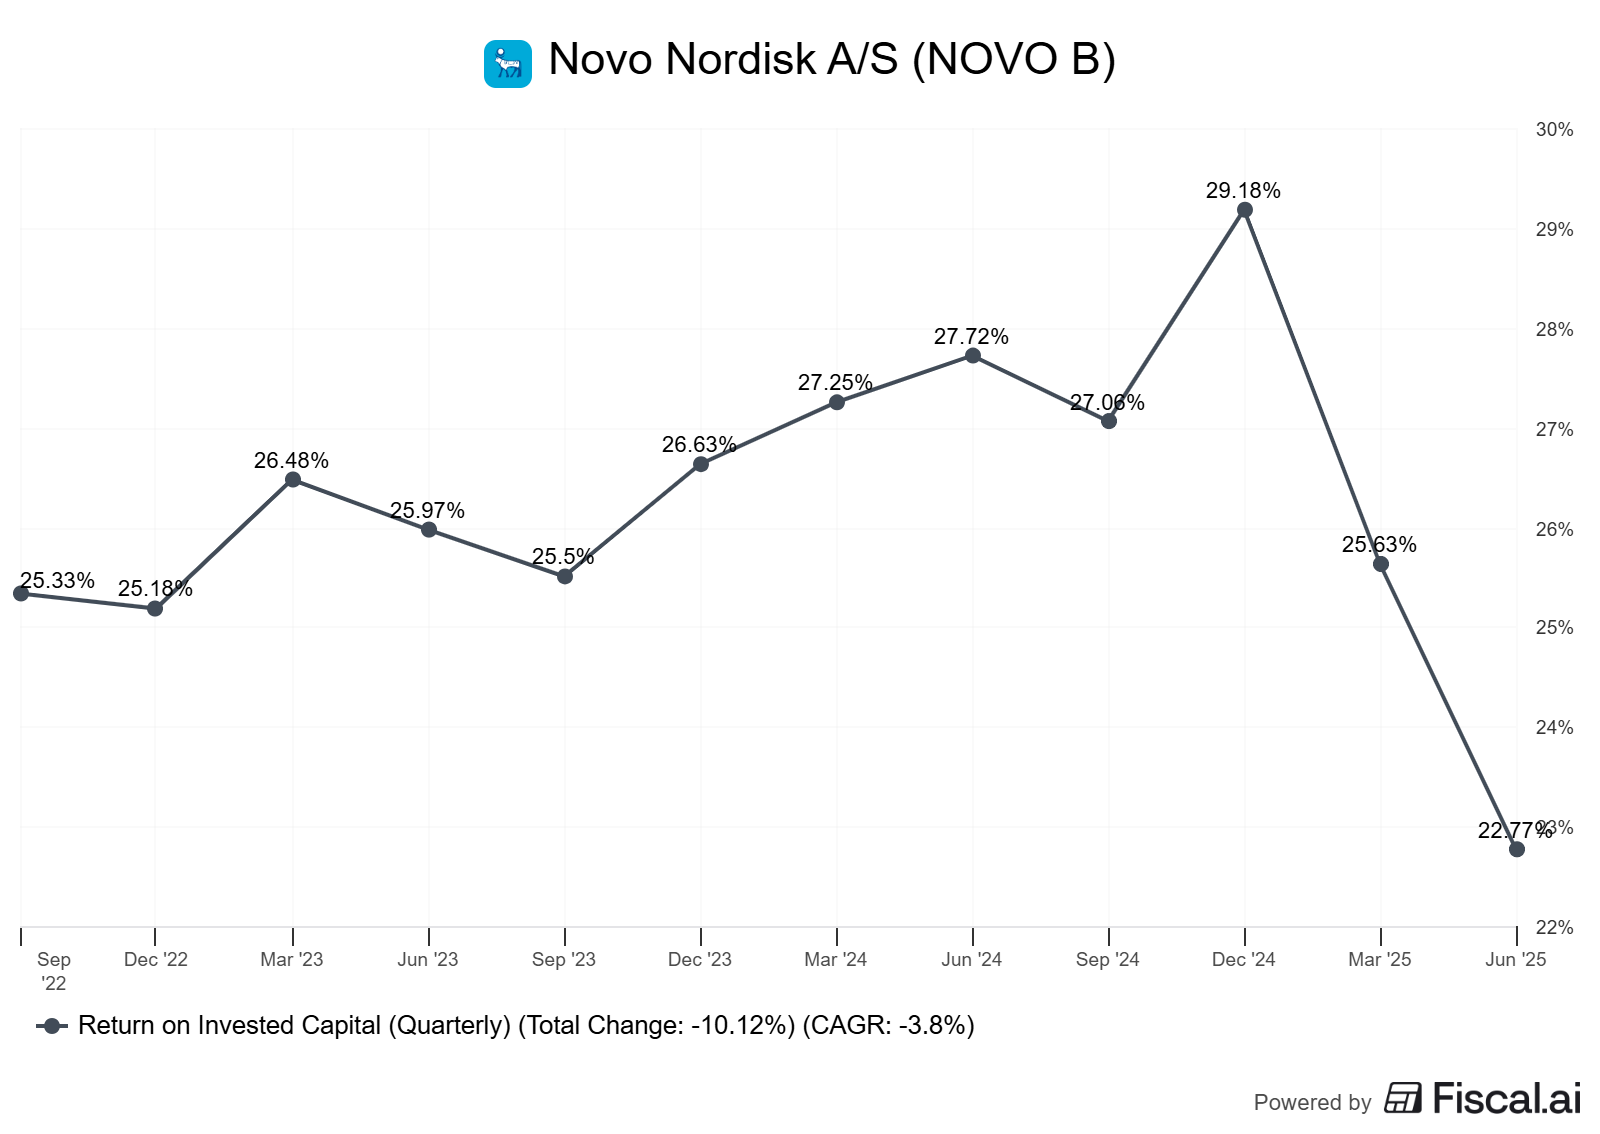
A ROIC consistently above 20-30% is extraordinary. It means the business is a compounding machine. The key question for the future is whether the returns on the new capital being invested in factories will be as high as the returns on the existing capital base. Given the unmet demand, the answer for the medium term appears to be yes.
Per-Share Framing
Growth is only valuable to shareholders if it translates to per-share value. Novo has a strong track record of returning capital to shareholders via dividends and buybacks, which reduces the share count over time.
How To Do This Yourself: A Step-by-Step Guide
Gather Data: Go to the investor relations website of the company you're analyzing. Download the latest annual report (10-K or 20-F) and investor presentation.
Check Gross Margins: Find the Income Statement. Divide "Gross Profit" by "Revenue." Look at the 10-year trend. Decision Rule: Prefer companies with stable or rising gross margins above 40%; above 60% is exceptional.
Calculate ROIC: This is the trickiest part. A simplified formula is
NOPAT / (Total Debt + Total Equity - Cash). NOPAT is "Net Operating Profit After Tax." Many data providers like Fiscal.ai provide this pre-calculated. Decision Rule: Prefer companies where ROIC has consistently been at least 5 percentage points above WACC (a good proxy for WACC is 8-10%).Analyze Reinvestment: Find the Cash Flow Statement. Look for "Capital Expenditures" (or "Purchase of property, plant and equipment"). Compare this to "Net Income." Also, look at R&D spending on the Income Statement. Decision Rule: High reinvestment in a high-ROIC business is good. High reinvestment in a low-ROIC business destroys value.
Bridge to FCF: On the Cash Flow Statement, start with "Net Income." Follow the "Cash Flow from Operations" section down, and then subtract CapEx. This gives you FCF. Calculate FCF / Net Income. Decision Rule: A conversion rate of 100% or higher is considered excellent. A temporarily low rate due to a high-return investment (like Novo) can be a positive sign.
Pitfalls and False Positives
Peak Margins: Are Novo's 84%+ gross margins sustainable? Increased competition from Eli Lilly and others, plus potential government pricing pressure, could cause margins to revert to a lower (but still excellent) level.
The CapEx Trap: The company is spending billions on factories. Any manufacturing delays, quality control issues, or a sudden drop in demand could result in this new capital earning a much lower return than anticipated.
Single Product Risk: While Novo has a portfolio, its fortunes are overwhelmingly tied to the GLP-1 franchise. Any unforeseen long-term side effects or a superior competing therapy could significantly impact its future.
Checklist: Case Study Analysis
Check the 10-year trend of Gross and Operating Margins. Are they high and stable?
Compare ROIC vs. WACC over 10 years. Is there a consistent, wide spread?
Analyze the reinvestment rate (CapEx + R&D as a % of NOPAT). Is the company deploying capital for growth?
Bridge Net Income to Free Cash Flow. Is the FCF conversion rate healthy? If not, is it due to high-return investments?
Check the trend of shares outstanding. Is management creating value on a per-share basis?
Identify the primary source of the moat (e.g., patents, brand, network effects).
List the top 3 risks that could impair the company's ROIC.
Glossary
ROIC (Return on Invested Capital): The profits a company generates for every dollar of capital invested.
WACC (Weighted Average Cost of Capital): The blended average rate a company is expected to pay to finance its assets.
Free Cash Flow (FCF): The cash left over after a company pays for its operating expenses and capital expenditures.
Moat: A sustainable competitive advantage that protects a company's profits from competitors.
Capital Expenditures (CapEx): Funds used by a company to acquire, upgrade, and maintain physical assets like property, buildings, and equipment.
GLP-1 Agonists: A class of medications that are used in the treatment of type 2 diabetes and obesity.
Per-Share Metrics: Data points (like revenue, earnings, or FCF) viewed on a per-share basis to account for buybacks or dilution.
Further Reading
Competition Demystified by Bruce Greenwald and Judd Kahn (2005) - A masterclass on identifying and analyzing competitive advantages.
The Outsiders: Eight Unconventional CEOs and Their Radically Rational Blueprint for Success by William N. Thorndike (2012) - Excellent case studies on capital allocation.
Michael Mauboussin, "Calculating Return on Invested Capital" - Credit Suisse (2015) - A detailed guide on the nuances of ROIC.
References
Novo Nordisk, "Annual Report 2023," as of March 2024. https://www.novonordisk.com/investors/annual-report.html
Financial data sourced from publicly available information on platforms like Fiscal.ai, as of September 2024.
Educational content, not investment advice.