
Normalizing Earnings for Quality: A Deep Dive on Amphenol (APH)

Normalization is the antidote to overpaying for the last quarter’s excitement.
In today’s article, we show how to convert great accounting results into mid‑cycle “owner earnings” and a realistic valuation. We’ll do it step-by-step with Amphenol (APH), a high-quality US compounder.
4) TL;DR
Quality investors anchor on ROIC > WACC, per‑share value creation, and cash conversion—then normalize to mid‑cycle.
Normalization = removing one‑offs, using mid‑cycle margins, maintenance capex, and steady‑state working capital.
For APH, 2024 had record sales and margins; we show how to reset to mid‑cycle and compute owner earnings.
Run a reverse DCF using normalized FCF, realistic reinvestment, and a WACC range—then sanity‑check against base rates.
Decision rules: prefer sustained ROIC – WACC > 5%; FCF conversion 80–100%; normalized EV/FCF only modestly above 10‑yr median.
Why it matters
Cycles distort valuation. Great businesses often print record quarters in hot end‑markets (AI/datacom, defense), then cool off. Normalization builds a mid‑cycle earnings base that:
Prevents overpaying for peak margins.
Imposes discipline through per‑share, cash‑based metrics.
Anchors reverse DCFs in realistic reinvestment and cost of capital.
Where investors go wrong:
Using peak conversion margins or trough capex as a steady state.
Underestimating working capital needs during periods of growth surge.
Ignoring dilution from stock‑based comp (SBC) when touting FCF/share.
Treating acquisition‑related charges and integration timing as “noise” without any adjustment to steady‑state economics.
Core concepts (quality angle)
ROIC vs WACC and value creation
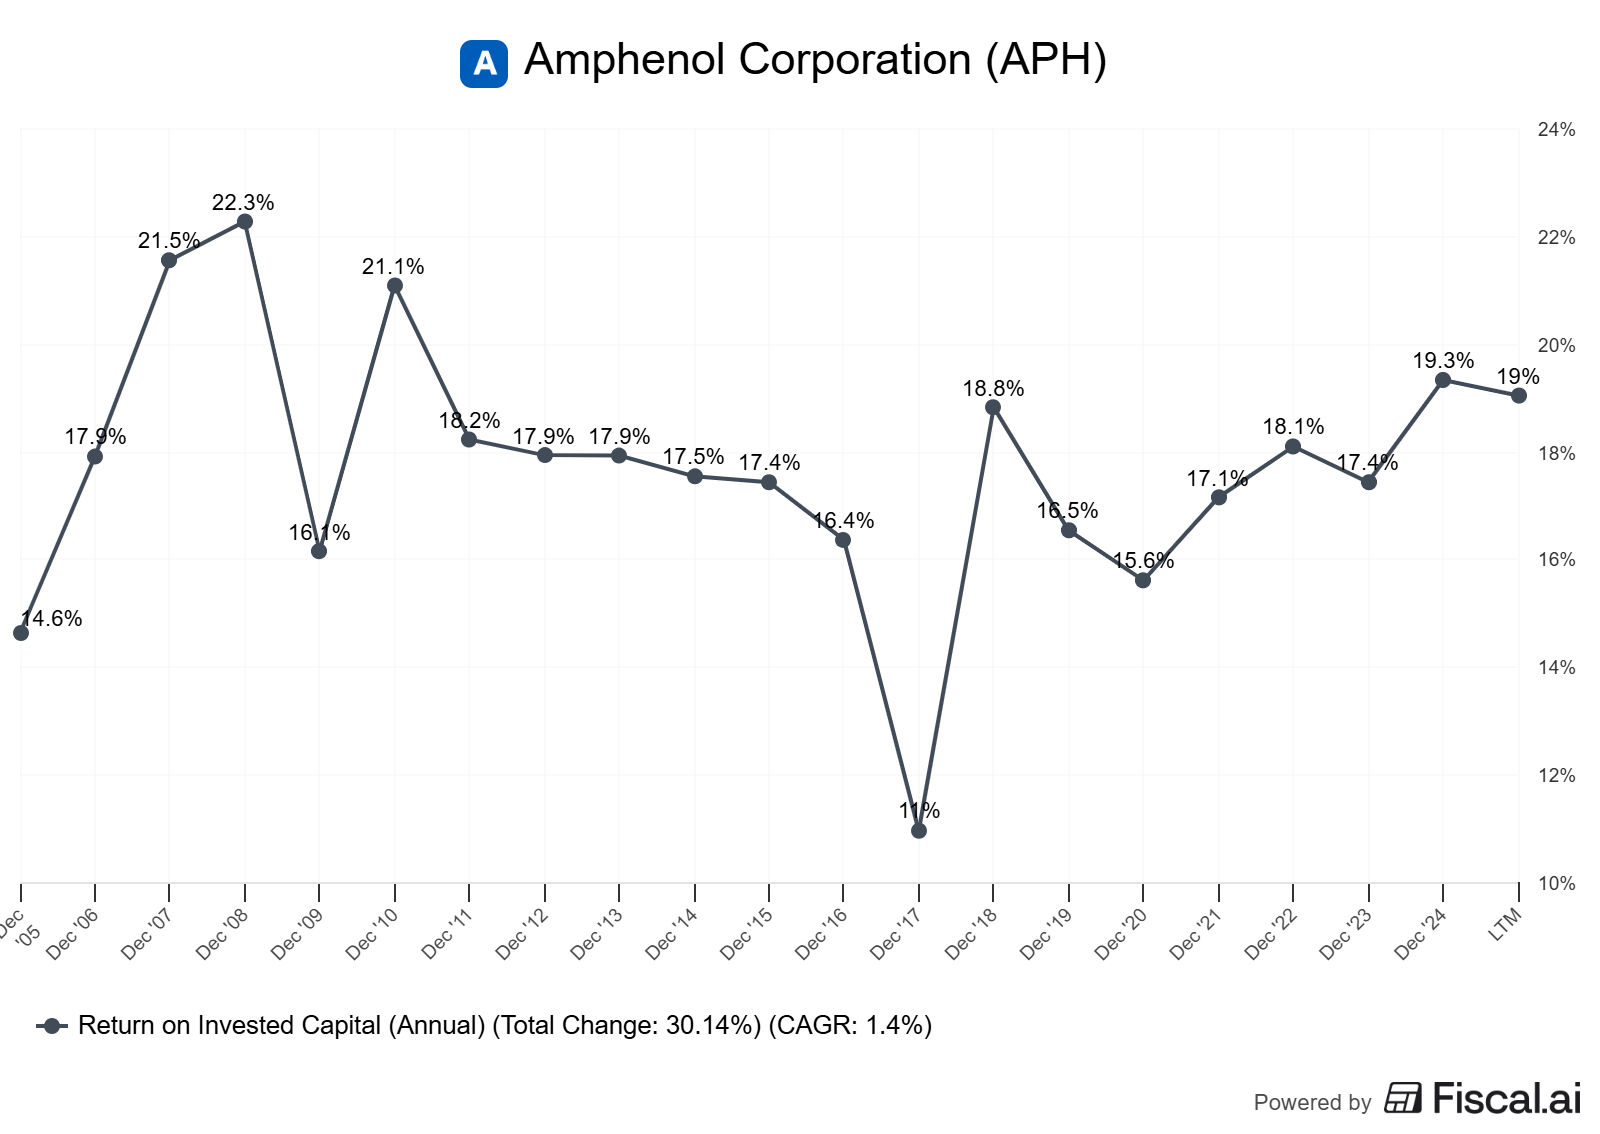
ROIC (return on invested capital) above WACC (weighted average cost of capital) indicates value creation. Quality investors look for sustained positive spread, ideally >5% across cycles.
Third‑party estimates peg APH’s ROIC in the mid‑teens to low‑20s on a TTM basis depending on definition and inputs, well above typical 8–9% WACC for large, diversified industrial/tech hardware suppliers (as of 2025) [ranges sourced; see References]. Differences reflect definitional choices (operating leases, goodwill, tax normalization).
Reinvestment runway and capital intensity
Durable reinvestment channels: organic R&D and capital projects (usually 3–4% of sales capex at steady state), and targeted M&A.
APH expects capex to be “somewhat elevated” during the AI ramp vs typical 3–4% of sales, implying normalization should revert to that 3–4% range over time (as stated on earnings calls; see References, as of 2025).
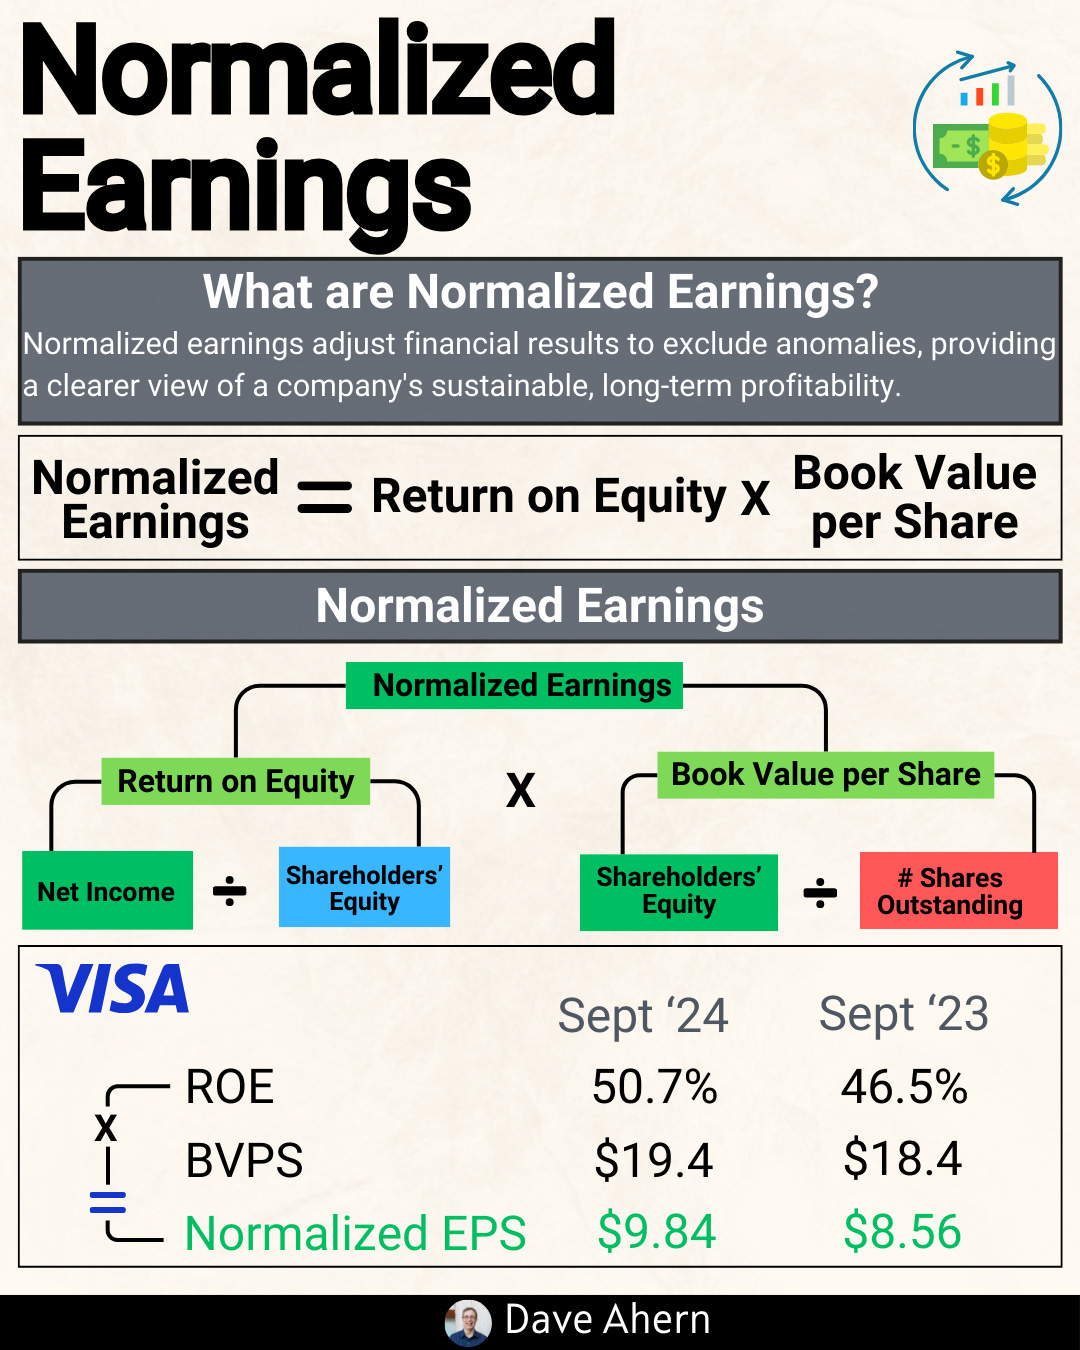
Unit economics and per‑share metrics
Owner earnings (Buffett proxy for FCF): NOPAT + D&A − maintenance capex ± normalized working capital − recurring SBC (if treated as cash-like).
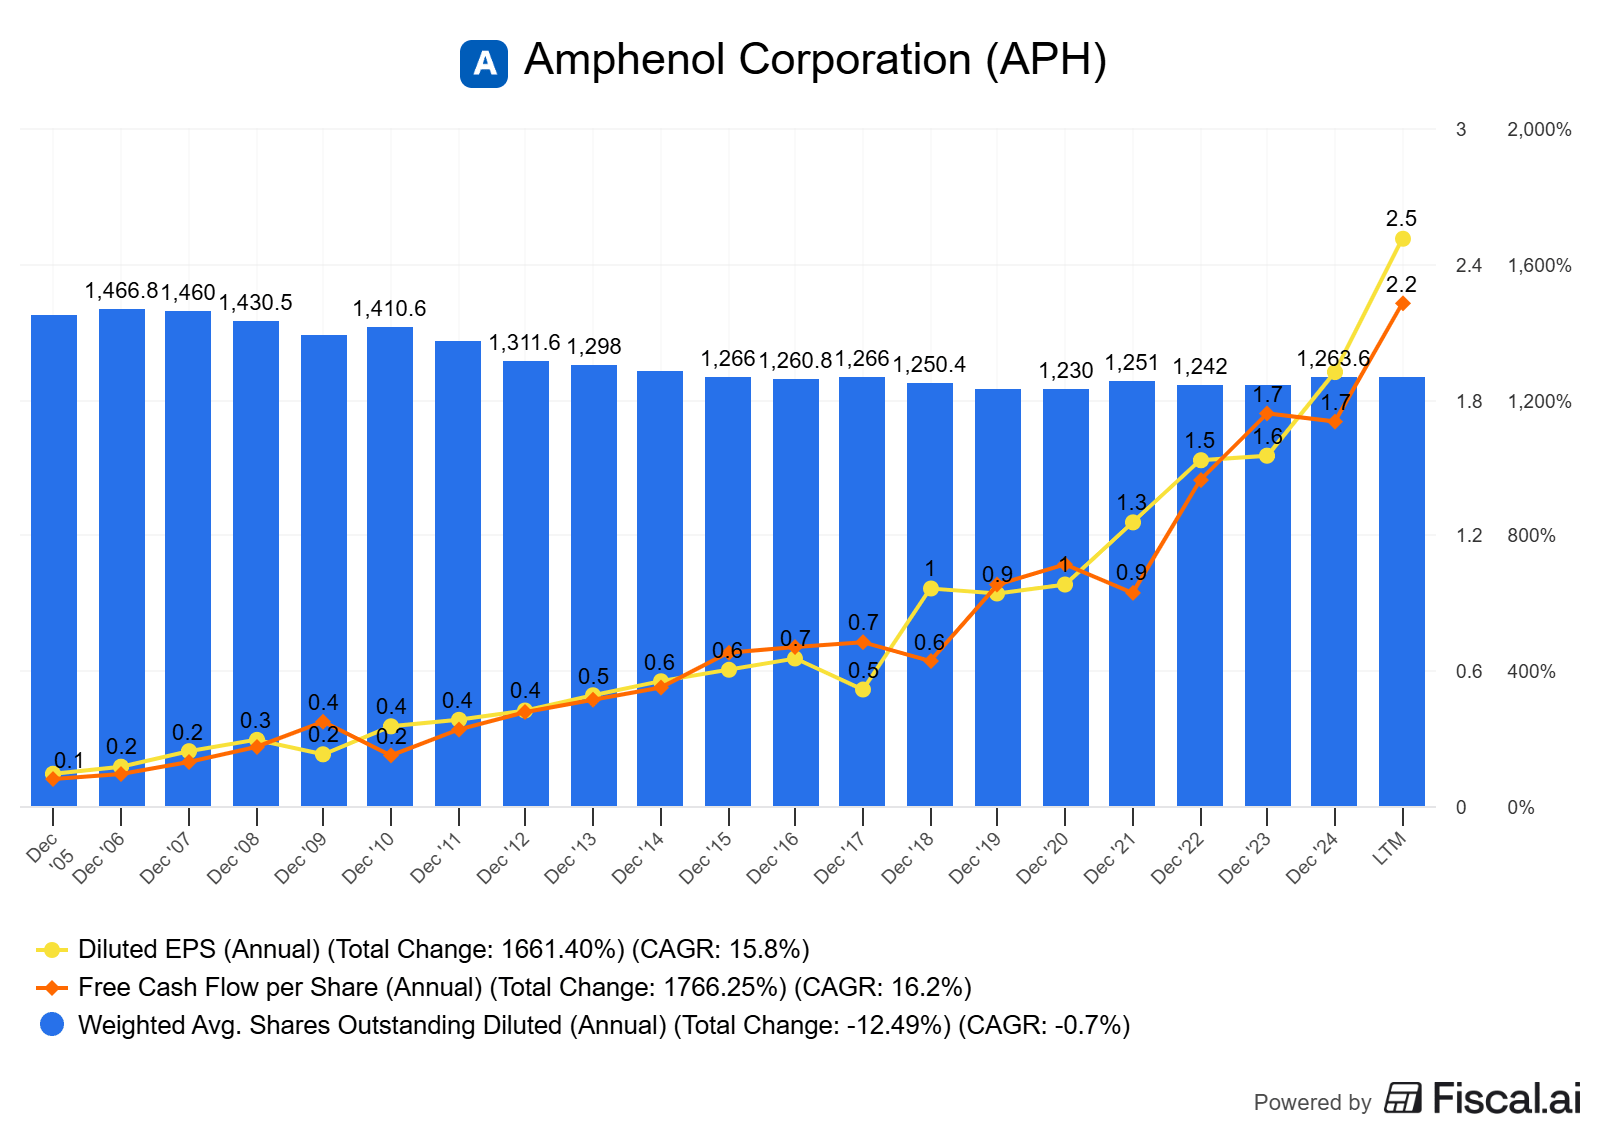
Per‑share framing: track FCF/share, EPS/share, and share count trajectory (buybacks minus SBC).
Moat durability and evidence (not claims)
Evidence: diversified end‑markets, pricing power in high‑speed interconnects, decentralized entrepreneurship enabling fast innovation and integration, and disciplined M&A.
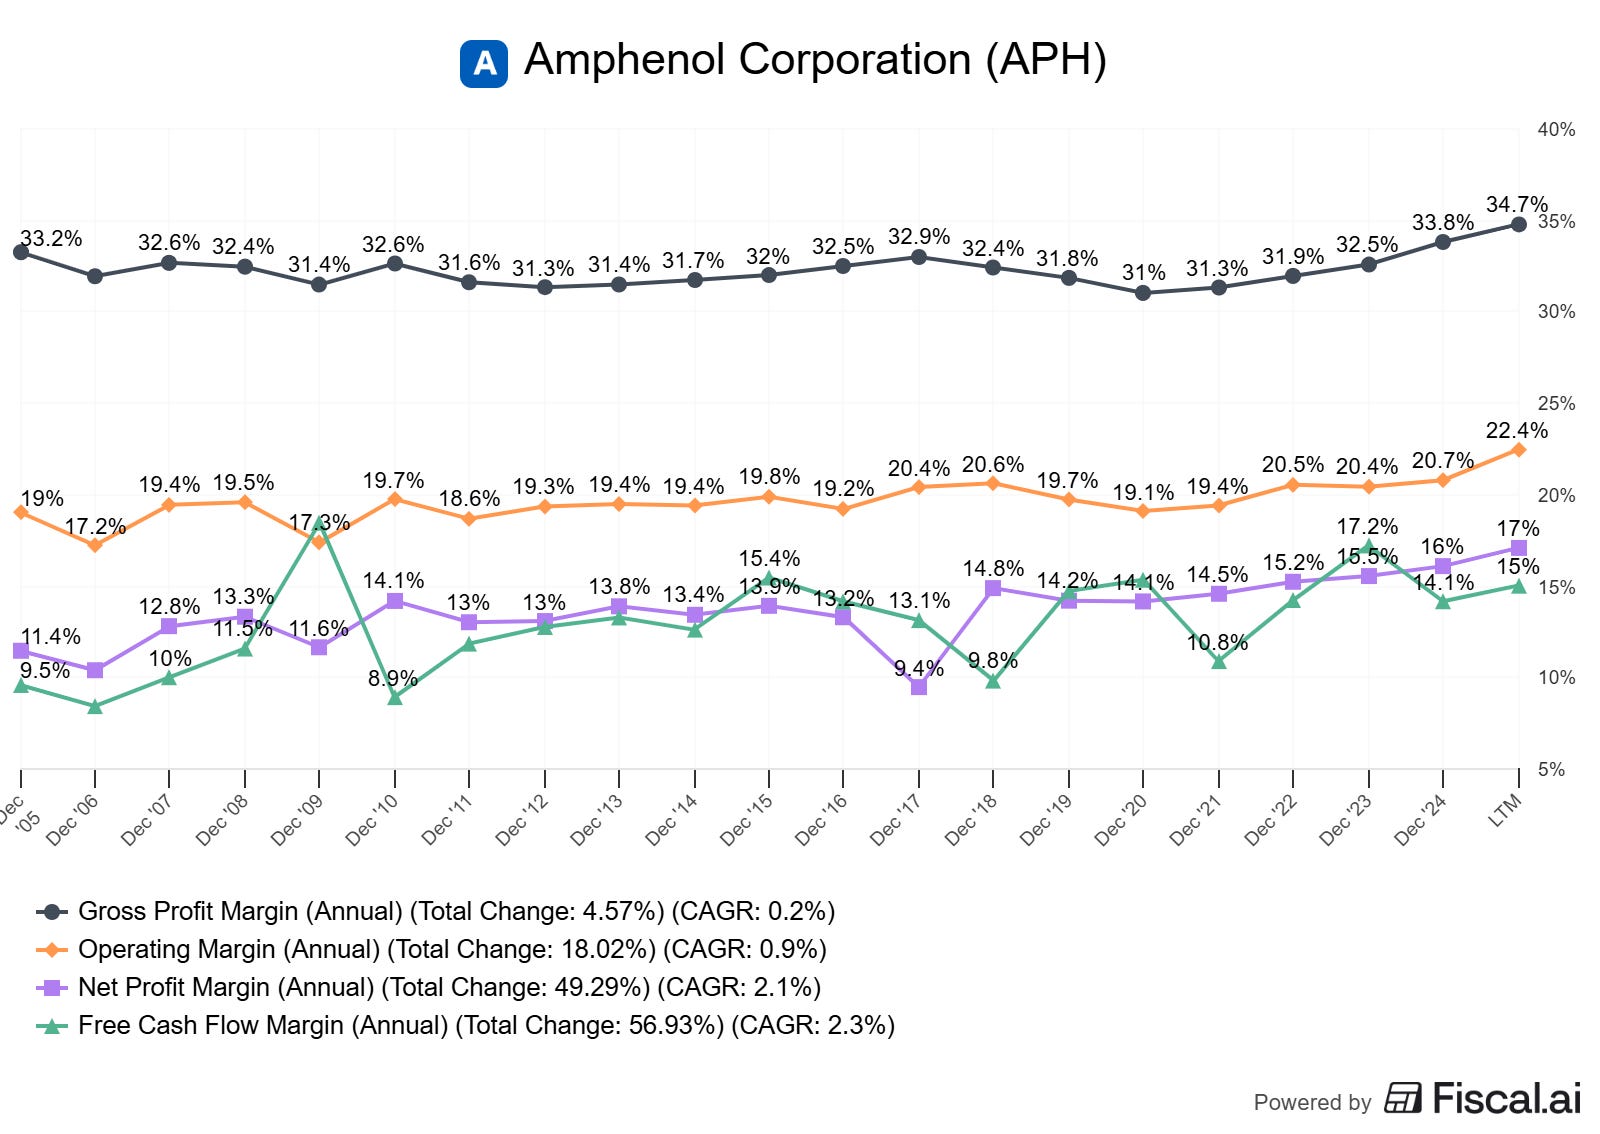
Watch for: sustained gross/operating margin stability, FCF conversion (>85%), and ROIC above WACC through soft patches.
Valuation Monday focus: frameworks and scenarios
Start with normalized owner earnings (steady‑state FCF).
Design three scenarios (Bear/Base/Bull) for sales CAGR, margin path, mix, reinvestment rate, and capital allocation.
Run a reverse DCF to see what growth/margin trajectory the current price implies (are expectations plausible against history and base rates?).
Sensitivities: WACC (±100 bps), terminal growth (±50 bps), conversion margin (±200 bps), and reinvestment intensity (capex + working capital).
Worked example: Amphenol (APH)
Amphenol is a US-based global provider of interconnect, antenna, and sensor solutions with broad end‑market exposure (IT/datacom, industrial, defense, commercial aerospace, automotive, mobile devices). 2024 was a record year; 2025 accelerated further in AI‑linked end markets.
Key factual anchors
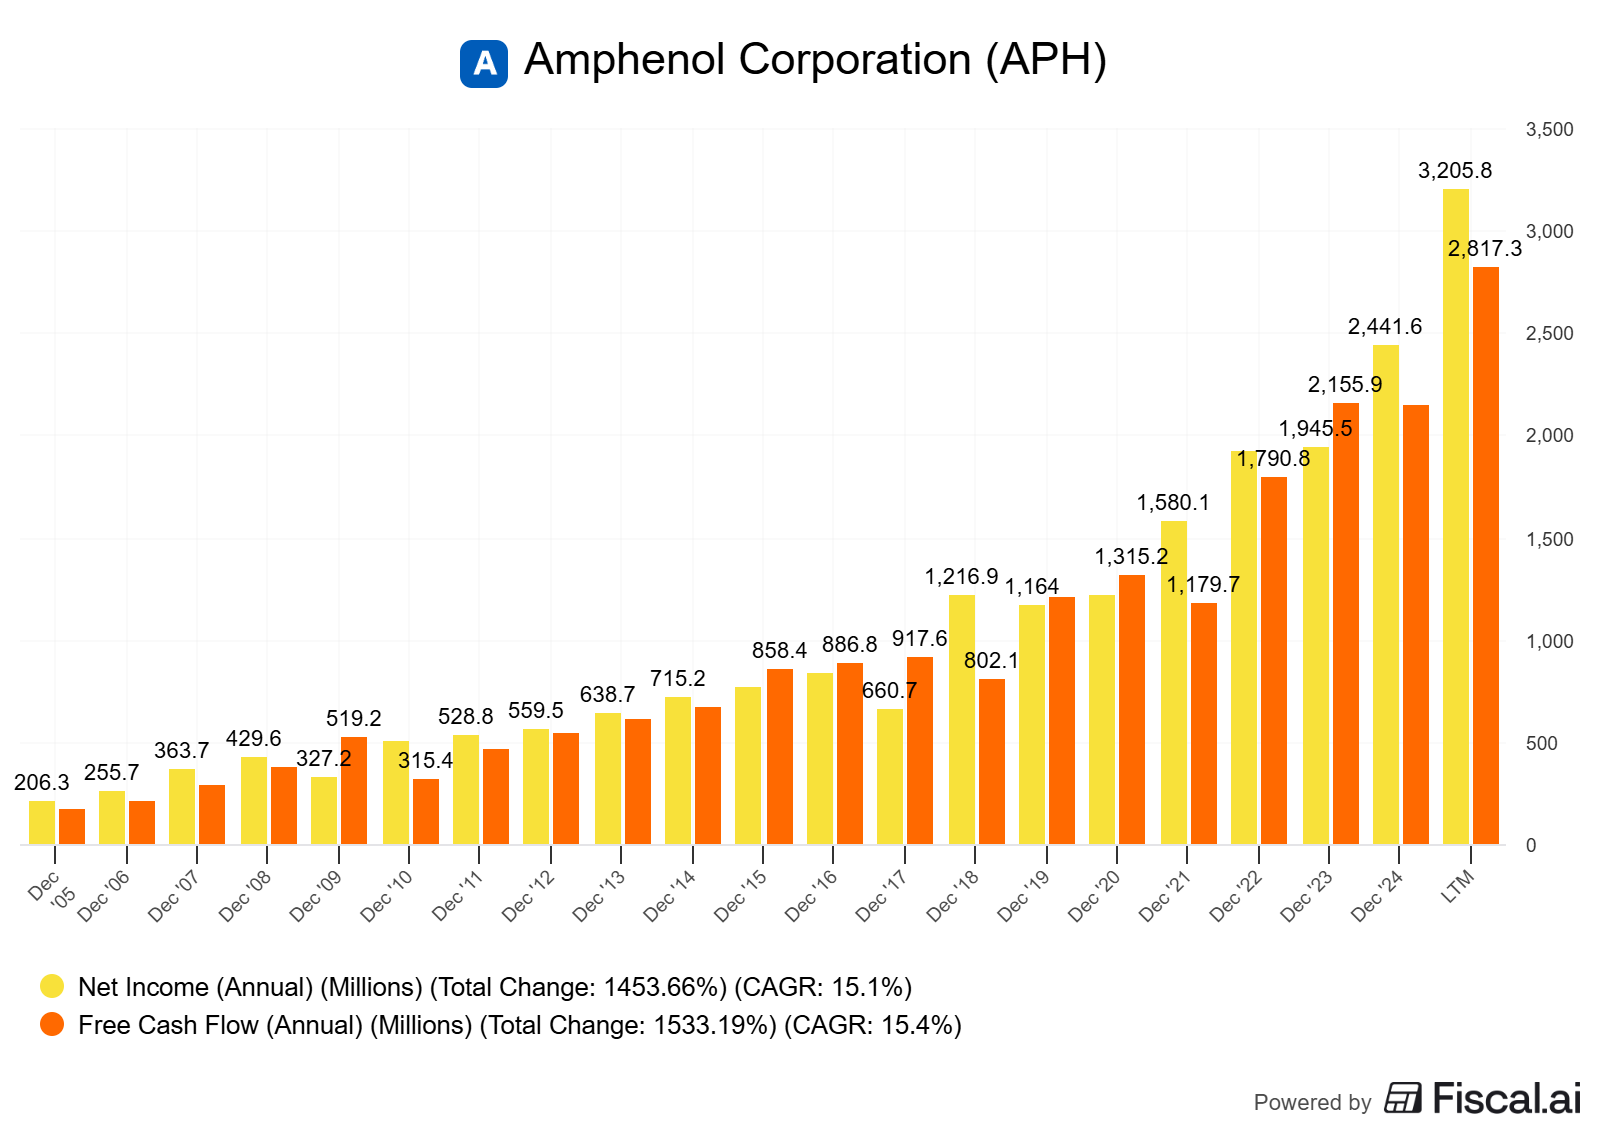
2024 sales: $15.2B; adjusted operating margin: 21.7%; free cash flow (FCF): $2.16B (as of 2024 year-end; company press release) [Amphenol 2024 10‑K press release, as of Jan 22, 2025].
2024 adjusted EPS growth, 10‑year CAGRs: sales +11%, adjusted EPS +13% (2014–2024; investor presentation, May 2025) [Amphenol investor presentation, May 2025].
Q1 2025: record adjusted operating margin 23.5%; FCF $580M; AI/datacom a major driver; acquisitions closed (Andrew/CommScope’s OWN & DAS, LifeSync) [Amphenol Q1 2025 press release, as of Apr 30, 2025; see IR site].
Q2 2025: adjusted operating margin 25.6%; FCF $1.12B; management lifted long‑term incremental operating margin target to ~30% conversion; noted some “lumpiness” in AI shipments [Motley Fool transcript; company disclosures; as of Jul 23, 2025].
Caveat on ROIC: reported/third‑party ROIC ranges from mid‑teens to ~20%+ depending on invested capital definition. The direction is clear (ROIC > WACC), but use a consistent definition for your model.
Practical normalization examples for APH
Example A: Normalize FY2024 to steady‑state owner earnings
Reported anchors (as of Jan 22, 2025 press release):
Sales: $15.223B
Adjusted operating margin: 21.7%
Operating cash flow (OCF): $2.815B
Free cash flow (FCF): $2.157B
Step 1: Maintenance capex
Management frames “typical” capex around 3–4% of sales through the cycle (capex was elevated in 2025 to support AI/datacom capacity; see Q1/Q2 remarks).
2024’s implied capex = OCF − FCF ≈ $658M ≈ 4.3% of sales (top‑end of typical).
Normalize capex to 3.5% of sales: 3.5% × $15.223B ≈ $533M.
Step 2: Working capital normalization
Inventory and other working capital moved in 2024 (10‑K notes inventories increased); if OCF includes a working capital build, then steady‑state OCF would be slightly higher. Absent precise breakouts here, we’ll keep OCF as is and note the bias.
Step 3: SBC treatment
APH’s SBC is modest relative to software peers; include it as a recurring economic expense if it’s material (>~1–2% of sales) and not fully offset by anti‑dilutive buybacks.
Step 4: Owner earnings (normalized)
Owner earnings (proxy) ≈ OCF − maintenance capex ≈ $2.815B − $0.533B ≈ $2.28B.
Reported FCF was $2.16B; normalization lifts steady‑state by ~+$120M because 2024 capex sat above mid‑cycle.
Per‑share framing
Shares outstanding as of Jan 31, 2025: ~1.211B (post stock splits) [2024 10‑K, as of Feb 7, 2025].
Normalized FCF per share ≈ $2.28B / 1.211B ≈ ~$1.88.
Interpretation
This base is reasonable for a mid‑cycle year with strong execution. If AI mix retreats to a more normal share of sales, conversion margins and working capital intensity could drift closer to historical averages.
Example B: TTM mid‑2025 run‑rate normalization (AI surge adjustment)
Reported anchors (as of Q1–Q2 2025 disclosures):
Adjusted operating margin stepped up to 23.5% in Q1 and 25.6% in Q2; management increased incremental conversion margin targets to ~30% (short‑ to mid‑term).
Capex “somewhat elevated” above typical 3–4% to support AI/datacom.
Normalization approach
Mid‑cycle operating margin assumption: 22–23% (vs Q2’s 25.6%) to avoid baking in peak AI mix. This aligns with 2024’s 21.7% adjusted margin plus a modest structural uplift.
Maintenance capex: revert to 3.5% of sales over cycle (vs temporarily higher in 2025).
Working capital: assume a neutral (0%) change over the cycle.
Result (illustrative mechanics, not a forecast):
If 2025 exits at a higher revenue base, apply 22–23% op margin, a 21% effective tax, D&A roughly equal to historical share of sales, and maintenance capex at 3–4% of sales to estimate steady‑state owner earnings. Then compare to reported TTM FCF to gauge how much is cyclical uplift vs structural improvement.
Decision rule
If your valuation only “works” when you assume 25–26% sustained operating margins and capex permanently at the low end of the range, it likely overstates mid‑cycle value.
Do it yourself: steps, checks, thresholds
Data to gather (with sources)
10‑K and 10‑Qs: revenue, segment mix, margins, tax rate, working capital, D&A, capex, SBC, share count, buybacks [see References].
Investor presentation: 10‑yr sales/EPS CAGRs, market mix, capital allocation [investor presentation, May 2025].
Press releases: quarterly margins/FCF conversion, commentary on capex and mix [Q4‑2024, Q1‑2025, Q2‑2025].
Exact checks/calculations
Mid‑cycle operating margin:
Use 5–10‑yr band; clip one‑offs; anchor near 2024’s 21.7% and adjust for structural mix (±100–200 bps).
Maintenance capex:
3–4% of sales for APH as a steady‑state anchor; use the midpoint unless you have plant‑level evidence.
Working capital:
Normalize to 0% delta over cycle; if inventories ballooned in a ramp, add back part of the build.
SBC and dilution:
Treat SBC as an expense; if buybacks fully offset, adjust per‑share accordingly.
Owner earnings:
NOPAT + D&A − maintenance capex ± normalized WC − SBC (if not offset).
Reverse DCF setup:
Input: starting FCF (normalized), sales CAGR, margin path, reinvestment intensity, WACC range (e.g., 8–9%), terminal growth (e.g., 2.5–3% for a mature global supplier).
Sanity‑check against base rates:
Long‑run sales CAGR (10‑yrs): APH did ~11% (2014–2024) [May 2025 investor deck].
Long‑run adjusted EPS CAGR (10‑yrs): ~13% [May 2025 investor deck].
Decision thresholds
ROIC – WACC > 5% sustained.
FCF conversion (FCF / NI) 80–100% through the cycle.
EV/FCF vs 10‑yr median: pay a premium only if you see durable structural uplift (product mix, scale economies, enduring demand drivers).
Pitfalls and false positives
Peak mixing: Extrapolating AI‑heavy margin peaks as the new normal.
Acquisition haze: Ignoring acquisition‑related costs when estimating steady‑state margins and cash conversion during integration.
Capex myopia: Using temporarily low capex as “maintenance” when management is clearly signaling elevated spend.
“Adjusted” drift: Blindly trusting non‑GAAP adjustments; reconcile to GAAP and back to cash.
Per‑share blind spot: Strong FCF but rising share count from SBC or M&A can dilute per‑share progress.
Checklist / one‑pager
ROIC vs WACC spread > 5% over 5–10 years?
Normalized operating margin anchored to a 5–10‑yr band (not peak)?
Maintenance capex set at 3–4% of sales (APH) unless evidence justifies deviation?
Working capital normalized to 0% over cycle (adjust for ramp)?
SBC treated as cash-like if material and not offset by buybacks?
Owner earnings computed and translated to per‑share?
Reverse DCF run with 3 scenarios, WACC 8–9%, terminal 2.5–3%?
Current EV/FCF vs 10‑yr median premium justified by structural moat expansion?
Mini‑FAQ
Q1: Should I use GAAP or adjusted margins?
Use GAAP for completeness; adjust thoughtfully for recurring economics. For normalization, start with adjusted operating margin, then haircut for mid‑cycle and add back real economic costs (SBC, maintenance capex).
Q2: How do I pick WACC?
Use a range. For diversified, large‑cap industrial/tech suppliers, 8–9% is a reasonable 2025 anchor depending on leverage, cyclicality, and beta. Always sensitivity‑test ±100 bps.
Q3: Should I count SBC as cash?
If SBC is material and not fully offset by anti‑dilutive buybacks, treat it as a cash‑like cost to equity holders (reduces per‑share value).
Q4: What’s a good FCF conversion?
80–100% over a cycle is healthy for a manufacturing business with recurring reinvestment needs. APH’s 2024 FCF was ~$2.16B vs robust net income, with conversion influenced by capex and WC (as of Jan 22, 2025).
Q5: How do I know if I’m overpaying?
If your valuation only works with peak conversion margins, below‑maintenance capex, and high terminal growth, you’re overfitting to a hot cycle.
Glossary
ROIC: Return on invested capital; after‑tax operating profit divided by invested capital.
WACC: Weighted average cost of capital; blended required return for debt and equity.
Owner earnings: Cash earnings available to owners after maintenance capex and normalized working capital.
FCF conversion: Free cash flow divided by net income; gauges earnings quality.
Incremental operating margin (conversion): Profit generated per incremental dollar of sales.
Maintenance capex: Spending required to sustain current capacity/competitiveness.
Normalization: Adjusting to mid‑cycle economics by removing one‑offs and cyclical extremes.
Reverse DCF: Backing into the growth/margin expectations implied by the current price.
Further reading
APH Investor Presentation (May 2025) — growth, margins, capital allocation (as of May 2025) [PDF link in References].
Quality investing frameworks: ROIC vs WACC and reinvestment base rates (academic/industry primers).
Cash conversion cycle and working capital management (practical guides for analysts).
Reverse DCF and scenario analysis primers (finance textbooks, practitioner notes).
References
Amphenol Reports Record Fourth Quarter and Full Year 2024 Results (press release; as of Jan 22, 2025): https://investors.amphenol.com/news-and-events/news-details/2025/Amphenol-Reports-Record-Fourth-Quarter-and-Full-Year-2024-Results/default.aspx and archived via Last10K: Last10K 2024 10‑K press release
Amphenol Investor Presentation (May 2025; as of May 13, 2025): PDF
Amphenol Reports Record First Quarter 2025 Results (press release; as of Apr 30, 2025): https://investors.amphenol.com/news-and-events/news-details/2025/Amphenol-Reports-Record-First-Quarter-2025-Results/default.aspx
Amphenol Q2 2025 Earnings Call Transcript (as of Jul 23, 2025): Motley Fool
Amphenol Financials and SEC Filings (as of Feb 7, 2025 for 10‑K): https://investors.amphenol.com/financials/sec-filings/default.aspx and 10‑K on CapEdge: CapEdge 2024 10‑K
Third‑party ROIC snapshot (definition varies; as of Jun 2025): GuruFocus ROIC page
Where we used approximate ranges (WACC, “typical” capex bands), we labeled them as assumptions and cross‑checked against management commentary and historical disclosures.