
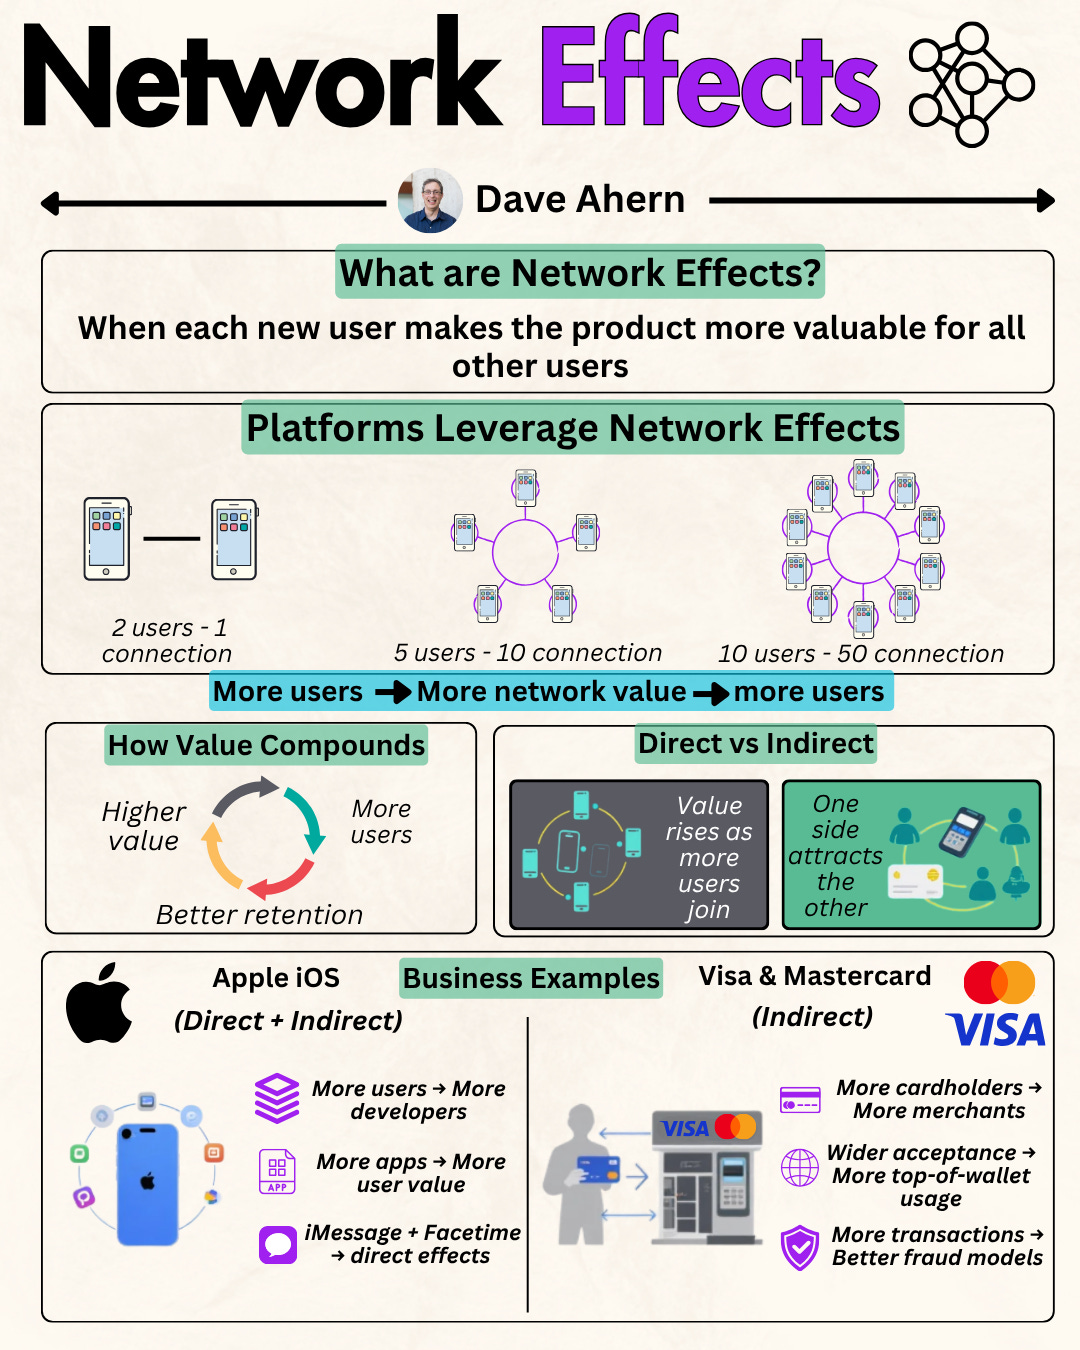
Network Effects Checklist with Uber

Network effects get thrown around like confetti in investor presentations, but most claims fall apart under scrutiny. Uber operates 180 million monthly active users across 70 countries, yet its network effects are fundamentally weaker than many investors assume.
Today’s article gives you a practical checklist to separate real network effects from marketing spin, using Uber’s actual data to show what genuine, but limited, NFX look like in practice.
TL;DR
Uber demonstrates asymptotic network effects that plateau around 3-4 minute wait times, not true escalating marketplace dynamics
Real network effects require per-user value increase as the network scales; Uber’s supply-side effects hit diminishing returns early
Geographic density creates hyperlocal moats, but low switching costs on both sides limit defensibility
Quality investors should measure trips per user, driver utilization rates, and take rate stability as NFX proxies
The checklist: Test for cross-side effects, measure retention curves, check multi-homing behavior, and validate pricing power over time
Why Network Effects Matter for Quality Investors
Network effects are among the most durable moat types in modern business. When they work, each additional user makes the product more valuable for all existing users, creating compounding returns that competitors struggle to replicate.
But here’s the problem: most “network effects” claims are either exaggerated or temporary.
For platforms like Uber, the reality is more nuanced than the narrative suggests. True two-sided marketplace network effects create escalating value as supply and demand both grow, but Uber’s model faces natural constraints that limit this compounding effect.
Quality investors care about this because genuine network effects drive three outcomes critical to long-term value creation: sustainable pricing power, capital-light scaling, and winner-take-most market structures. When ROIC consistently exceeds WACC by 5+ percentage points without requiring proportional reinvestment, strong network effects are often the explanation.
As of LTM (Last Twelve Months), Uber’s ROIC stands at approximately 23%, up dramatically from negative returns just three years ago, but the question remains whether this reflects true moat strength or operational improvement that competitors can replicate.
Where investors go wrong: They confuse growth with network effects. Uber grew to 180 million monthly active users by Q2 2025, but growth alone doesn’t prove defensibility. The critical test is whether marginal users create exponential value for the network or linear value that plateaus.

Core Concepts: Real vs. Claimed Network Effects
Understanding Two-Sided Marketplace Dynamics
Two-sided marketplaces connect distinct user groups—riders and drivers in Uber’s case—where value is created through balanced participation from both sides. The theory suggests a virtuous cycle: more riders attract more drivers, which lowers wait times, attracting even more riders, and so forth.
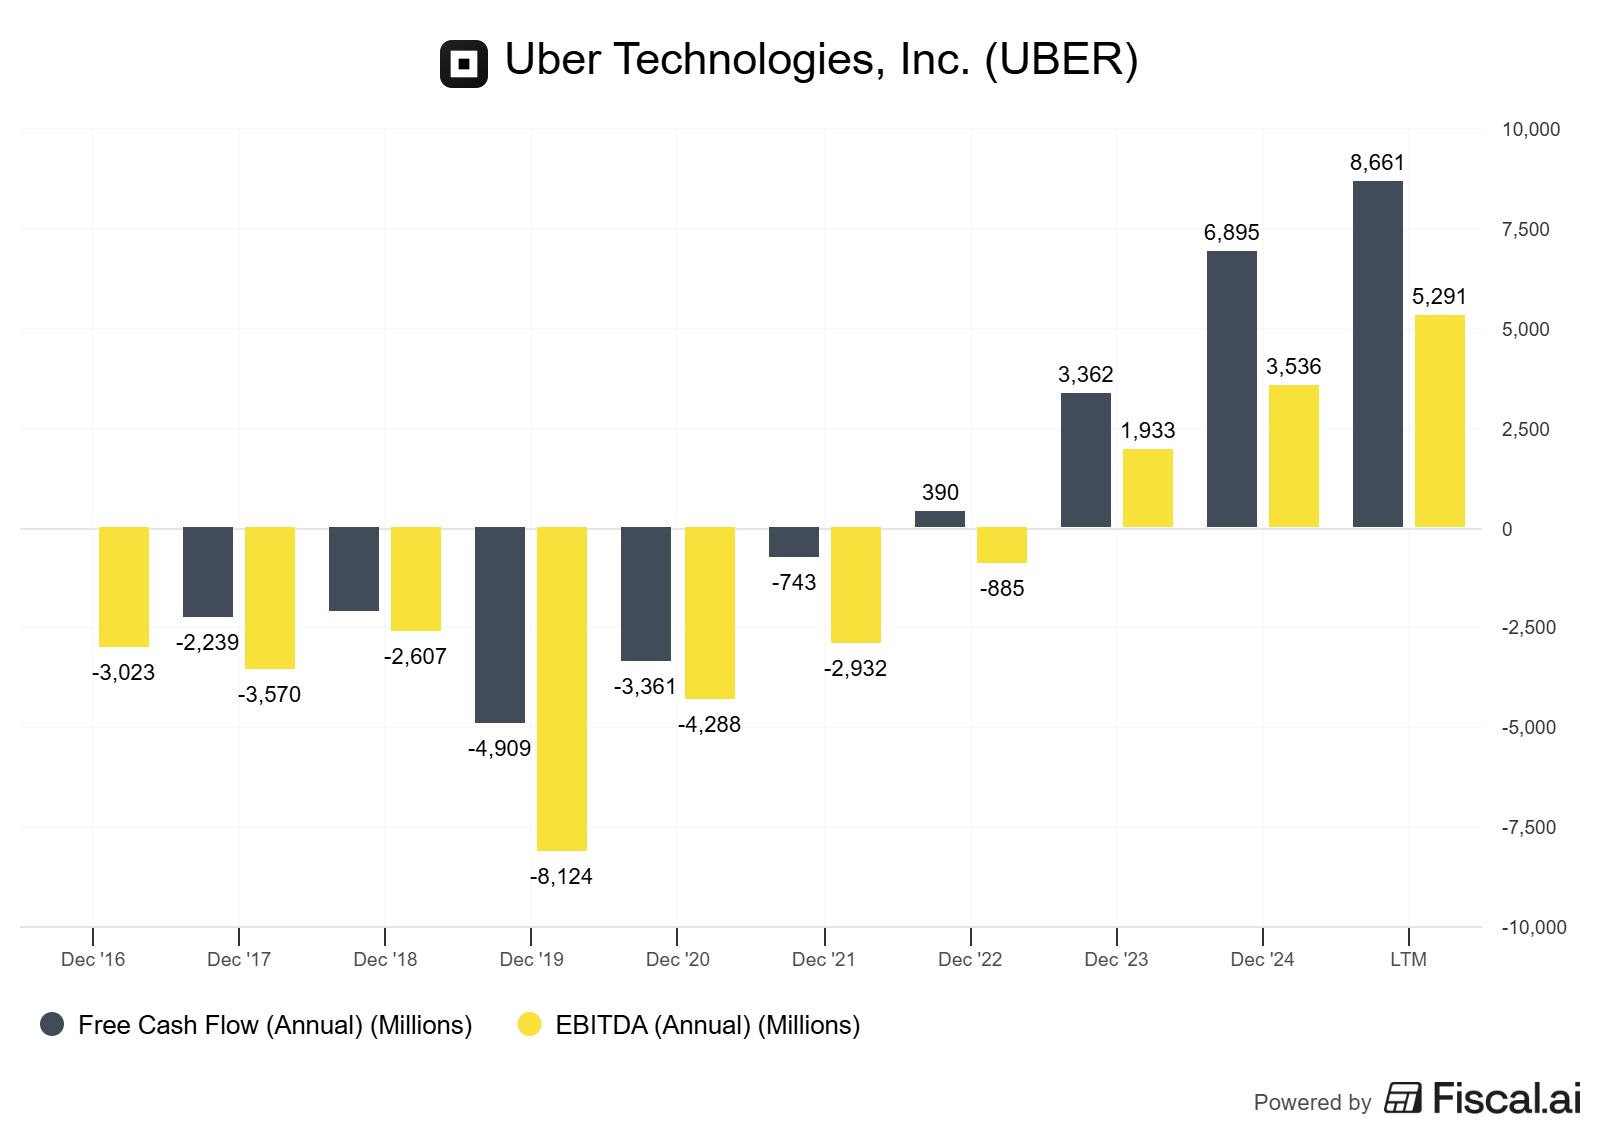
The ROIC lens: True network effects should manifest in expanding margins and capital efficiency as the network scales. Uber’s Q4 2024 results showed Adjusted EBITDA of $1.8 billion, up 44% year-over-year, with free cash flow reaching $1.7 billion. This improvement signals operational leverage, but we need to separate network effects from other sources of efficiency.
The Asymptote Problem
Uber’s network effects hit an asymptote much earlier than true marketplaces because wait times can’t go below zero. The difference between zero minutes and 3-4 minutes is negligible from a utility perspective, meaning additional drivers beyond the critical mass needed to achieve 4-minute pickups deliver steeply diminishing returns.
Evidence: You’d need to double the driver fleet to halve wait times from 4 minutes to 2 minutes. This is the mathematical reality that limits Uber’s supply-side network effect strength.
Result: Unlike eBay or Airbnb, where more supply creates exponentially more selection and value, Uber reaches a practical equilibrium quickly in each geographic market.
Reinvestment Runway and Capital Intensity
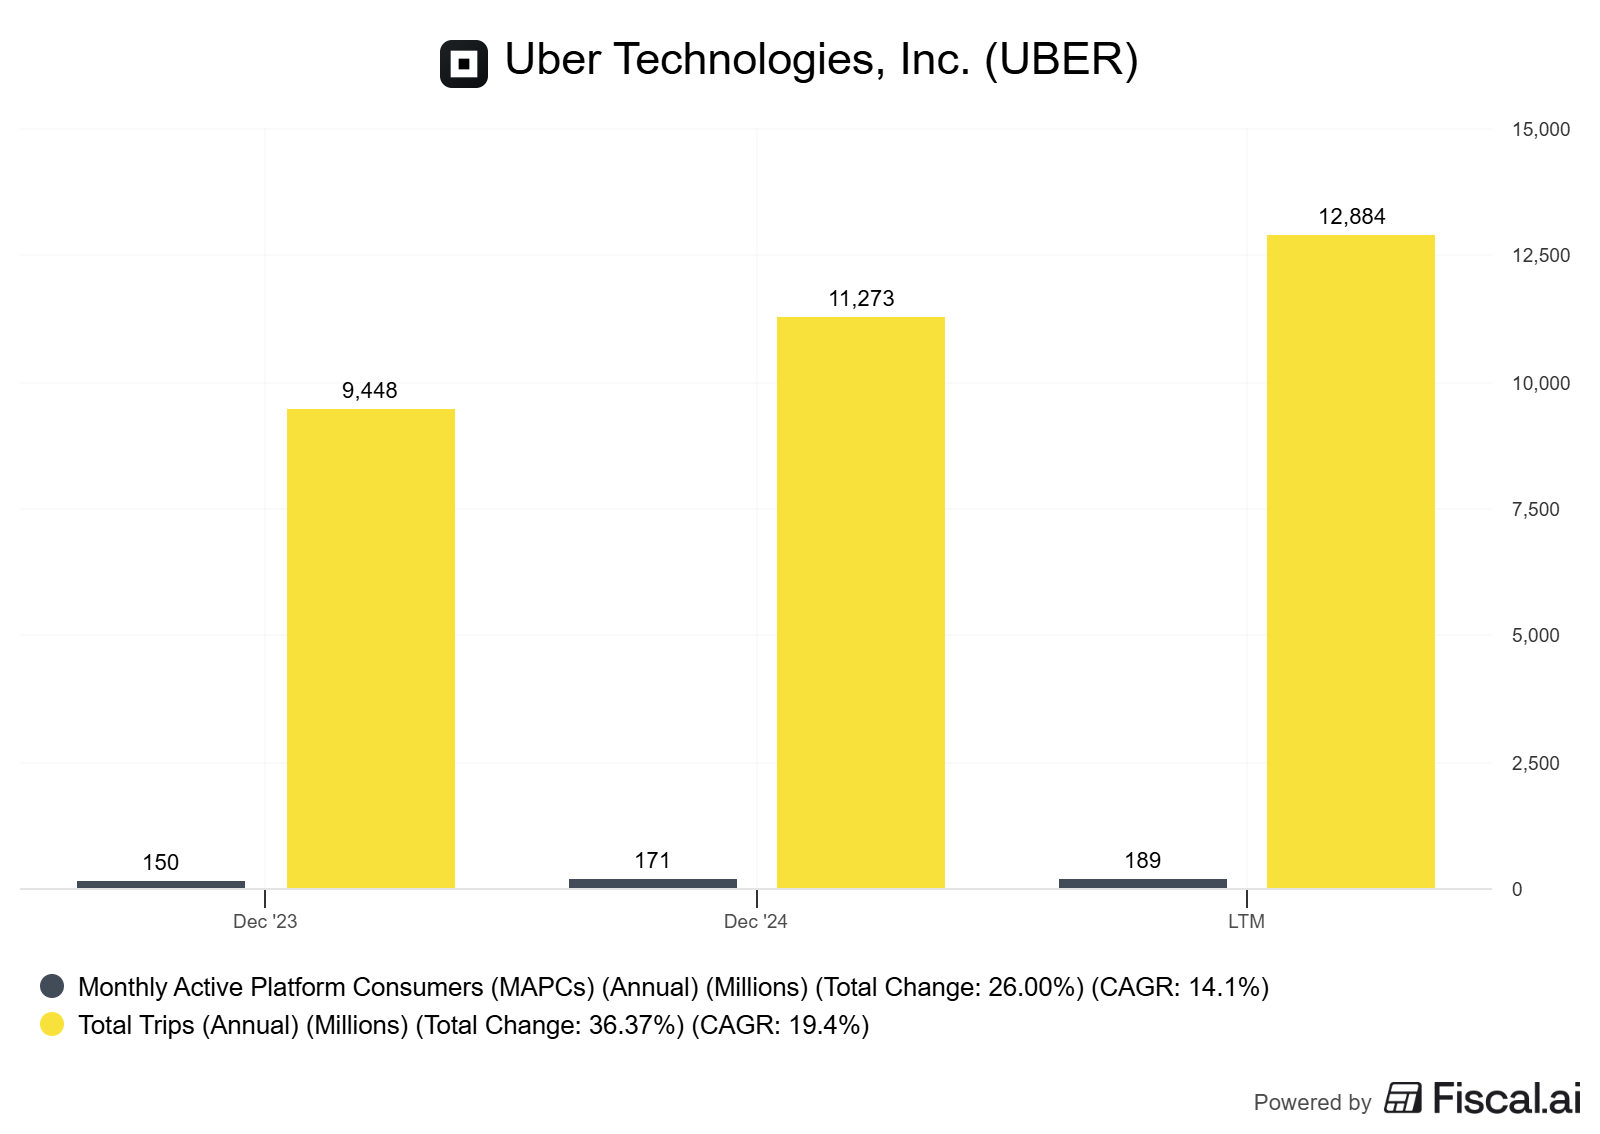
Quality investors want businesses that can redeploy capital at high incremental returns. Uber completed 11.27 billion trips in 2024, but this volume required sustained incentive spending to both sides of the marketplace. The company spent years burning cash before reaching profitability, suggesting that network effects alone weren’t sufficient to create a self-sustaining flywheel.
Capital allocation scorecard: Uber has reduced incentive intensity as the network matured, shifting from growth-at-all-costs to profitable expansion. The company generated $4.2 billion in free cash flow for 2024, demonstrating improved capital discipline. The question is whether this reflects stronger network effects or simply more rational competitive behavior after Lyft’s market share stabilized.
Per-Share Value Creation
Network effects should compound per-share value through operating leverage, not just gross metrics. Uber’s monthly trips per active user stood at approximately 6 trips in Q4 2024, up from 5.4 a year prior. This frequency increase suggests strengthening engagement that could reflect genuine network effects—more liquidity makes the platform more useful for repeat usage.
The Uber Case Study: What Strong-But-Limited NFX Look Like
The Financial Reality
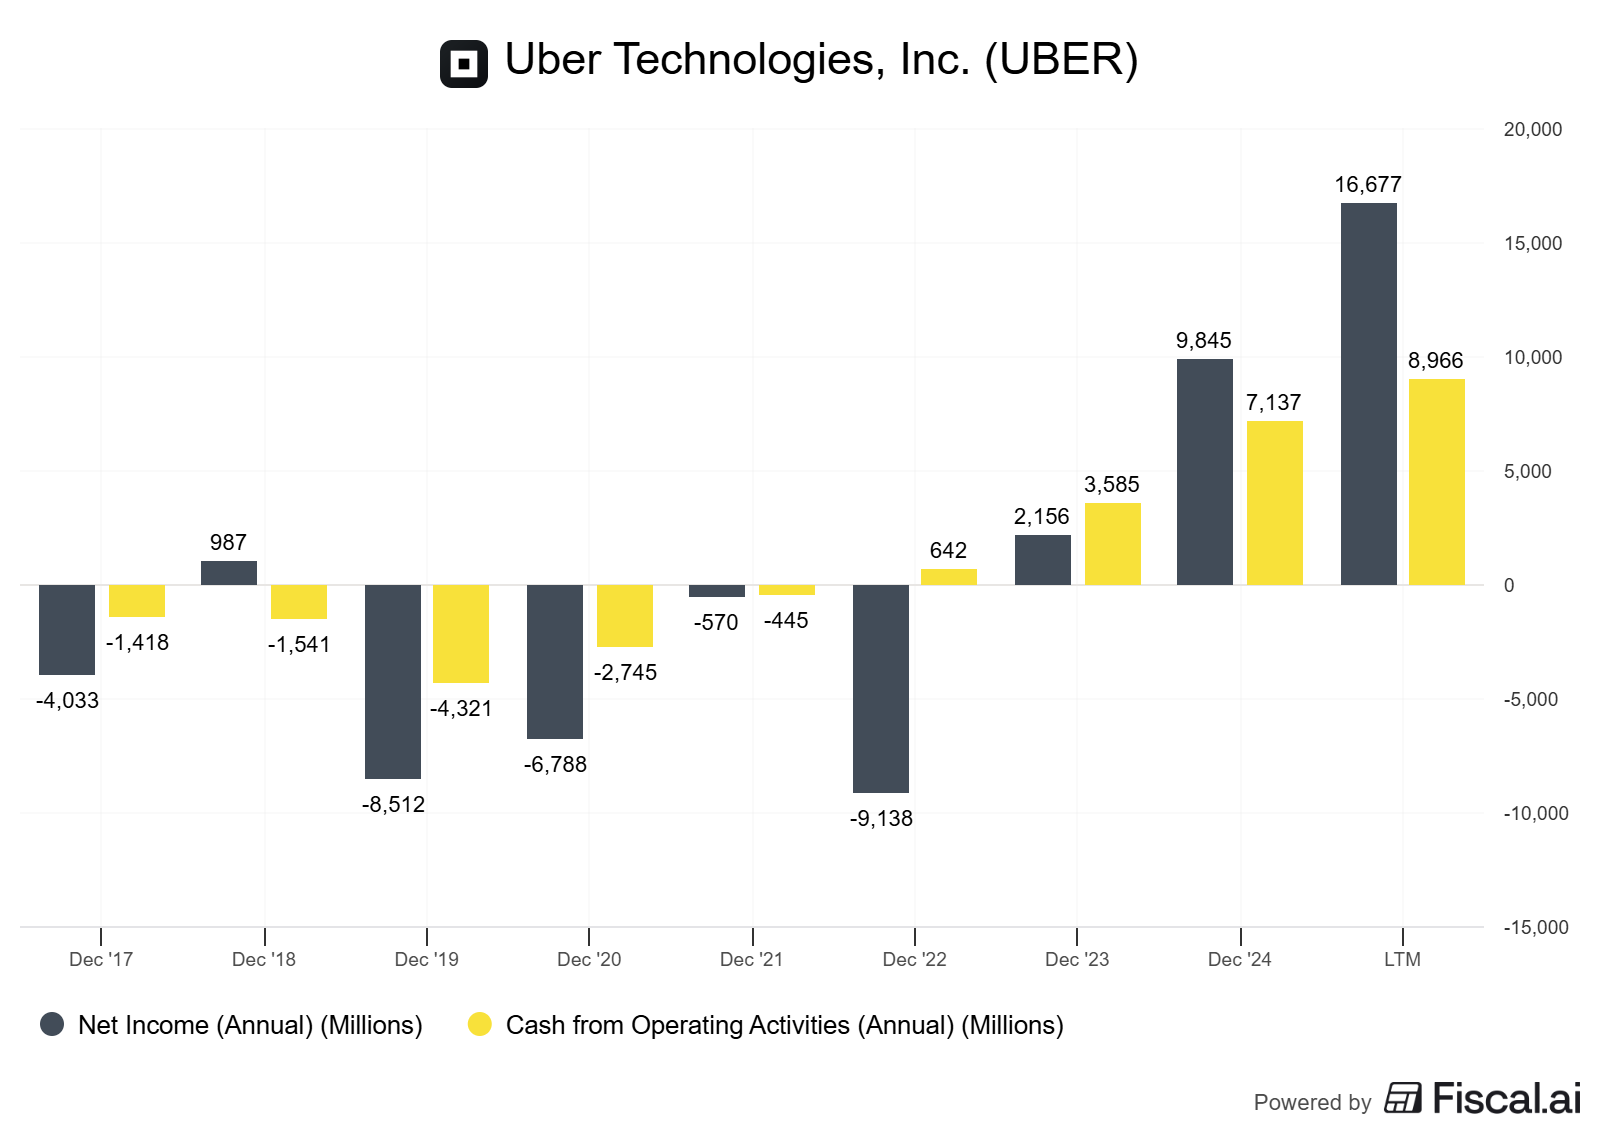
Uber turned a profit for the first time in 2023, 15 years after its founding. Net profits reached $1.88 billion on revenues of over $37 billion in 2023, compared to a net loss of $9.14 billion in 2022. For 2024, revenue grew to $43.97 billion, an 18% year-over-year increase.
ROIC trend: The company’s return on invested capital journey tells the network effects story. Moving from deeply negative returns in the 2018-2021 period to 23.5% ROIC as of September 2025 represents a dramatic improvement. And with a WACC of 8.6%, Uber generates returns well above its cost of capital, suggesting that network effects translate into value creation.
Margin Expansion and Operating Leverage
Uber Mobility had a 28.8% take rate in 2023, while the Delivery platform (Uber Eats) showed a 19.15% take rate in the same period. These take rates represent the percentage of gross bookings that Uber retains as revenue after paying drivers and restaurants.
What this reveals: The 9+ percentage point difference between Mobility and Delivery take rates suggests that the Mobility business has stronger pricing power, potentially indicating more durable network effects. Riders face higher switching costs due to habit and brand recognition, while restaurants and customers in delivery face more competition.
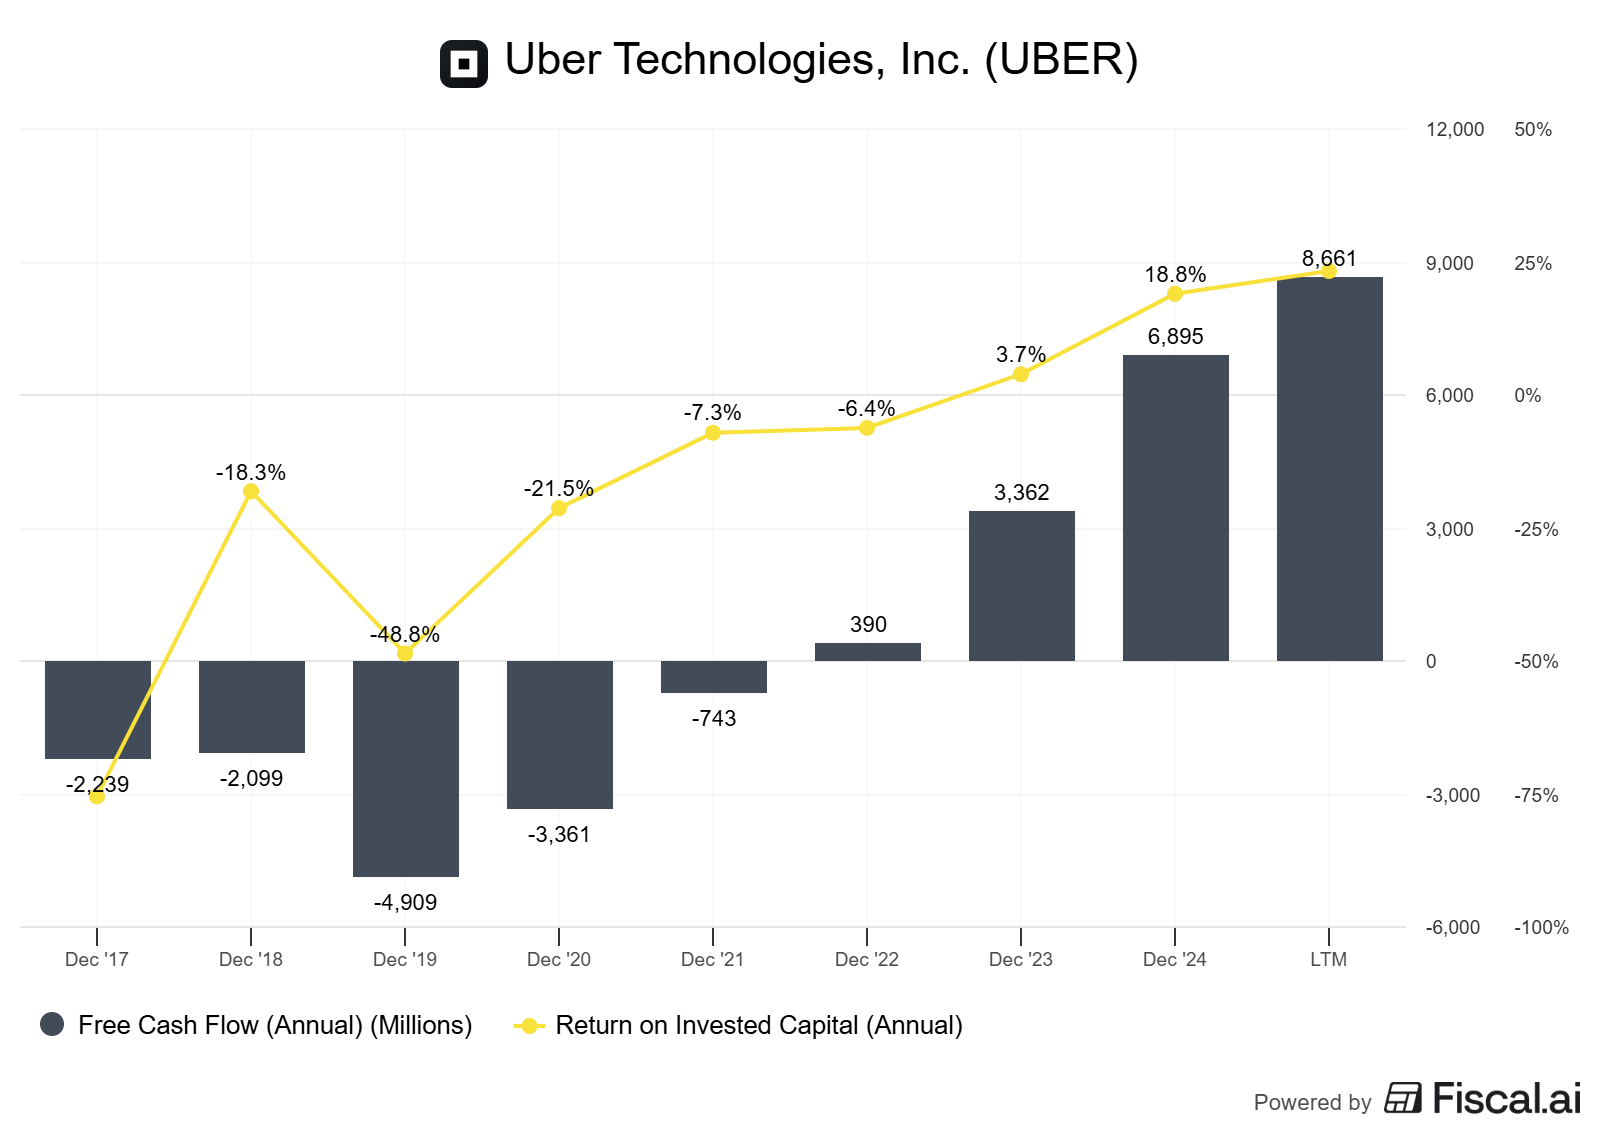
Interpretation: Improving ROIC and expanding margins suggest genuine operating leverage, but the absolute level of ROIC remains near the WACC, indicating that network effects provide an advantage without creating dominant economics. This is consistent with asymptotic network effects—real but limited.
Geographic Density as the Real Moat
Uber is actually a collection of hundreds of hyperlocal two-sided marketplaces, not one global network. Each city operates as a distinct marketplace with its own network effects driven by pickup times, coverage density, and driver utilization.
The implication: Network effects exist at the city level, creating local moats that make it hard for new entrants to displace Uber in established markets. However, this structure also means that national or global scale doesn’t automatically translate to defensibility in new markets.
Evidence from market share: Uber maintains a 76% share of the US rideshare market as of March 2024, but this dominance hasn’t extended equally worldwide. In many international markets, regional players like Grab (Southeast Asia), DiDi (China), and Ola (India) maintain strong positions, demonstrating that Uber’s network effects don’t create insurmountable global barriers.
The Driver-Side Weakness
Drivers, unlike riders, have every incentive to carefully and rationally consider which platform to drive on. Drivers often operate on multiple platforms simultaneously, using multiple phones to act as price mercenaries between Uber and Lyft.
Why this matters: True network effects create switching costs on both sides of the marketplace. Uber has successfully created switching costs for riders through brand, habit, and payment information, but the driver side remains fluid. This asymmetry limits the compounding nature of the network effect.
Quantifying the effect: Uber had 8.8 million drivers and couriers in Q2 2025, representing 12% year-over-year growth. Steady driver growth suggests Uber can maintain supply, but the multi-homing behavior means competitors can also access similar supply pools.
The Membership Flywheel
One genuine network effect strengthening mechanism: subscription programs. Uber had over 36 million Uber One members as of June 2025, accounting for over 40% of gross bookings. Members show higher retention and frequency, creating a stickier user base that reinforces local liquidity.
Decision rule: Look for subscription penetration rates above 30% of GMV as evidence that a marketplace is building genuine lock-in beyond basic network effects.
The Uber Network Effects Loop: (1) More riders → (2) Higher earnings potential → (3) More drivers → (4) Lower wait times (up to 3-4 min floor) → (5) Better utilization → (6) Price competitiveness → Back to (1)]
Your Network Effects Checklist
When evaluating any two-sided marketplace or platform business, work through these tests systematically:
Test 1: Cross-Side Value Creation Does adding a user on one side measurably increase value for users on the other side? For Uber, adding riders clearly benefits drivers (more earnings opportunities), and adding drivers benefits riders (shorter wait times). But the second effect plateaus quickly.
Test 2: Marginal User Value Plot the value created by the 1,000th, 10,000th, 100,000th, and 1,000,000th user. True network effects show accelerating or linear value curves. Asymptotic effects (like Uber) show logarithmic curves that flatten.
Test 3: Retention Cohort Analysis Do older cohorts show higher retention than newer cohorts? Network effects should improve retention over time as the network becomes more valuable. Uber One members demonstrate this, but baseline users show more typical retention curves.
Test 4: Multi-Homing Behavior What percentage of users use only your platform versus multiple platforms? Only 12% of riders use both Uber and Lyft, suggesting strong single-homing on the demand side. Driver multi-homing is much higher, creating asymmetry.
Test 5: Pricing Power Over Time Can you raise take rates or prices without losing share? Uber’s take rates have remained relatively stable, suggesting limited pricing power beyond competitive equilibrium levels.
Test 6: Geographic Density Economics Do unit economics improve with density within a market? Map EBITDA margin or contribution margin by market maturity. Uber shows this clearly—mature markets generate positive margins while new markets burn cash.
Test 7: Cold Start Difficulty How hard is it for a competitor to launch in a new city? Uber’s success in expanding to 10,000 cities suggests lower barriers than ideal, though incumbency provides real advantages in established markets.
How to Run This Analysis Yourself
Step 1: Gather the Core Data
Start with the company’s investor relations site. Download the last 5-10 quarters of earnings presentations and 10-K/10-Q filings. You need:
User metrics: Monthly active users, trips/transactions per user, new vs. repeat user splits
Financial metrics: Revenue, gross bookings/GMV, take rate trends, EBITDA margins by segment
Capital metrics: ROIC, ROIC-WACC spread, free cash flow, reinvestment rates
Cohort data: Retention curves by vintage if disclosed (rare but valuable)
Where to find it: Investor.uber.com for Uber; most public companies have similar IR portals. Supplement with Capital IQ, Bloomberg, or free alternatives like Koyfin for historical trends.
Step 2: Calculate Key Network Effect Proxies
Trips per active user: Total trips ÷ monthly active users. Rising trends suggest increasing platform utility.
Take rate stability: Revenue ÷ gross bookings. Stable or rising rates indicate pricing power from network effects. Falling rates suggest competitive pressure.
Geographic margin variance: Compare EBITDA margins across mature vs. emerging markets. Large differentials confirm that density creates local moats.
Driver utilization: Hours with riders ÷ total logged hours. Improving utilization indicates better matching efficiency from scale.
Step 3: Build the ROIC Framework
Calculate trailing-twelve-month ROIC using: Operating Income × (1 - Tax Rate) ÷ (Total Debt + Total Equity - Cash). Compare to WACC.
Decision threshold: Prefer companies with a sustained ROIC-WACC spread above 5% over multiple years. Network effects strong enough to create value show up here.
For Uber specifically, the improving but still modest spread suggests the network effects are real but not dominant.
Step 4: Map the Competitive Landscape
Document market share trends over 3-5 years. True network effects should exhibit winner-take-most dynamics as concentration increases.
Uber’s reality: US market share peaked at 91% in 2015 and is currently around 76%. This stabilization suggests network effects create an advantage but not total dominance—consistent with asymptotic effects.
Step 5: Test Alternative Explanations
Before attributing improvements to network effects, rule out:
Industry tailwinds (regulatory changes, competitor exits)
Operational improvements (better pricing algorithms, reduced waste)
Accounting changes or one-time items
Market maturity effects (easy growth harvested first)
Example: Much of Uber’s recent profitability improvement comes from reducing incentive spending and improving driver-rider matching algorithms—operational excellence rather than pure network effects.
Pitfalls and False Positives
Growth Is Not a Network Effect
The most common mistake is conflating growth with network effects. Uber grew explosively, but much of that came from geographic expansion, category creation, and heavy subsidies—not compounding network dynamics.
How to avoid: Separate same-market cohort improvements from new market additions. Only the former indicates network effects.
Scale Effects vs. Network Effects
Uber benefits tremendously from scale: better pricing algorithms, more data for matching, brand recognition, and supplier negotiating power. These are scale effects, not network effects. The distinction matters because scale effects are more easily replicated by well-funded competitors.
Red flag: If the “network effect” story relies heavily on data, machine learning, or operational efficiency, you’re probably looking at scale effects.
Ignoring Multi-Homing
Platforms with low switching costs and high multi-homing have weak network effects regardless of absolute scale. Uber’s driver multi-homing fundamentally limits its moat strength.
Test: If a competitor launches with 80% of your liquidity, do users switch? For Uber, many would. For Facebook circa 2012, almost none would have.
Mistaking Temporary Lock-In for Network Effects
Payment information storage, habit, and inertia create switching costs, but these aren’t network effects. Network effects specifically require that value increases as more users join, not just that leaving is inconvenient.
Uber example: Riders stick with Uber partly because their credit card is saved and they know the interface. That’s valuable but different from the network being more useful because there are more riders.
Overlooking Asymmetric Network Effects
Many marketplaces have strong network effects on one side and weak effects on the other. Uber demonstrates this clearly: riders show genuine network-driven loyalty, while drivers remain mercenary. This asymmetry caps the overall moat strength.
<a name=”one-pager”></a>
Checklist: Evaluating Network Effects in 60 Seconds
Cross-side effects: Does adding supply measurably improve demand-side experience? Test this directionally.
Retention curves: Do older user cohorts show higher retention than newer ones?
Take rate trends: Are take rates stable or rising over 3+ years?
ROIC trajectory: Is ROIC-WACC spread positive and expanding?
Multi-homing rate: Do users single-home on your platform (good) or use multiple platforms (bad)?
Glossary
Asymptotic Network Effects: Network effects that provide real value but hit diminishing returns quickly, reaching a plateau rather than compounding indefinitely.
ROIC (Return on Invested Capital): Operating income after tax divided by total capital deployed; measures how efficiently a company converts capital into profits.
Take Rate: Percentage of gross marketplace volume retained as revenue; indicates pricing power and unit economics in platform businesses.
Multi-Homing: Behavior where users simultaneously use multiple competing platforms; indicates weak switching costs and limited network lock-in.
Cross-Side Network Effects: Value created when adding users on one side of a marketplace benefits users on the other side.
MAPC (Monthly Active Platform Consumer): Uber’s term for unique users who complete at least one transaction per month.
Hyperlocal Marketplace: Platform where network effects operate within specific geographic boundaries rather than globally.
FCF Conversion: Free cash flow as a percentage of net income; indicates capital efficiency and quality of earnings.
Further Reading
NFX’s Network Effects Map - Comprehensive taxonomy of network effect types (April 2022)
Andrew Chen’s Uber Analysis - Deep dive on Uber’s geographic density dynamics
Platform Thinking Labs on Uber - Analysis of Uber’s feedback loops (August 2023)
Bill Gurley’s Marketplace Frameworks - Classic essay on marketplace quality factors
Educational content, not investment advice. All data is current as of the dates cited. Network effects analysis requires ongoing monitoring as competitive and regulatory environments evolve.