

Members, the top three are below. If you're not one yet, you get seven picks and the full two minute safety check for free, including the coverage number that tells you whether a 12% payout is income or a trap.
If you were screening for high-yield companies and saw a 10% yield, it used to mean the company was broken.
In 2026, you can build a basket of ten dividend payers averaging around 7.7%, with most of them raising their payouts this year. The Fed’s cutting cycle is helping some and squezing others. Which makes right now a good time to sort the durable yields from the traps.
In today’s post, we will discuss:
A two-minute safety check for any high yield, using one coverage number per asset type
My top 10 high yield picks for 2026, ranked from 10 to 1
The one metric each pick teaches you, so by the end you can run this screen yourself
The catch in every name, because there is no free lunch on Wall Street.
Okay, let’s dive in and count them down.
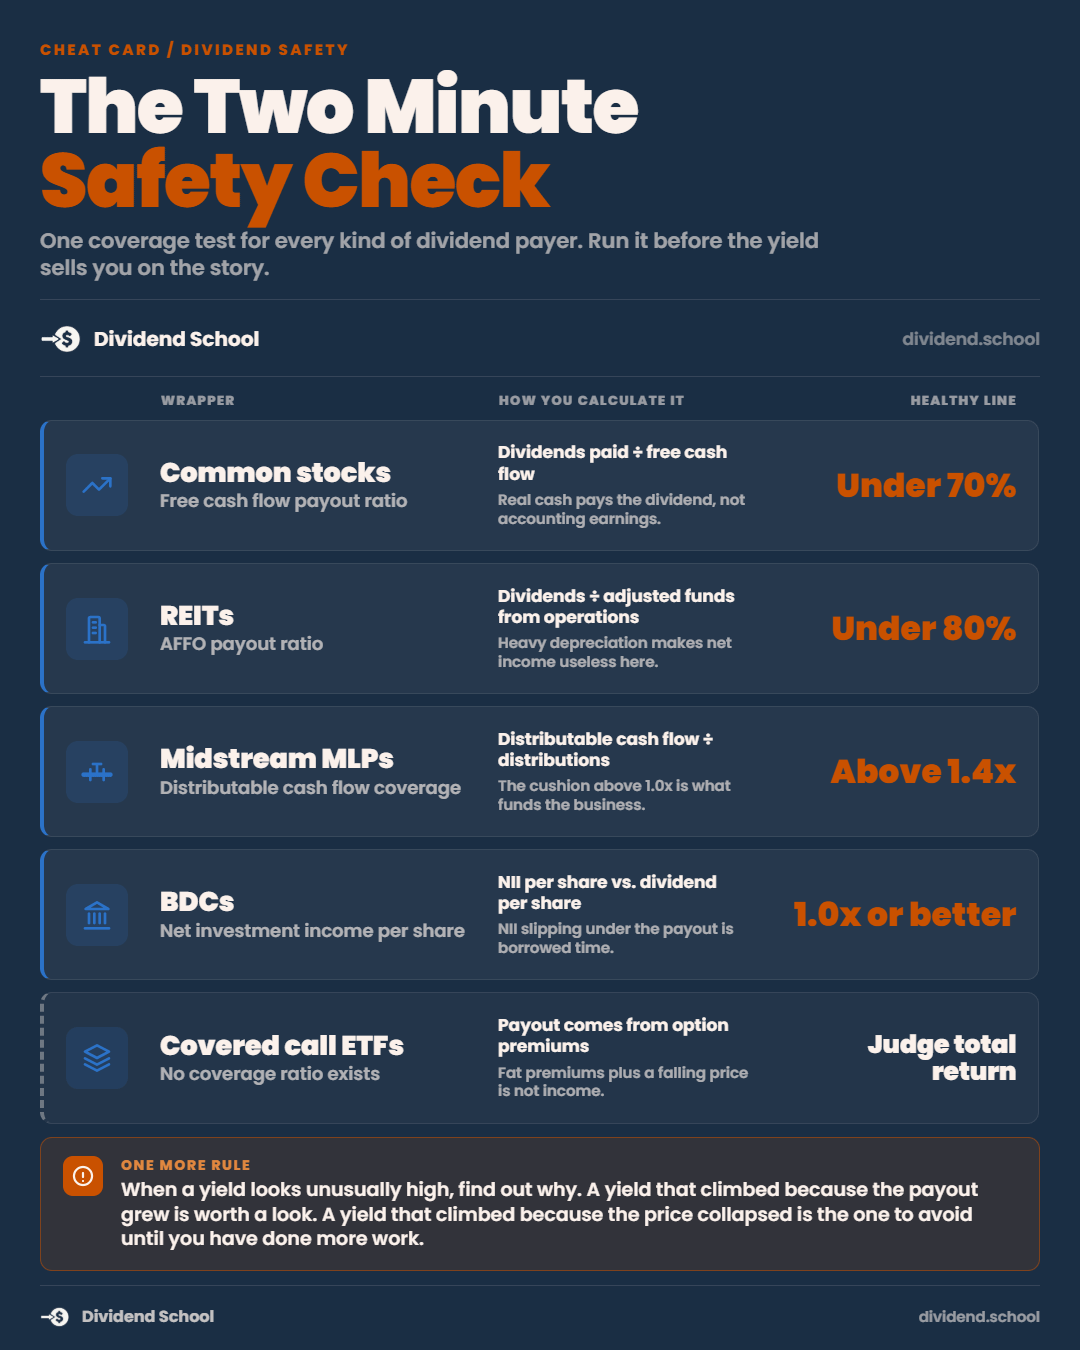
Two Minute High Yield Safety Check
High yield investments come in different flavors, and each flavor has its own coverage math. We can’t judge one company against another without accounting for the business model. You can’t look at pizza and judge it next to hard-boiled eggs. First yuck, and then not a fair comparison.
Here is the cheat sheet we will use across the board on our list:
Common stocks: free cash flow payout ratio (dividends paid ÷ free cash flow). I want under 70%.
REITs: AFFO payout ratio (dividends ÷ adjusted funds from operations). Under 80% is healthy.
Midstream MLPs: distributable cash flow coverage (DCF ÷ distributions). Above 1.4x is comfortable.
BDCs: net investment income per share versus the dividend. NII needs to cover the payout.
Covered call ETFs: there is no coverage ratio. The payout comes from option premiums, so you judge total return.
One more rule before we start. When a yield looks unusually high, check whether the yield is high because the payout grew or because the price collapsed. The second kind is the one we want to avoid without more work done.
Now, the list.
#10: NEOS S&P 500 High Income ETF (SPYI), ~12.0% distribution
The highest payout on this list lands in last place, and for a good reason.
SPYI holds the S&P 500 and sells index call options against it, then pays the premium out as a monthly distribution. That payout is funded by options income, and a large share of it has been classified as return of capital. A dividend from Coca-Cola comes out of profits. This comes out of a strategy, and the strategy caps your upside in strong markets.
Here is the 2026 scorecard so far:
Distribution rate: 12.04%
2026 total return through early August: +10.7%
S&P 500 total return over the same stretch: +14.0%
Expense ratio: 0.68%
Full credit were due, SPYI buys back call spreads to retain some upside, which is why it earned about 3/4 of the market’s gain while competitor JEPI earned less than half. The SPX options all get a 60/40 tax treatment, making this one of the more tax-friendly funds, and an overlooked benefit.
The lesson: the distribution and the dividend get funded from different engines. And the engine drives both the tax treatment and how the payout behaves during a downturn.
The catch: The tax bill comes due someday, and your return of capital lowers your cost basis, so today’s income impacts the future tax bill.
#9: Altria (MO), 6.35% yield
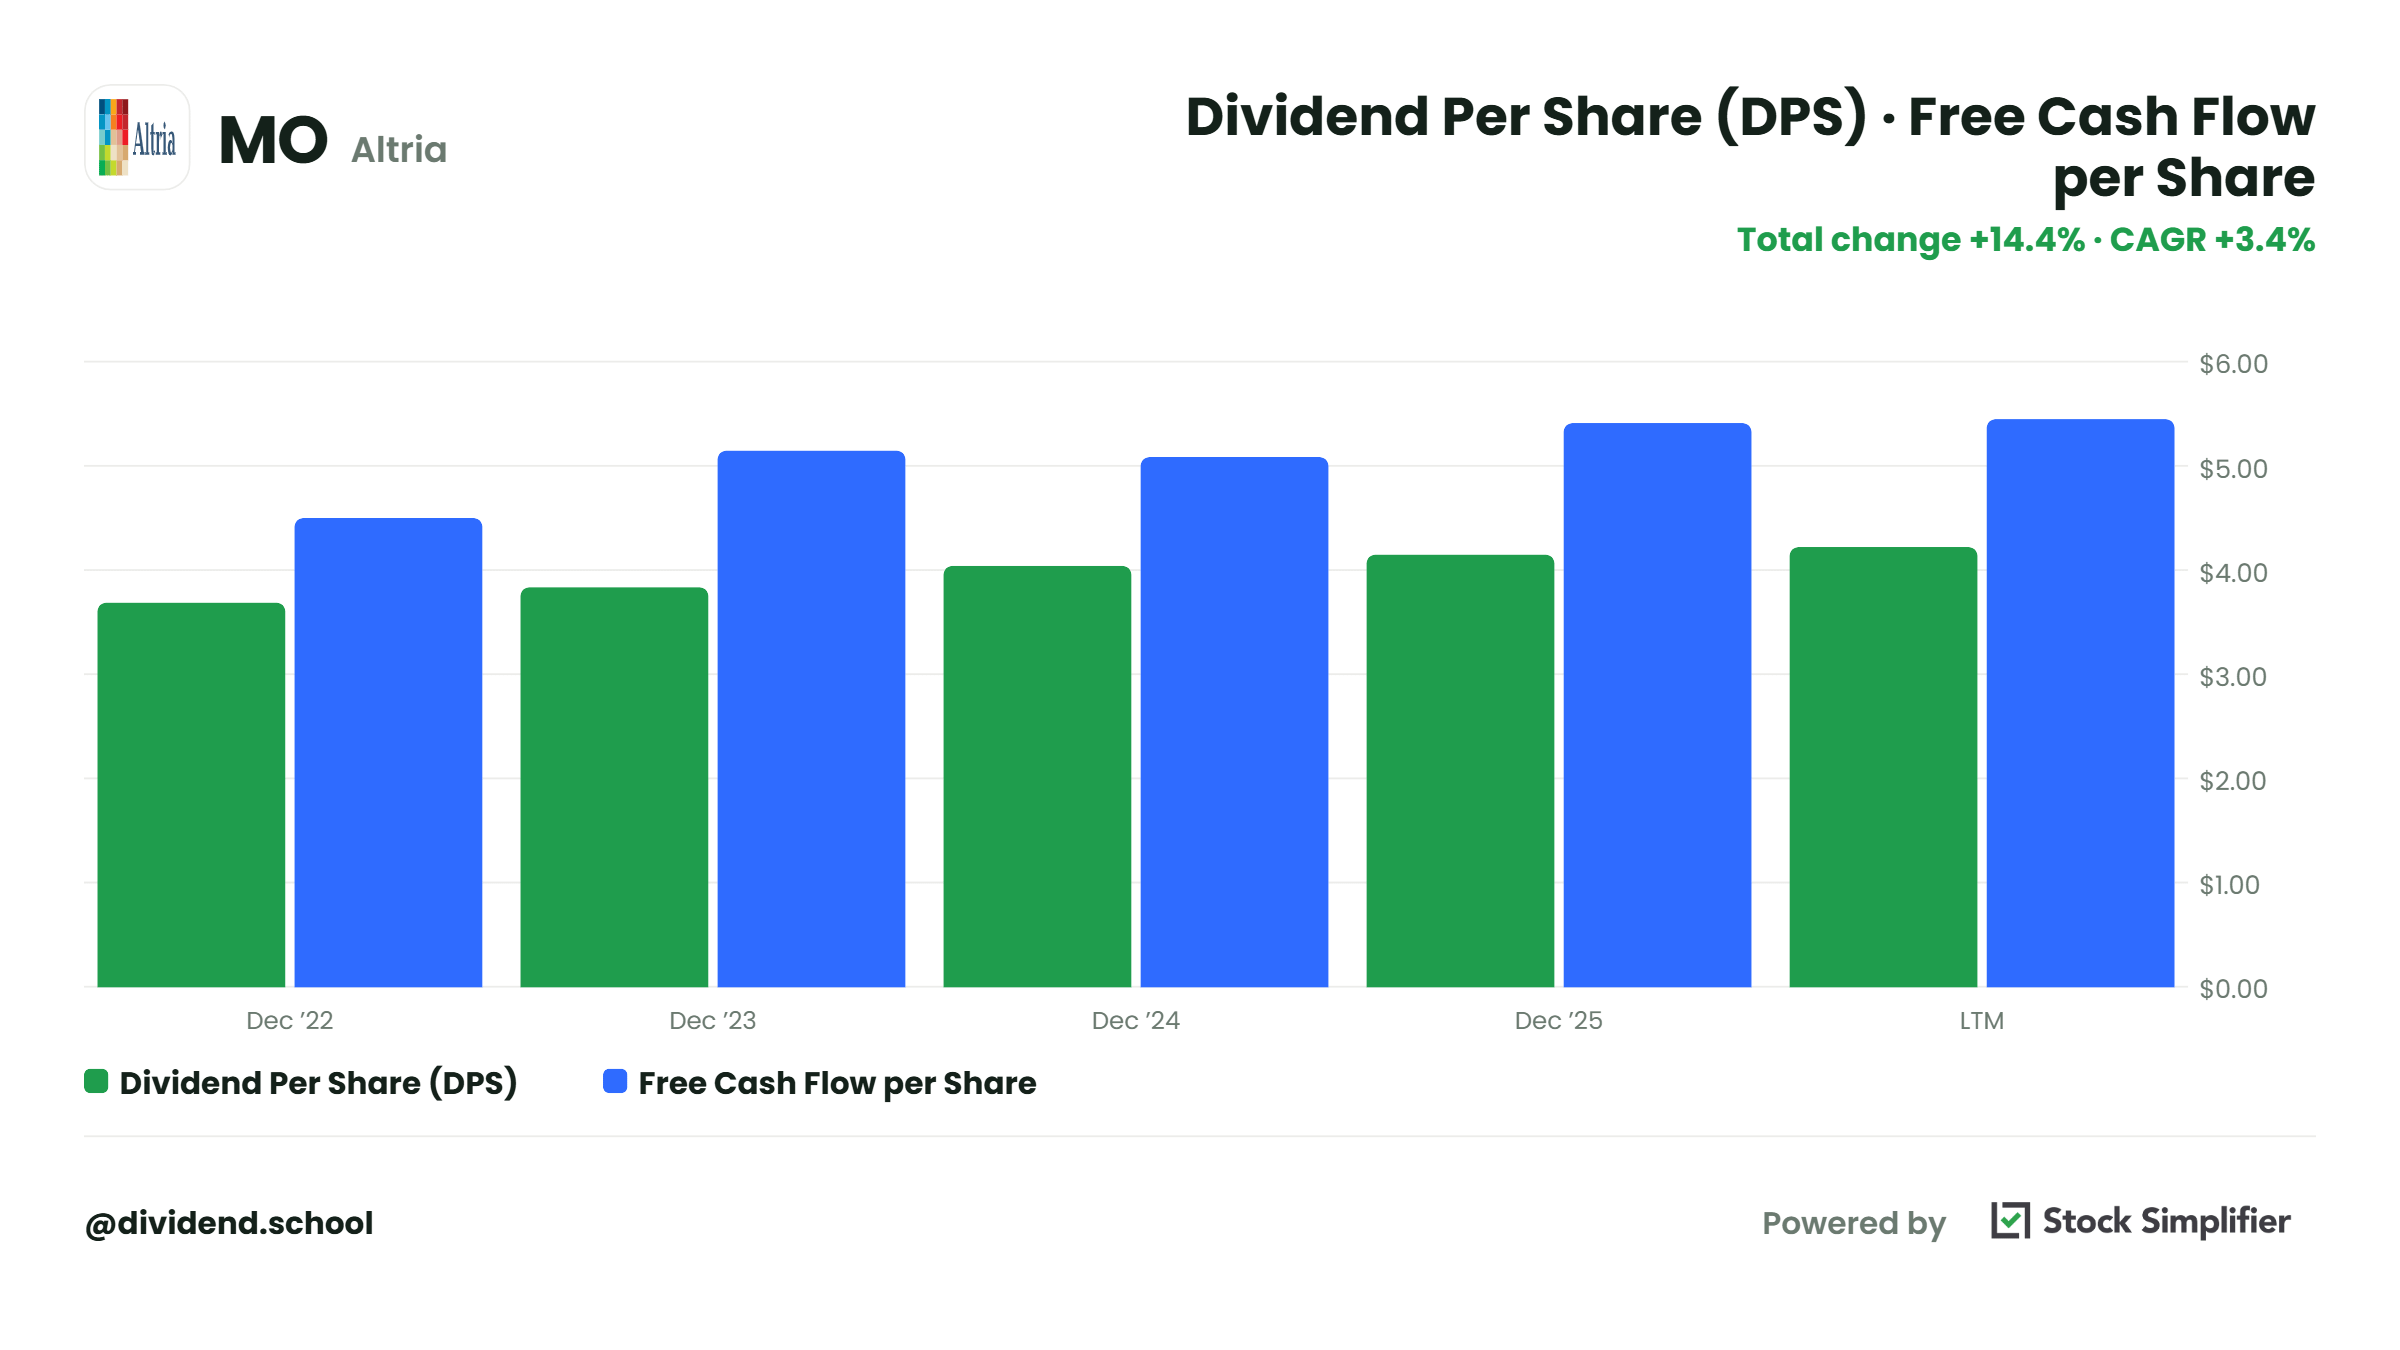
Altria has been on the struggle bus for years as smoking has lost its allure, at least here in the US. Despite the business slowing, the company continues to pay a growing dividend with a high yield.
57 straight years of dividend increases, and the company raised it again in June 2026, to $1.06 per quarter. The free cash flow payout ratio math still meets standards despite the revenue slowing to -0.9% over the past three years.
2026 adjusted EPS guidance: $5.61 to $5.72 (raised at Q2)
Annual dividend: $4.24
Annual free cash flow per share: $5.46
FCF payout ratio: roughly 78%, right at management’s 80% target
What keeps driving the business is pricing power. Altria raises prices faster than volumes decline. Cigarette shipments fell 3.2% last quarter, yet adjusted EPS grew 2.8%. And the on! nicotine pouch business is also taking share, now 8.6% of the category.
The lesson: The free cash flow payout only means something when the company continues to generate profits. And Altria’s holds right now because their pricing power outruns the decline in volumes. This works until it doesn’t, which is why it is #9 on the list.
The catch: we are betting on the decline remaining slow and steady. Watch shipment trends every quarter.
#8: Realty Income (O), 5.25% yield
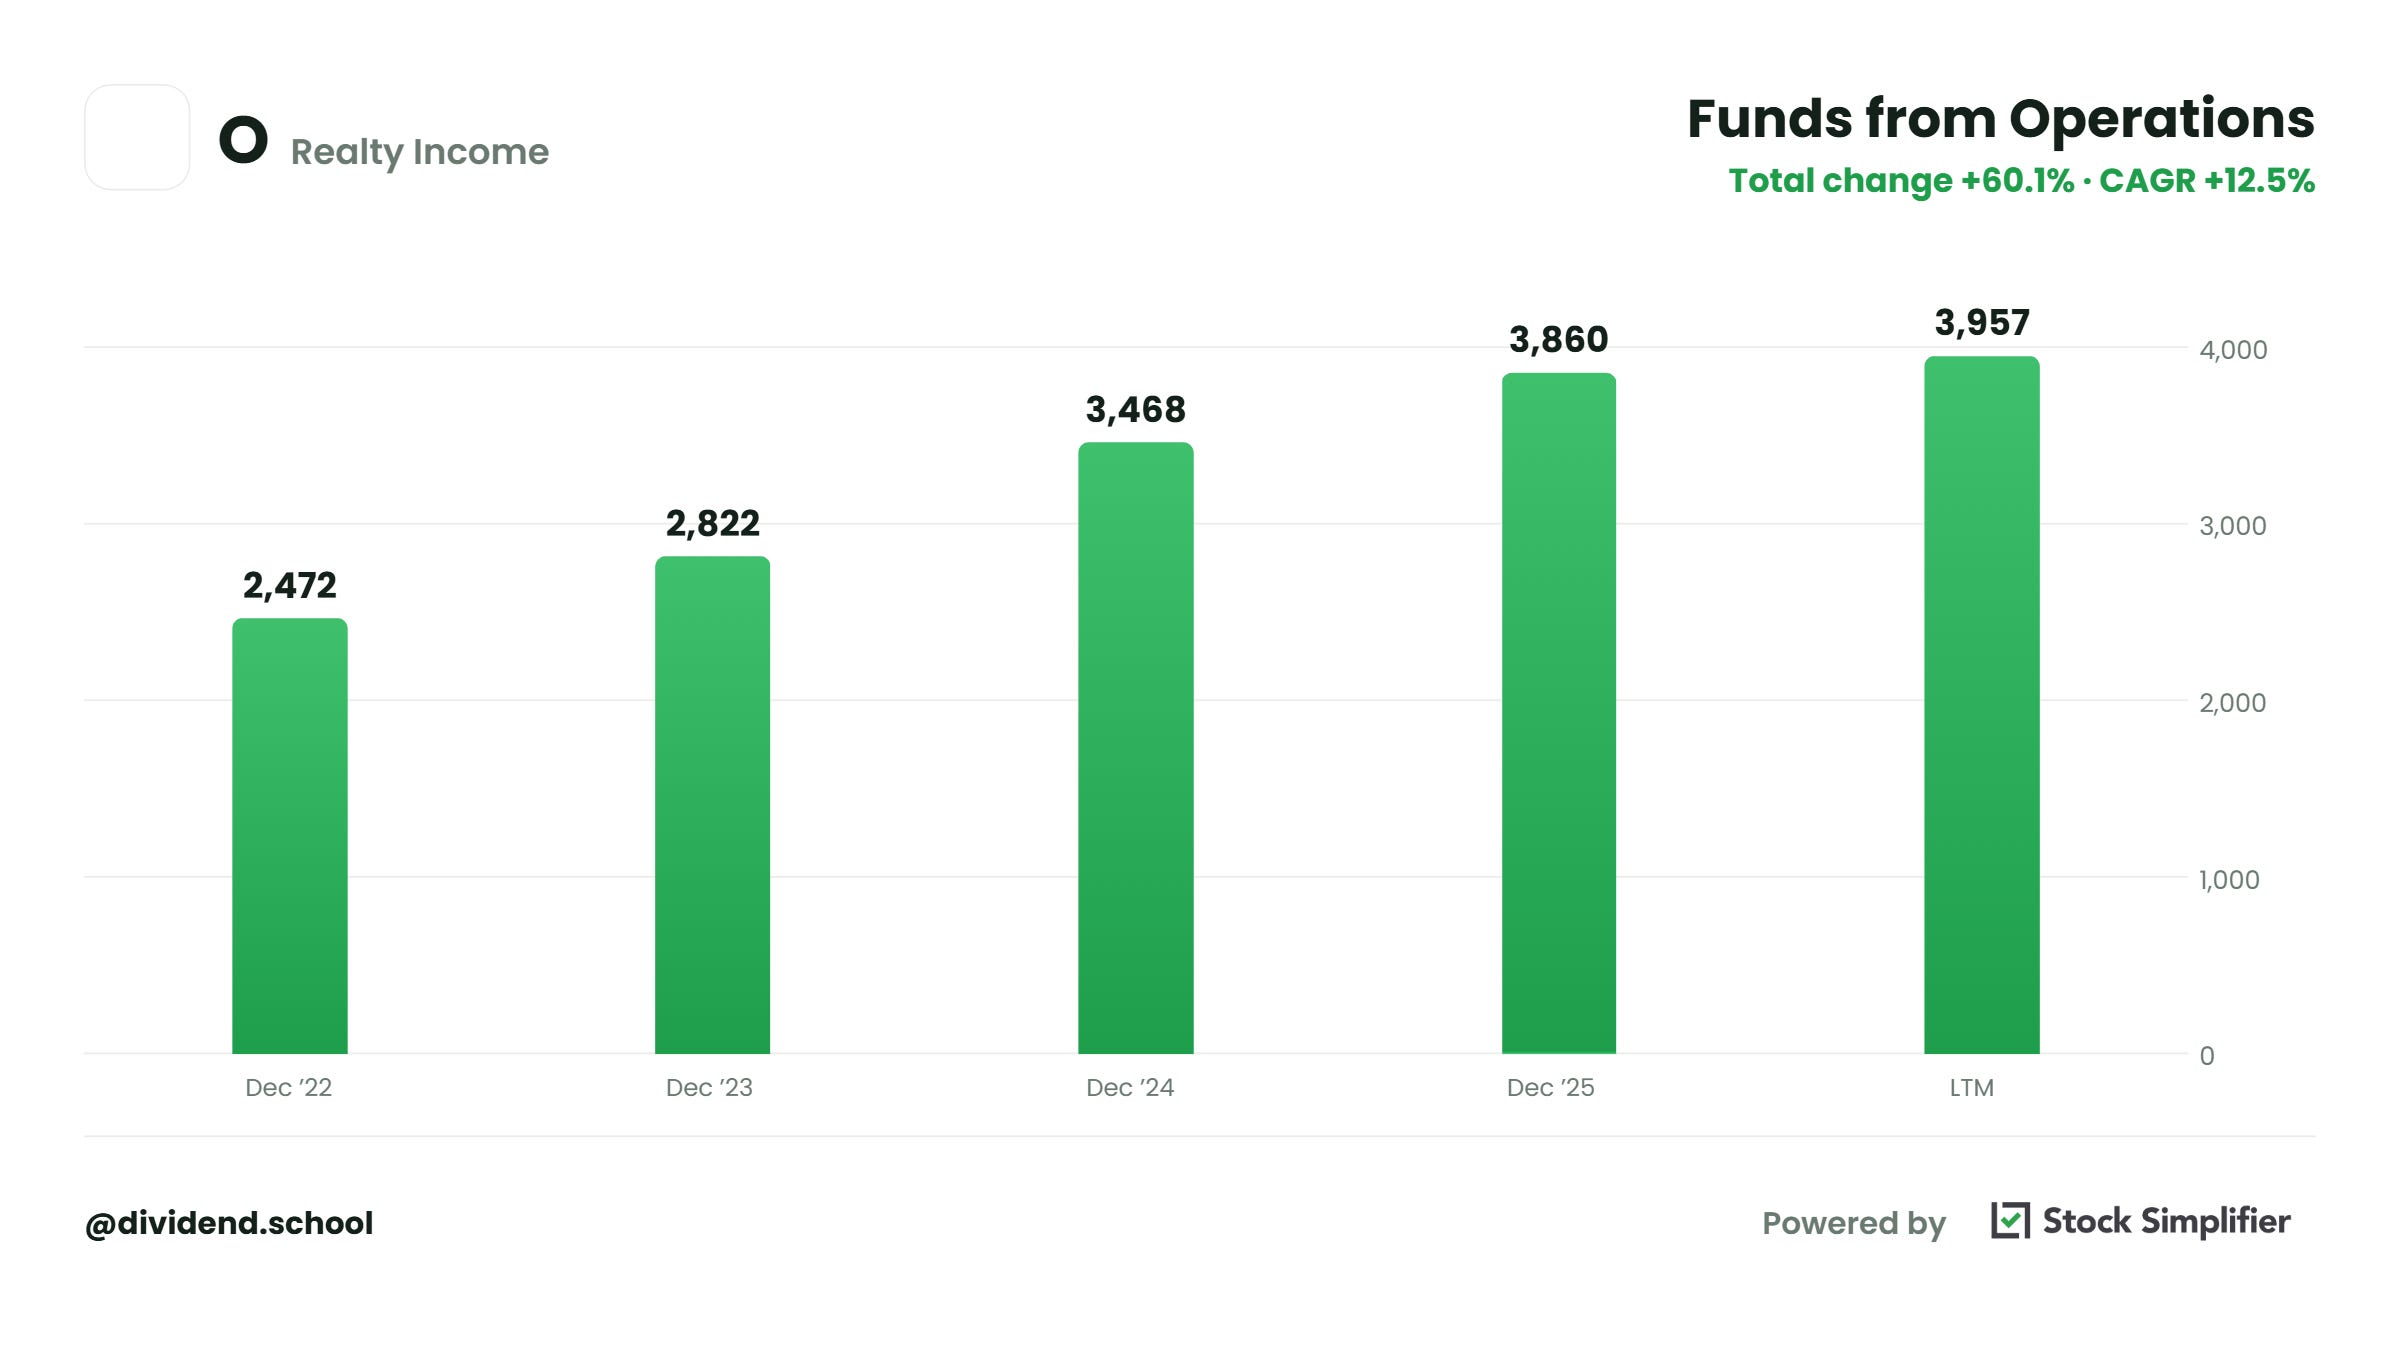
Realty Income (which we own, full disclosure) has paid 673 consecutive monthly dividends and raised its payout for 31 years since its IPO in 1994.
New investors look at REIT payout ratios against earnings and ask, what? Keep in mind, depreciation crushes REIT paper earnings while their buildings continue to collect rent. This is why we AFFO (Adjusted Funds from Operations) a proxy for free cash flow for REITs. This adds back the depreciation.
Run the check on 2026 numbers:
2026 AFFO guidance: $4.44 to $4.45 per share (raised at Q2)
Annual dividend: $3.25
AFFO payout ratio: roughly 73%
Occupancy: 98.8%
Realty Income carries an A3/A- credit rating, among the best in the REIT sector, indicating a strong balance sheet. And growth-wise, the company committed $1.4 billion to a data center joint venture to expand beyond its retail net lease business model.
The lesson: judge a REIT on AFFO, never on EPS. A REIT payout ratio of 73% on AFFO is comfortable. The same dividend measured against accounting earnings would look terrible, and that gap keeps people out of good REITs.
The catch: at a $58 billion market cap, moving the growth needle will take continued large deal volume. This is a stability holding, and I treat the data center pivot as something to watch, since it adds execution risk outside the core business.
#7: MPLX (MPLX), 7.3% yield
MPLX is the fastest raiser on this list, and the cost of that speed is the lesson.
This midstream partnership, formed by Marathon Petroleum, raised its distribution 12.5% last year and is guiding to 12.5% increases in both 2026 and 2027. Stack that on a 7.3% starting yield, and the income math gets loud fast.
The tradeoff shows up in the coverage line:
Q2 2026 distributable cash flow: $1.45 billion
DCF coverage: 1.3x, the thinnest of the midstream names here
Leverage: 3.7x debt to EBITDA
2026 growth capex: raised to $2.9 billion
Coverage of 1.3x is still fine. It is the direction that needs watching, because aggressive raises plus rising capex is how comfortable coverage becomes tight coverage in a couple of years.
The lesson: distribution growth is not free. Every point of growth comes out of the coverage cushion, so watch the pair together, never one alone.
The catch: Marathon Petroleum is both the parent and the dominant customer, so you carry concentration risk. MPLX also issues a K-1 tax form, which I would keep out of an IRA. That goes for every partnership on this list.
#6: Hercules Capital (HTGC), ~10.9% yield
Hercules lends to venture-backed technology and life science companies, which sounds terrifying until you look at its underwriting.
BDCs live and die on credit quality, and the tell is the non-accrual rate, the slice of loans no longer paying. Here is the Q2 2026 picture:
Non-accruals: 0.3% of portfolio cost, best of the big BDCs
Net investment income: $0.50 per share, a record
Base dividend: $0.40, covered 1.25x by NII
NAV per share: $12.15, up 2.1% in the quarter
The payout structure matters here. Hercules pays a $0.40 base dividend plus a $0.07 supplemental. If falling rates squeeze income, the supplemental flexes first and the base stays protected. There is also $0.92 per share of spillover income banked as a cushion.
The lesson: with any BDC, read the non-accrual line before the yield, and learn which part of the payout is flexible.
The catch: the market knows this is a quality lender, so the stock trades at 1.42x NAV. You are paying a 42% premium to book value, and premiums compress in bad markets even when the underlying book performs.
#5: Verizon (VZ), 6.1% yield
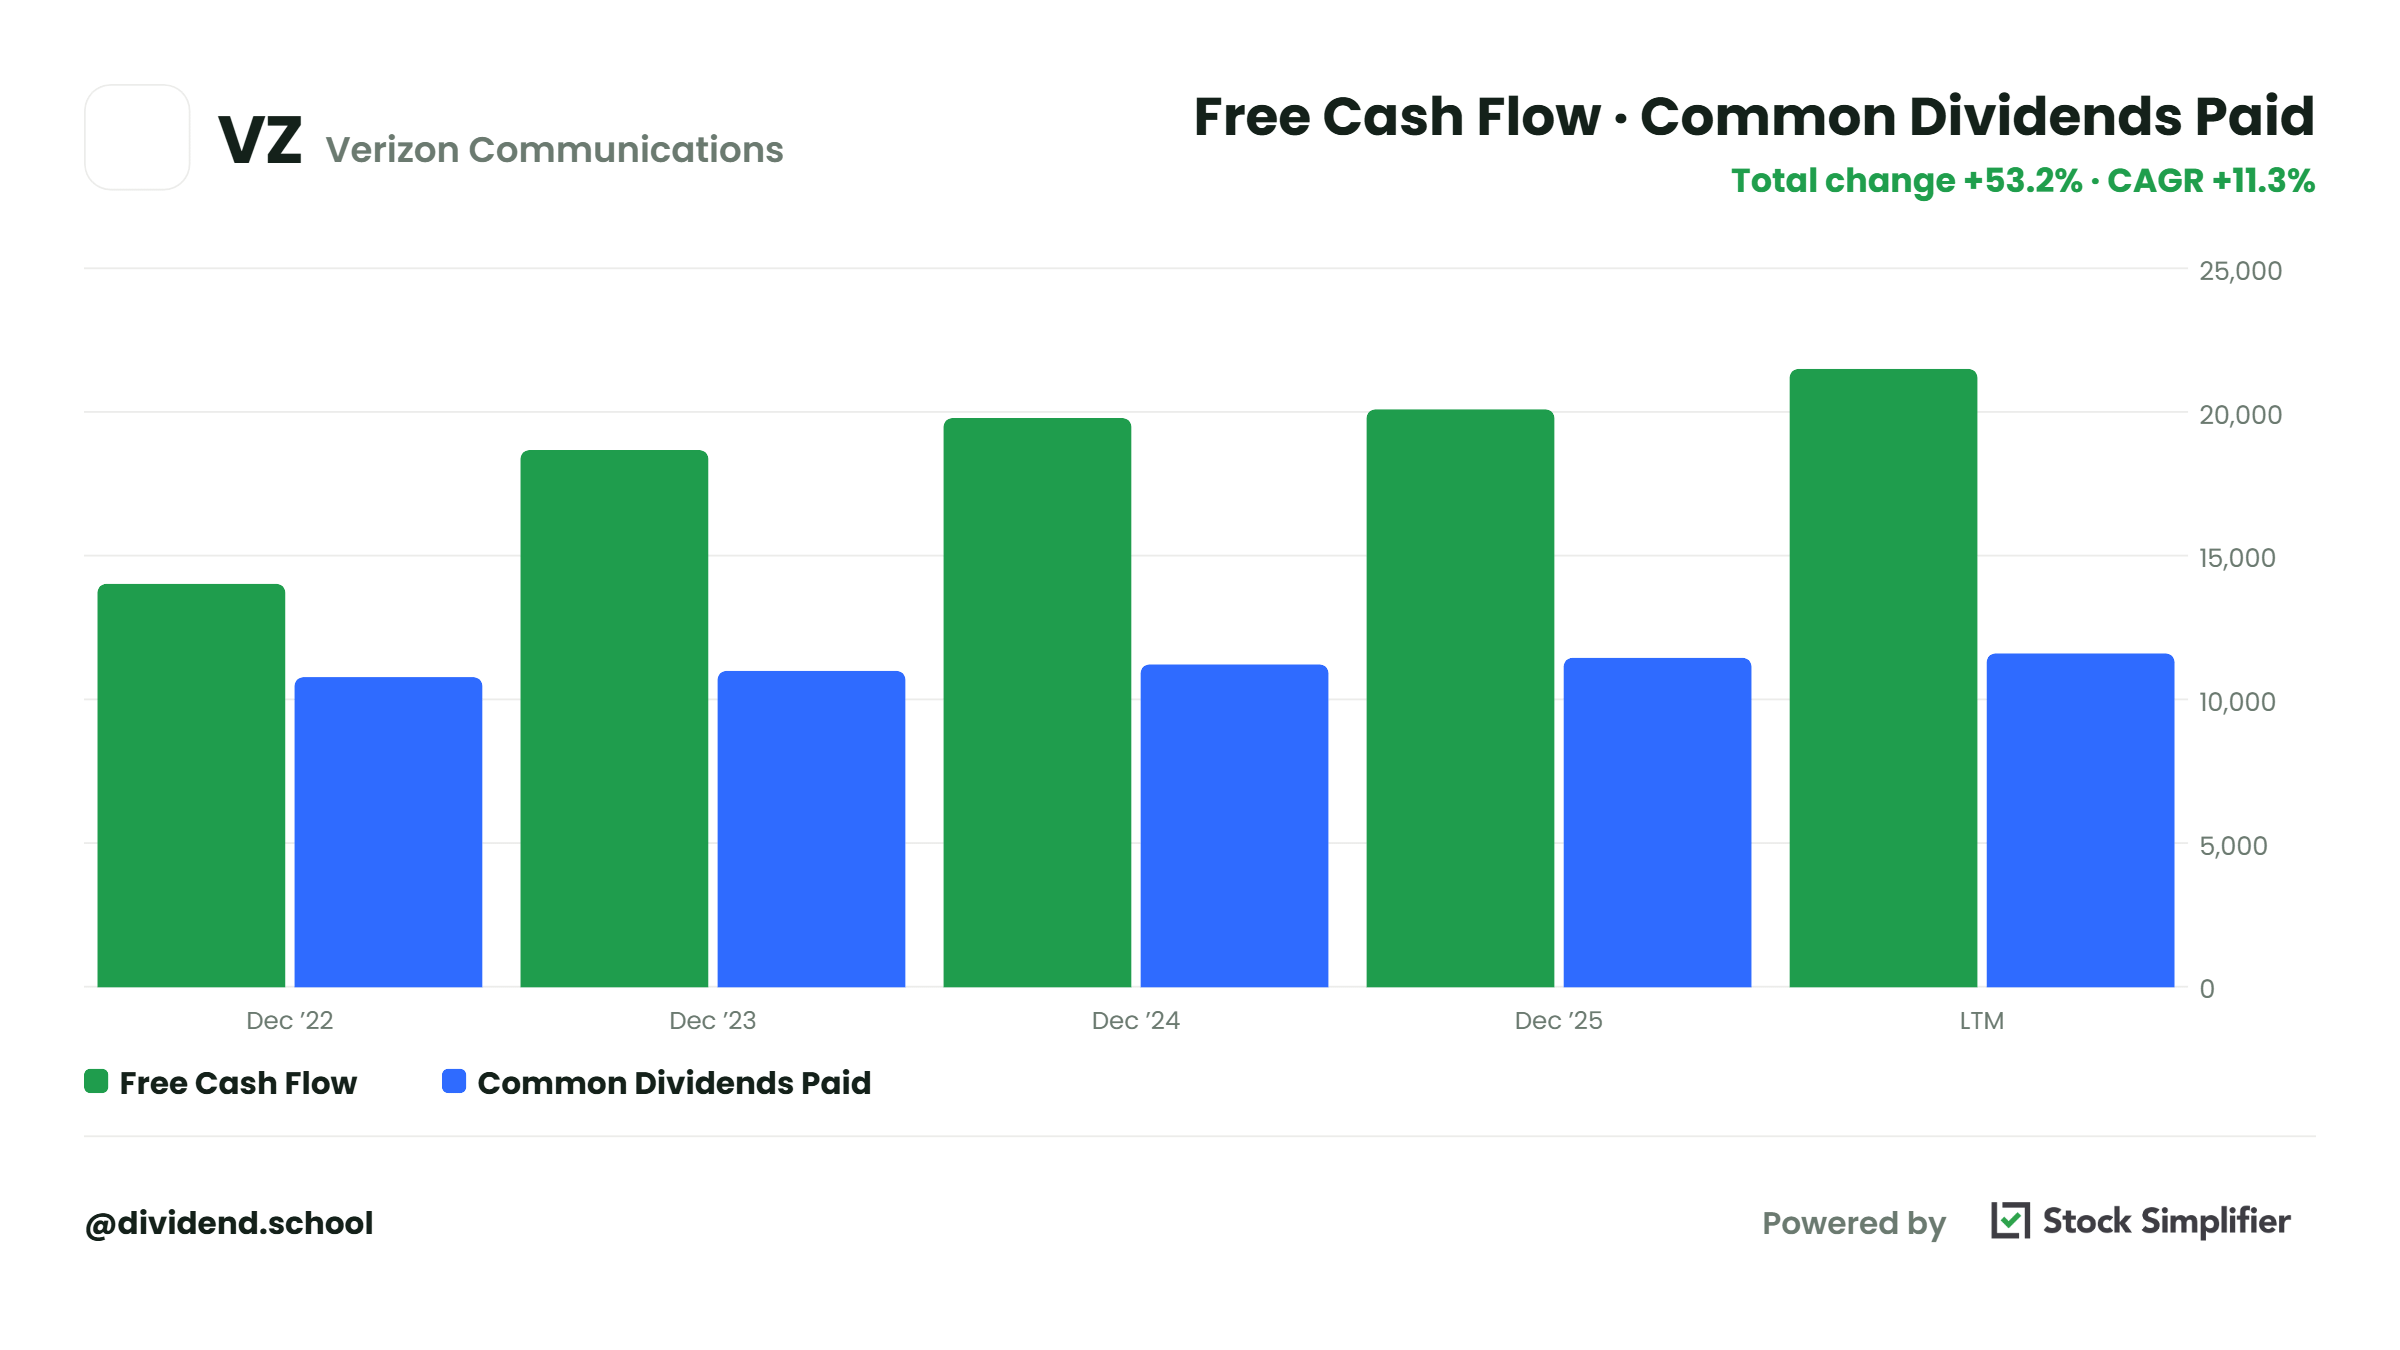
Verizon has the most boring dividend on this list, and boring is doing a lot of work in its favor.
The free cash flow payout ratio is the cleanest safety test for a common stock, so let’s run it on the first half of 2026:
Free cash flow: $10.2 billion
Dividends paid: roughly $5.9 billion
FCF payout ratio: about 58%
A 6% yield covered under 60% by free cash flow is rare. The business behind it just posted a record 40.1% EBITDA margin, and management raised full-year guidance on both earnings and free cash flow at Q2. The dividend has grown for 21 straight years, and grown slowly, about 2% a year.
The lesson: yield plus coverage beats yield plus promises. A 6% yield growing 2% annually, covered nearly twice over, compounds more reliably than an 8% yield covered at 100%.
The catch: revenue missed estimates last quarter, and wireless competition stays brutal, so the growth story is modest. The debt load is the other reason the raises stay small. You own this for the check, and the check is well protected.
#4: Enterprise Products Partners (EPD), 5.9% yield
Enterprise is the lowest yield of the midstream group and the one I would trust furthest into a recession.
Every durability box gets checked at once here:
DCF coverage: 1.9x on record Q2 distributable cash flow of $2.3 billion
Leverage: 3.0x, dead on target
Credit rating: A-, the only midstream operator rated single A across all three agencies
Distribution streak: 28 consecutive years of increases
That 1.9x coverage means Enterprise retained over $1 billion last quarter after paying everyone, cash that funds growth without borrowing. Volumes hit records across the pipeline network, and earnings per unit grew 27% year over year.
The lesson: coverage and the balance sheet are the same story told twice. A partnership that retains half its cash flow never has to choose between the distribution and the debt payment. When you find 1.9x coverage next to an A- rating, the yield in front of it is about as safe as midstream gets.
The catch: safety is priced in. You accept a sub 6% yield and roughly 3% annual growth, and the export-heavy business carries some China demand risk.
That’s the free part: the two minute safety check for every wrapper that pays a yield, plus picks 10 through 4, seven names averaging about 7.7% with the coverage math shown for each one.
The top three are where the yield and the safety stop trading against each other. One of them cut its payout in half in 2020, and the market is still charging 2020 prices for a distribution that is now covered more than twice over.
Below the paywall, members get:
The casino landlord whose tenants paid every rent check through the COVID shutdowns, and the lease math that can make two tenants safer than forty.
The BDC blue chip yielding 9.6%: 18 years without a cut, non-accruals near historic lows, and a price sitting at roughly the value of its loan book.
My #1 high yield pick for 2026. The best coverage cushion of any 6%+ name on this list, and the reason it’s still cheap is a cut the current cash flow statement contradicts.
The full scorecard: all ten names, yields, and coverage checks in one table, so you can rerun the safety check yourself when next quarter’s numbers land.
The one number I would recheck every quarter on each of the top three, and the level where each one would fall off this list.
Start with a 7-day free trial and read all ten names before paying a dollar. Membership is $369 a year or $35 a month, with a 30-day money-back guarantee either way.