
Moats 101: What They Are, When They Fail, and How to Spot Both

A moat is an edge that keeps competitors out. It enables a company to earn strong returns over an extended period. It also buys time to fix mistakes. Moats can widen, narrow, or fade. Your job is to tell which way the slope is pointing.
What is a moat?
Think of a business as a castle. The moat is what protects its cash flows.
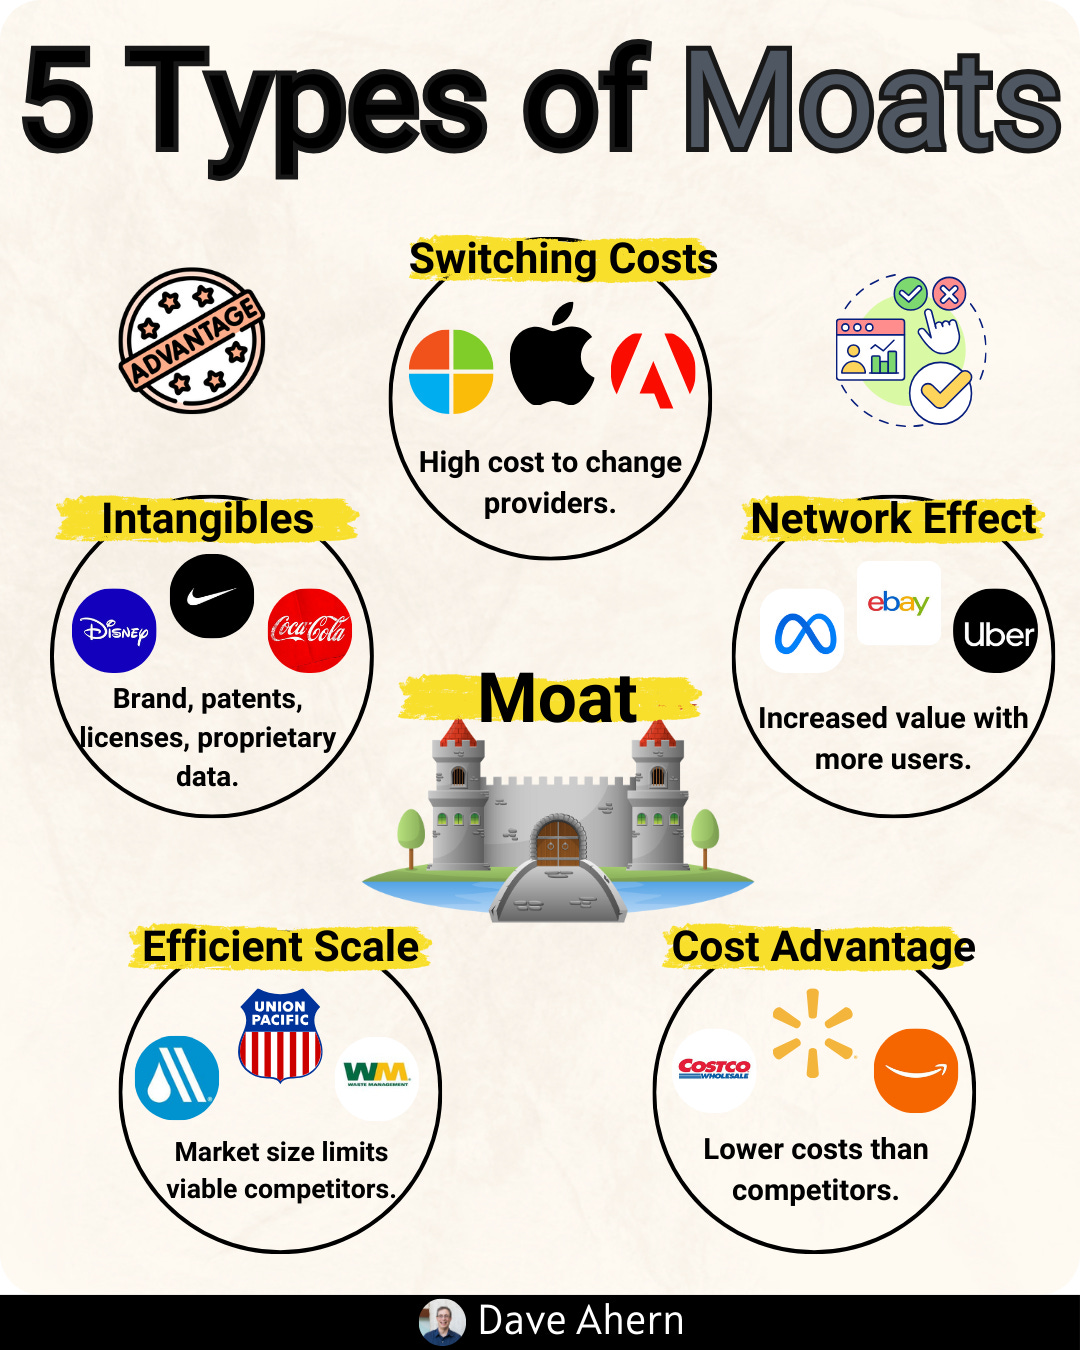
Common moat types:
Cost advantage: Produce or deliver at a lower unit cost.
Network effects: The product gets better as more users join.
Switching costs: Customers face pain if they leave.
Intangibles: Brand, patents, licenses, and data.
Efficient scale: A local market supports only one or two efficient players.
The best companies stack more than one moat. Moats also shift as tech, rules, and customer needs change.
When moats fail
Moats rarely collapse overnight. They erode. Watch for:
Platform shifts: The basis of competition moves (e.g., hardware to software).
Counter-positioning: A new model wins, but the incumbent won’t copy it because it hurts profits.
Commoditization: Products look alike; price becomes the only lever.
Regulation: New rules compress margins or open the field.
Culture: Slow decisions and turf wars dull the edge.
Capital mistakes: Underinvesting in the next wave or overpaying for the last one.
In the numbers, you’ll see falling pricing power, rising churn, lower ROIC on new spend, and longer paybacks.
Below are U.S.-only examples, with brief, rounded snapshots. Use them as patterns, not as buy/sell calls.
Strong moat examples (U.S.)
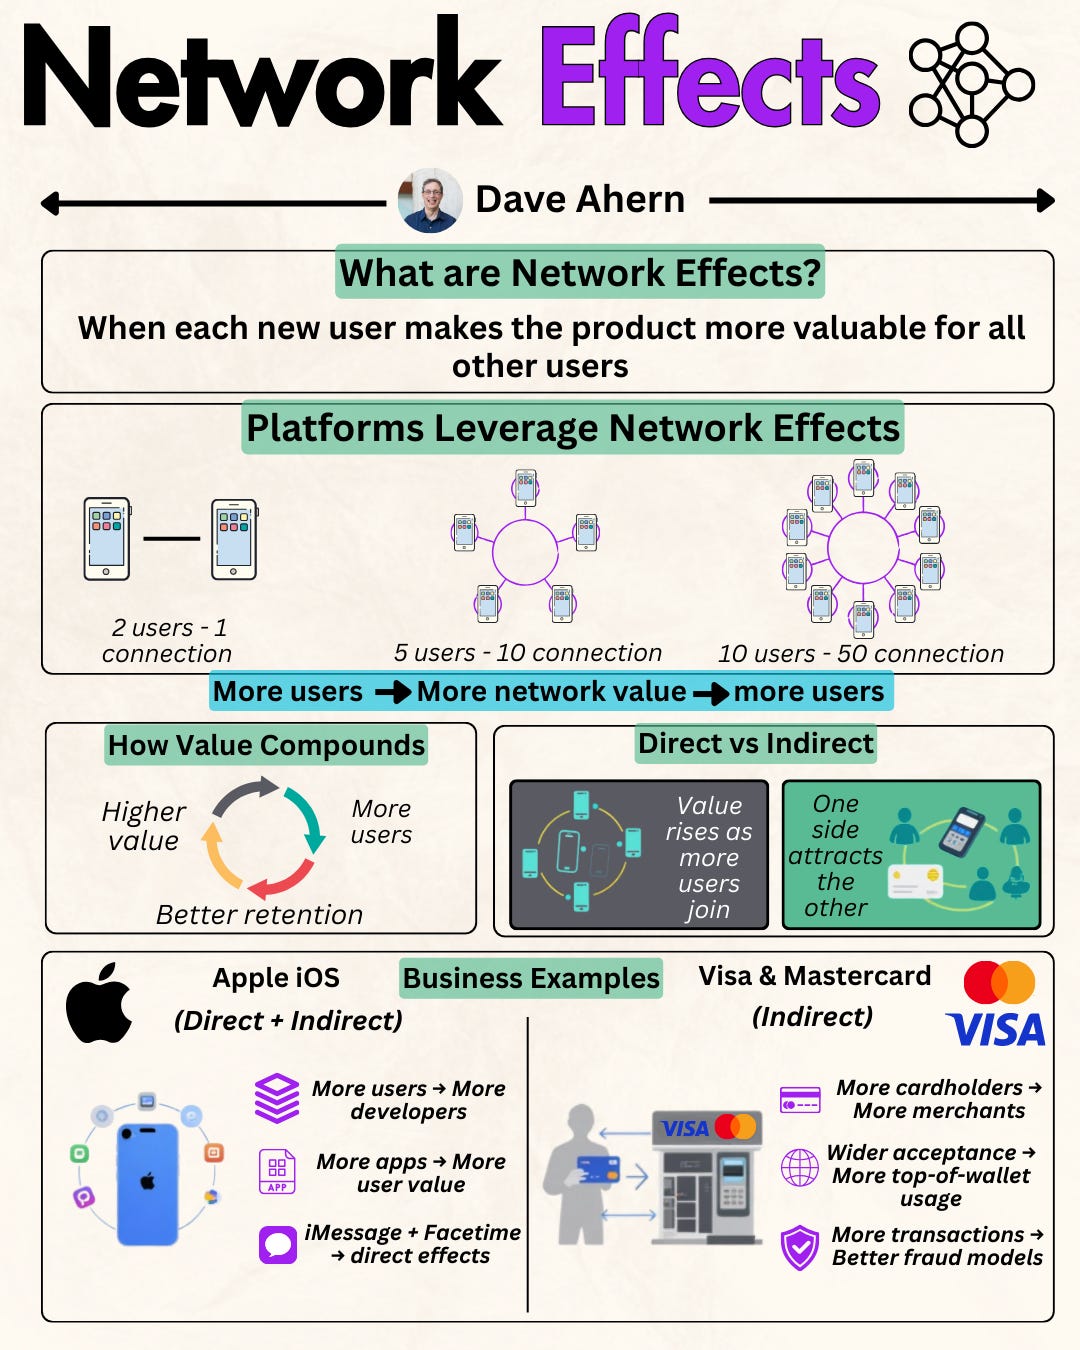
Visa (network effects + scale + trust)
Why it’s durable: Every new cardholder makes the network more valuable to merchants. Every new merchant does the same for cardholders. Fraud systems, brand, and rules reinforce trust at global scale.
How it shows up: High margins, strong free cash flow, and low capital needs. Many “disruptors” end up riding Visa’s rails.
Quick snapshot (latest fiscal year, rounded):
Operating margin: ~65%+
ROIC: 30%+
Net revenue growth: high single to low double digits
Risks to watch: Real-time bank-to-bank payment systems, big-platform closed wallets, and regulation on fees.
Costco (scale economies shared + member model)
Why it’s durable: Costco gives most scale gains back to members via low prices. That builds trust and renewals. Vendors want the volume and signal of being on Costco’s shelves.
How it shows up: Tight gross margins by design, strong traffic, rich membership income that funds low prices.
Quick snapshot (latest fiscal year, rounded):
U.S./Canada renewal rate: ~93%
Operating margin: ~3% (by design; value is in velocity and membership)
ROIC: high teens to low 20s
Risks to watch: Model drift (raising prices vs. member value), culture dilution in rapid expansion.
Nvidia (ecosystem lock-in + pace of innovation)
Why it’s durable: Leadership in GPUs plus CUDA software, libraries, and tools. Developers and enterprises standardize on the stack. The platform gets stickier as more models and tools target it.
How it shows up: Explosive data center growth, rich gross margins, very strong free cash flow in the AI buildout.
Quick snapshot (recent period, rounded):
Gross margin: ~75%+
Data center growth: triple-digit y/y at peak of cycle
Net cash from ops and FCF: up multiples y/y
Risks to watch: Supply chain constraints, open alternatives (chip + software), large buyers pushing for vendor diversification.
S&P Global (intangible + regulatory position + data network)
Why it’s durable: Credit ratings are embedded in rules, contracts, and workflows. Indexes and data feed modern finance. Trust, track record, and distribution are hard to copy.
How it shows up: High margins, recurring revenue, sticky customers across segments (ratings, indices, data/analytics).
Quick snapshot (latest fiscal year, rounded):
Operating margin: ~40% (mix-dependent)
ROIC: 20%+
Recurring/contracted revenue: majority of mix
Risks to watch: Regulatory changes to ratings use, cyclical issuance, and open data pressures.
These companies show a pattern. The moat scales with size. The edge is embedded in networks, rules, or customer workflows.
Moats that shrank or failed (U.S.)
Kodak (counter-positioning + tech shift)
The moat: Film chemistry, brand, retail presence. Decades of know-how.
What changed: Digital cameras and then smartphones killed film economics. The new model undercut Kodak’s profit pool.
What the data said: Film volumes collapsed; legacy margins evaporated. Bankruptcy followed in 2012.
Investor lesson: When a new model destroys your cash cow, delaying the switch is deadly. “Protecting the core” can be the biggest risk.
Blockbuster (business model disruption)
The moat: Brand, thousands of prime store locations, and late fee economics.
What changed: Netflix’s mail model cut friction and cost. Streaming then removed trips and inventory risk. Blockbuster’s economics could not adapt.
What the data said: Store count peaked near 9,000, then fell fast. Revenue and margins followed. Bankruptcy in 2010.
Investor lesson: If convenience jumps and unit economics flip, location scale is not a moat. It’s overhead.
Intel (process leadership eroded)
The moat: Process leadership, x86 dominance, close tie-in with Windows PCs. “Tick-tock” rhythm set the pace.
What changed: Node delays, a shift to mobile and low power, and foundry rivals pulling ahead. ARM designs surged. The old cadence broke.
What the data said: Gross margin fell from historical 60%+ levels to the 40s% range in recent years; ROIC compressed; capex needs rose.
Investor lesson: Technology moats require relentless reinvestment. Falling behind for a few cycles can unwind decades of edge.
Notice the theme. The warning signs showed up before the end. Customer behavior moved. The economics of the new model made sense. The incumbent’s culture and P&L resisted the change.
How to test a moat in the wild
Run this checklist once a year on any holding.
Customer power
Can the firm raise price without big churn?
Are renewals strong (e.g., 90%+), with solid net retention?
Competition
Are new entrants copying features or copying the business model?
Do rivals need less capital to reach similar scale?
Economics
Is ROIC stable or rising?
Are gross and operating margins holding while the company grows?
Product and platform
Is the platform better because it is bigger (data, partners, developers)?
Are release cycles speeding up or slowing down?
Capital and culture
Is R&D focused on the next basis of competition?
Are buybacks offsetting dilution or shrinking the share count?
If three or more answers worry you, assume the moat is narrowing. Lower your position size or demand a cheaper price.
Reading a narrowing moat
A moat can be “real but narrowing.” Here’s how it looks:
Pricing power softens. More discounting and bundling.
Sales cycles lengthen. More approvers in the room.
Feature parity rises. Fewer “only we can do X” claims.
Unit economics slip. CAC rises; payback stretches; ROIC on new projects falls.
This is not always a sell. But the thesis must change. Expect more reinvestment, slower growth, and a wider range of outcomes.
What investors can learn
Stack moats. Two small edges can add up to one big defense.
Follow the basis of competition. Ask what makes customers switch today. Ask again in six months.
Trust numbers over narratives. If the story is “network effects,” churn should fall and attach should rise.
Respect counter-positioning. If the new model hurts the old profit pool, the disruptor has time to run.
Study failure. It trains your pattern recognition and your sell discipline.
Bottom line
A moat is not a wall. It is a living system that markets test every day. Own firms whose moats widen as they scale. Be quick to fade stories where the edge no longer shows up in the data. Simple, repeatable checks on pricing power, retention, ROIC, and reinvestment can keep you on the right side of compounding.
You had me at Nvidia lol .. really good read!