
How to Value Thermo Fisher Through the Cycle: A Scenario Analysis Framework Using EV/EBIT and ROIC

When a company’s revenue swings from COVID-driven peaks to normalized troughs, how do you separate signal from noise?
Thermo Fisher Scientific (NYSE: TMO) offers a masterclass in scenario analysis — a $200B life sciences giant whose earnings fluctuated wildly as pandemic tailwinds faded.
By anchoring valuation to mid-cycle metrics like EV/EBIT, FCF margin, and ROIC, you can build scenarios that reveal whether today’s price reflects temporary weakness or permanent impairment.
Let’s learn how.
TL;DR
Scenario analysis anchors valuation to normalized, mid-cycle earnings rather than cyclical peaks or troughs
Thermo Fisher’s COVID boom inflated 2021 margins; 2024 represents a cleaner baseline with 16-17% FCF margins and 22% ROIC ex-goodwill
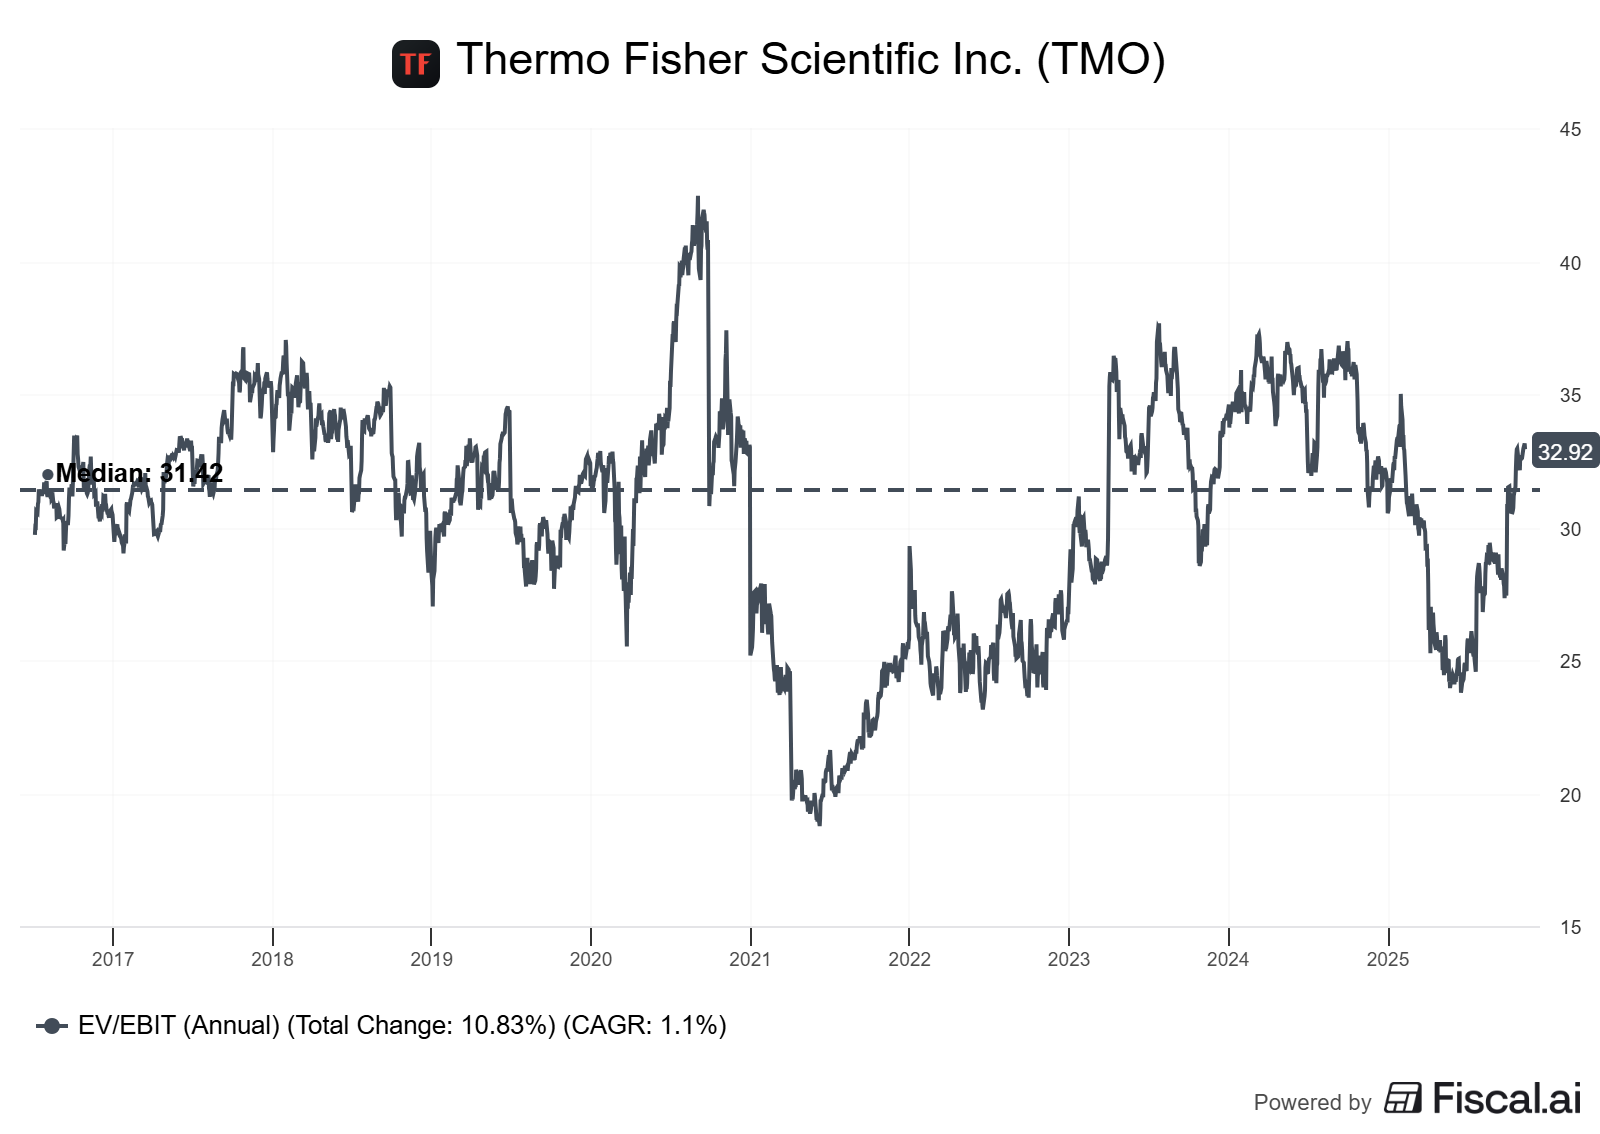
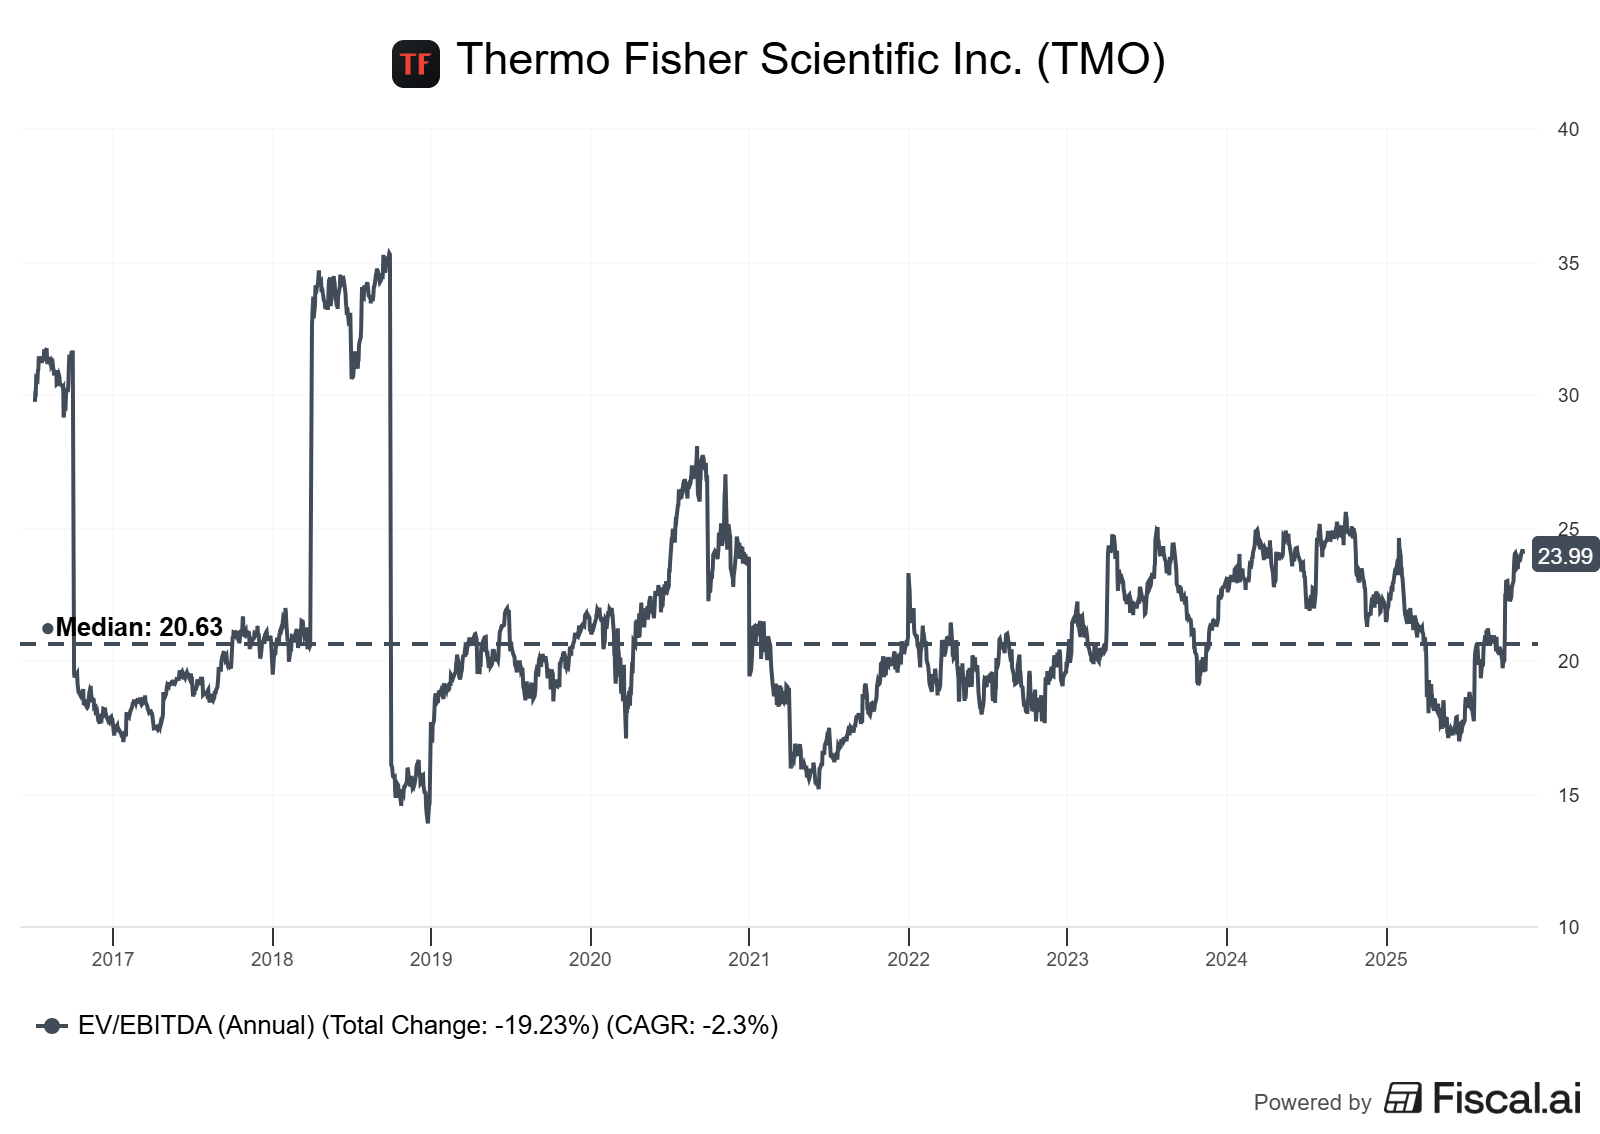
EV/EBIT (or EV/EBITDA) multiples compress/expand with growth expectations; TMO’s 10-year range is 15-27x (median ~20x)
Building bear/base/bull scenarios using margin bands, ROIC assumptions, and multiple ranges produces a valuation distribution, not a single price target
Use decision rules like “prefer ROIC – WACC > 5% sustained” and “demand FCF conversion > 80%” to filter false positives.
Why It Matters
Most investors anchor to the numbers in the latest earnings report. Revenue down 2%? Sell. EPS up 8%? Buy. This reflex ignores cyclicality, one-time tailwinds, and mean reversion.
Scenario analysis forces you to think probabilistically and normalize for cycles.
Base rates: Over the last five years, Thermo Fisher shares have typically traded at EV/EBITDA multiples within 18-23x, but this range obscures dramatic swings. At its peak in 2021, COVID-related revenue contributed about 25% to the company’s total revenue, contributing some $2.5 billion.
By 2024, this dropped to just $100 million per quarter, creating a 300 basis point growth headwind. Investors who valued TMO on 2021 peak earnings paid 27x EV/EBITDA for unsustainable margins.
Where investors go wrong: They conflate cyclical peaks with structural earnings power.
A company generating 20% operating margins at the top of a cycle may only sustain 15% mid-cycle.
Valuing the peak at 25x EV/EBIT produces a disaster when margins compress and multiples contract simultaneously. Scenario analysis mitigates this by modeling multiple futures and weighting them by probability.
Core Concepts: Quality Investing Meets Scenario Design
ROIC vs. WACC: The Value Creation Engine
Return on Invested Capital (ROIC) measures how efficiently a company converts capital into operating income. When ROIC exceeds Weighted Average Cost of Capital (WACC), the company creates value; when ROIC falls below WACC, it destroys value.
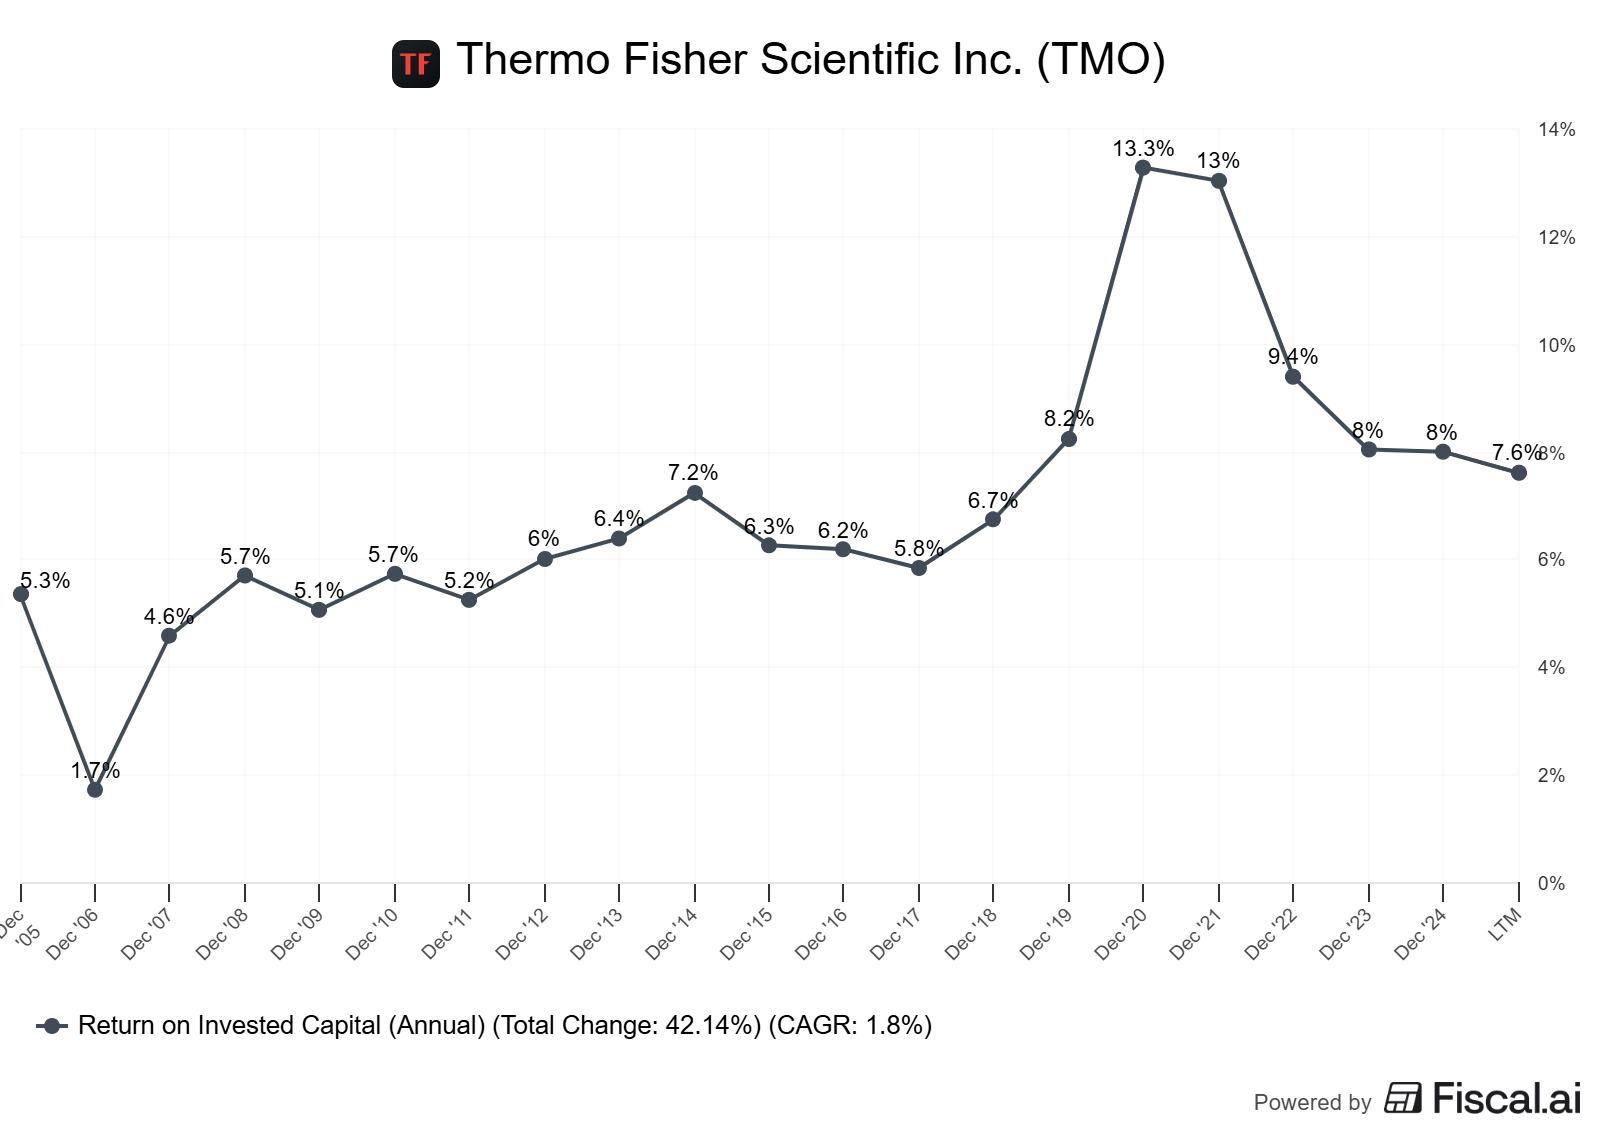
As of May 2025, Thermo Fisher Scientific’s ROIC was 8.08% with a WACC of 8.96%, suggesting value destruction on the surface. But this headline figure is misleading. ROIC ex-goodwill provides insight into the company's ongoing capital efficiency.
By removing the surplus (goodwill) from past M&A transactions, TMO is able to generate 22% returns on the capital invested in the business.
This 13+ percentage point gap matters enormously — TMO’s acquisitions carry goodwill that depresses reported ROIC, but the underlying business generates exceptional returns.
Decision rule: For serial acquirers like TMO, always calculate ROIC ex-goodwill to see economic reality. Demand a spread of ROIC – WACC > 5% sustained over multiple years before assuming durable value creation.
FCF Margin and Conversion: The Cash Reality Check
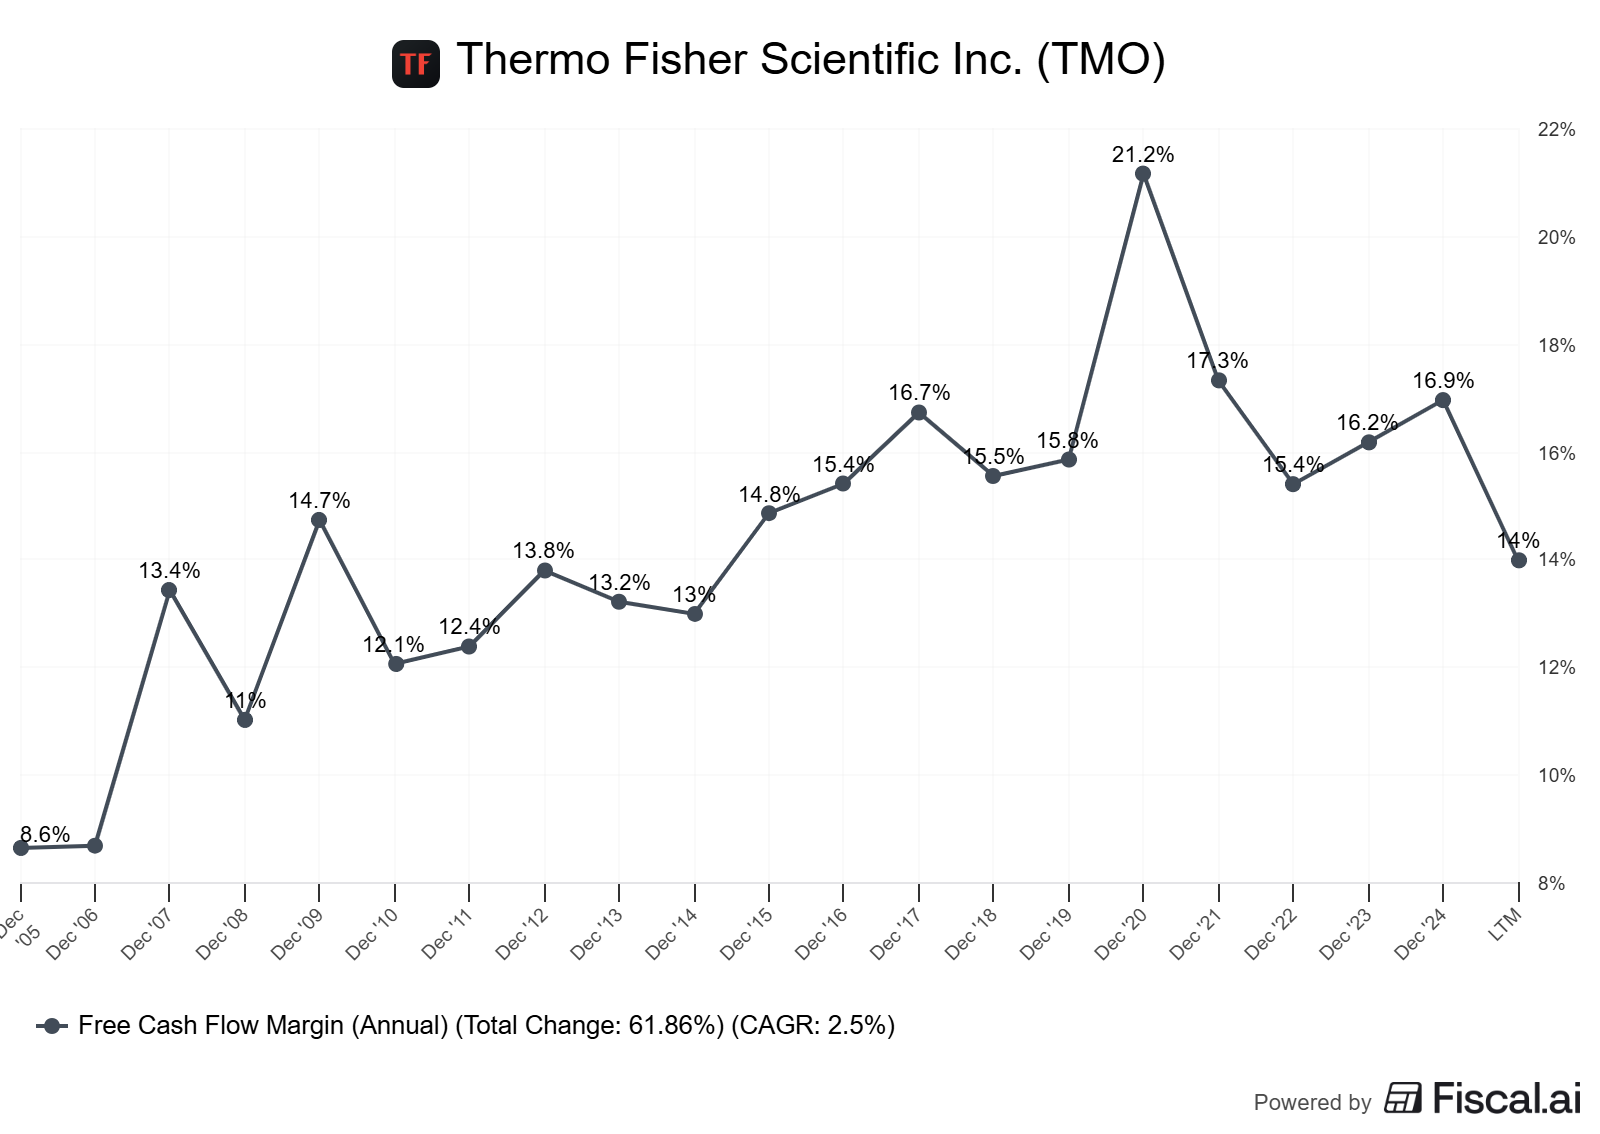
Free Cash Flow (FCF) margin — FCF divided by revenue — tells you how much of each sales dollar converts to discretionary cash. High-quality compounders typically sustain FCF margins of 15%+ and FCF conversion (FCF/Net Income) above 100%.
For what it’s worth, TMO’s free cash flow have remained steady after COVID-19 and have remained around the $7 billion mark. These are very healthy levels at an FCF margin of around 16-17%. This stability through the cycle is remarkable — even as COVID revenues evaporated, TMO’s cash engine held firm. Evidence of pricing power and cost discipline.
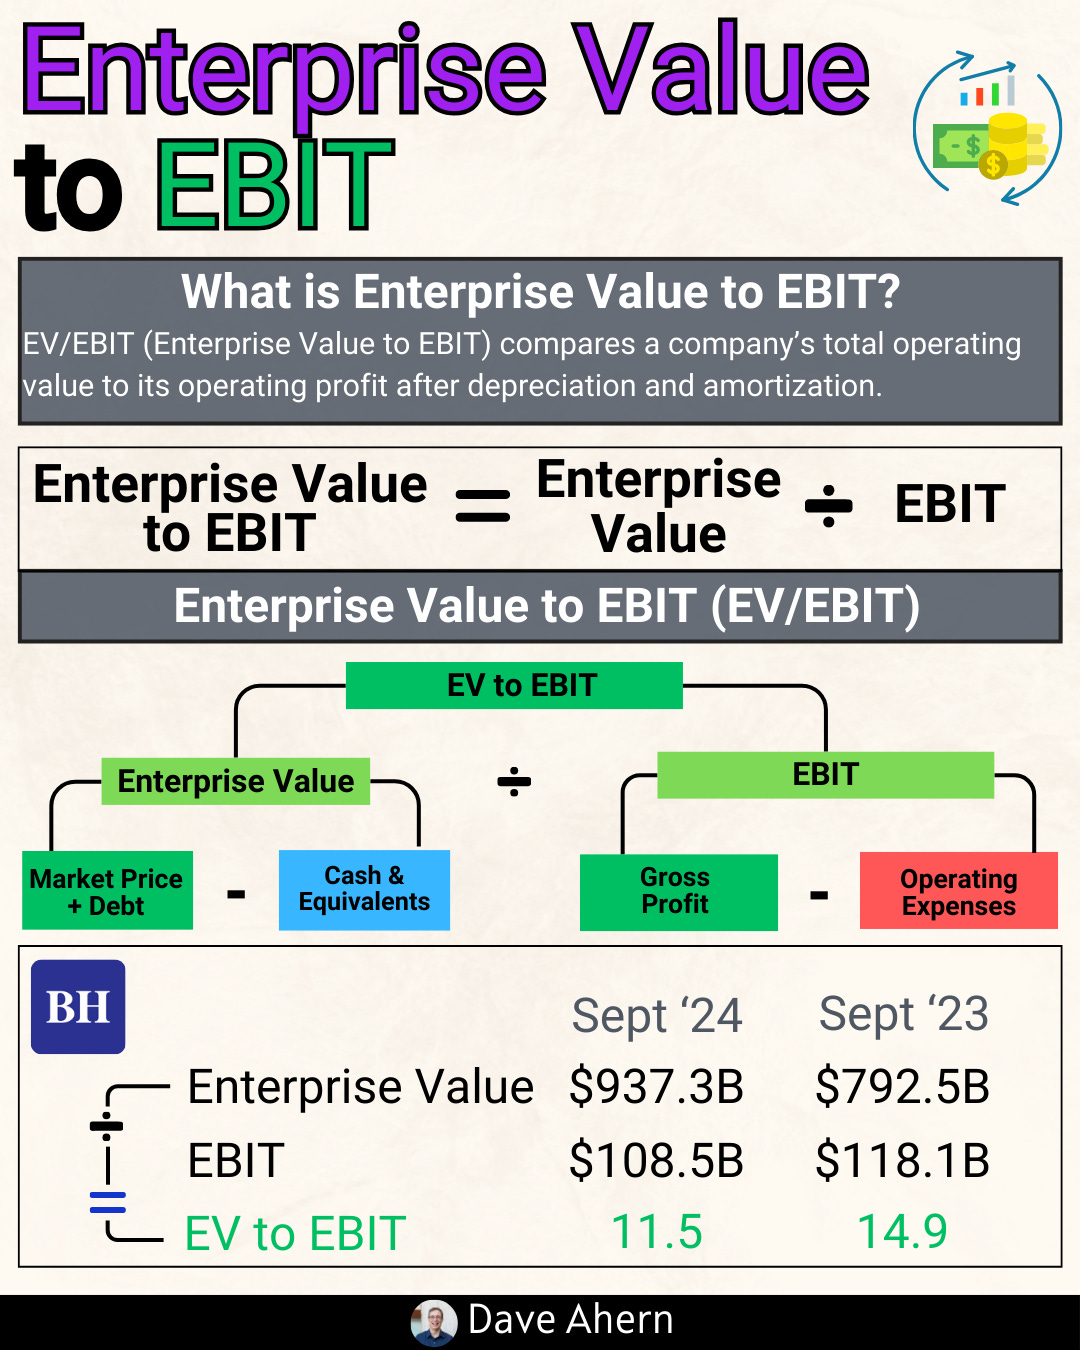
EV/EBIT and Valuation Multiples: The Market’s Price Tag
Enterprise Value to EBIT (or EBITDA) measures how much investors pay for each dollar of operating profit.
It’s superior to P/E for capital-intensive businesses or serial acquirers because it accounts for debt and excludes depreciation and amortization distortions.
During the past 13 years, the highest EV-to-EBITDA of Thermo Fisher Scientific was 27.47. The lowest was 15.00. And the median was 19.96.
Currently, Thermo Fisher’s EV-to-EBITDA for today is 19.58, sitting near the historical median despite a growth slowdown.
Valuation framework for scenarios: Use historical multiple ranges as guardrails. Bear case = low end of range (15-18x), base case = median (19-21x), bull case = high end (22-25x). Multiples should reflect expected growth and ROIC sustainability — a company growing at 3% with 8% ROIC doesn’t merit 25x EV/EBIT, but one growing at 7% with 20% ROIC does.
Scenario Design: Bear, Base, Bull
Scenario analysis requires three inputs for each case:
Normalized EBIT or EBITDA (mid-cycle, not peak or trough)
Exit multiple (based on historical range and expected growth/ROIC)
Time horizon (typically 3-5 years)
Bear scenario: Assumes modest organic growth (1-2%), margin compression to cycle lows, and multiple contraction to the 25th percentile of the historical range.
Base scenario: Assumes mid-cycle economics — normalized margins, steady-state growth in line with industry, and median historical multiple.
Bull scenario: Assumes margin expansion from operating leverage, above-market growth from share gains, and premium multiple justified by ROIC superiority.
Critical nuance: Weight scenarios by probability. If you assign 20% bear, 60% base, 20% bull, the probability-weighted valuation may sit 10-15% below the base case alone. This builds in conservatism.
Worked Example: Thermo Fisher’s Cash Engine
Let’s build scenarios for TMO as of November 2025 using a 3-year horizon (through 2028).
Step 1: Establish the Baseline
FY 2024 financials (actual):
Revenue: $42.9B (midpoint of $42.4-43.3B guidance)
Operating margin: ~22.7% (midpoint of 22.5-22.8%)
EBIT: ~$9.7B
FCF: $6.75B (midpoint of $6.5-7B), implying 15.7% FCF margin
Shares outstanding: ~378M (post-buybacks)
Net debt: $28.8B
Current EV/EBITDA: 19.6x
FY 2025 guidance (management):
Revenue: $43.5-44B, implying 3-4% organic growth
Operating margin expansion of ~90 basis points
Adjusted EPS: $23.10-23.50
Key normalization: 2024 still carried ~$400-500M of COVID revenue. 2025 marks the first “clean” year. Management expects to exit 2025 near the low end of their 7-9% long-term organic growth target.
Step 2: Build Three Scenarios
Bear Scenario (20% probability)
Assumptions:
Organic growth slows to 2% CAGR (pharma capex cuts, biotech funding crunch)
Operating margins compress to 20% (cost inflation, mix shift to lower-margin segments)
Net debt stays flat (limited M&A appetite, defensive buybacks)
Exit multiple: 17x EV/EBIT (25th percentile of historical range)
Math:
2028 Revenue: $42.9B × (1.02)^3 = $45.5B
2028 EBIT: $45.5B × 20% = $9.1B
2028 EV: $9.1B × 17x = $154.7B
Less net debt: $154.7B – $28.8B = $125.9B equity value
Shares (assume 1% annual buyback): 378M × (0.99)^3 = 367M
Bear price: $343/share
Base Scenario (60% probability)
Assumptions:
Organic growth returns to 5% CAGR (inline with 2025 exit run-rate, modest biopharma recovery)
Operating margins stabilize at 23% (90bps expansion in 2025, then flat)
FCF margins hold at 17%, funding $3B annual buybacks
Exit multiple: 20x EV/EBIT (historical median)
Math:
2028 Revenue: $42.9B × (1.05)^3 = $49.7B
2028 EBIT: $49.7B × 23% = $11.4B
2028 EV: $11.4B × 20x = $228B
Less net debt (reduced by cumulative FCF – buybacks): $228B – $24B = $204B equity value
Shares: 378M × (0.99)^3 = 367M
Base price: $556/share
Bull Scenario (20% probability)
Assumptions:
Organic growth accelerates to 7% CAGR (genomics upturn, biopharma R&D recovery, CRO pricing power)
Operating margins expand to 25% (operating leverage from revenue growth, PPI productivity gains)
Aggressive buybacks ($4B/year) funded by strong FCF
Exit multiple: 23x EV/EBIT (75th percentile, justified by ROIC > 20%)
Math:
2028 Revenue: $42.9B × (1.07)^3 = $52.6B
2028 EBIT: $52.6B × 25% = $13.2B
2028 EV: $13.2B × 23x = $303.6B
Less net debt: $303.6B – $20B = $283.6B equity value
Shares: 378M × (0.97)^3 = 345M
Bull price: $822/share
Step 3: Weight the Outcomes
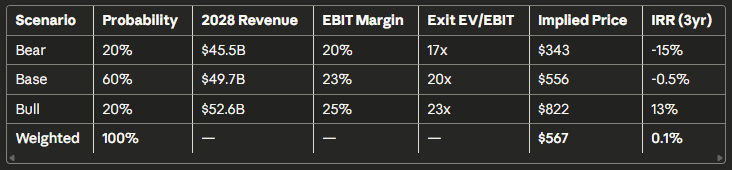
Probability-weighted value = (0.20 × $343) + (0.60 × $556) + (0.20 × $822) = $567/share
Current price (November 2025): ~$565/share
Interpretation: TMO trades at fair value using mid-cycle assumptions. The 20% downside to the bear case ($343) versus 45% upside to the bull case ($822) creates asymmetry, but the base case dominates at 60% weight. There’s no screaming bargain here, but no obvious overvaluation either. The setup rewards patient holders betting on margin expansion and organic growth acceleration.
[Table: TMO Scenario Analysis Summary]
Step 4: Sanity Checks
ROIC sustainability: ROIC ex-goodwill of 22% supports premium multiples if growth resumes. In the base case, 5% growth × 22% ROIC = 1.1% annual value creation per share (ROIC × reinvestment rate). This justifies a 20x EV/EBIT multiple.
FCF conversion: FCF margin of 16-17% on $50B revenue = $8B+ FCF by 2028. Base case assumes $17% × $49.7B = $8.4B FCF, which funds $3B buybacks and $1B dividends, with $4.4B for debt paydown or M&A. Check: Reasonable.
Historical valuation bands: TMO’s 10-year EV/EBITDA range of 15-27.5x (median 20x) aligns with our bear (17x EV/EBIT ≈ 15x EV/EBITDA) and bull (23x EV/EBIT ≈ 21x EV/EBITDA) exit multiples. Check: Within bounds.
[Table: Historical TMO Margin Trends (2015-2024)]
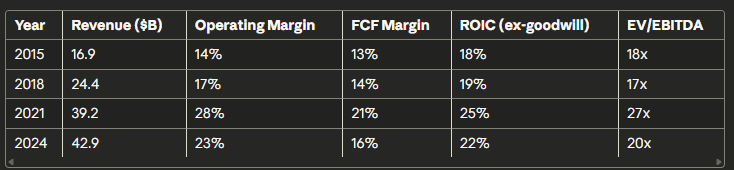
Source: Company 10-Ks, GuruFocus data as of Nov 2025
How to Do This Yourself
Data to Gather
10-year historical financials: Revenue, EBIT, EBITDA, operating margin, FCF, FCF margin. Source: Company 10-Ks, CapIQ, Koyfin, or free tools like GuruFocus.
Capital structure: Shares outstanding, net debt, market cap. Source: Latest 10-Q or earnings presentation.
Historical valuation multiples: EV/EBIT, EV/EBITDA, P/E over 10 years. Source: YCharts, Koyfin, or manual calculation from financials.
ROIC and WACC: Calculate ROIC as NOPAT / Invested Capital. Estimate WACC using the cost of equity (CAPM) and the after-tax cost of debt. For ROIC ex-goodwill, subtract goodwill from invested capital.
Step-by-Step Process
Step 1: Normalize earnings. Identify cyclical peaks/troughs. For TMO, 2021 was the peak (COVID boost), and 2024 is normalized. Use 3-5 year averages for mid-cycle margins if unsure.
Step 2: Define growth assumptions. Bear = 1-2% below trend, Base = company guidance or industry growth, Bull = 1-2% above trend. Cross-check with historical CAGRs.
Step 3: Set margin assumptions. Map operating margin to historical percentiles. Bear = 25th percentile, Base = median, Bull = 75th percentile. Adjust for structural changes (e.g., TMO’s margin expansion from PPI productivity system).
Step 4: Choose exit multiples. Use 10-year range for EV/EBIT or EV/EBITDA. Bear = 25th percentile, Base = median, Bull = 75th percentile. Tighten ranges for stable businesses, widen for cyclicals.
Step 5: Model balance sheet. Assume FCF after dividends funds either buybacks (accretive) or debt paydown (reduces EV). Update the share count annually at ~1-2% per year for quality compounders.
Step 6: Calculate terminal EV and equity value. For each scenario: Terminal EV = EBIT × Exit Multiple. Equity value = EV – Net Debt. Price per share = Equity Value / Shares Outstanding.
Step 7: Weight scenarios. Assign probabilities (e.g., 20/60/20). Calculate the weighted average price. Compare to the current price for the implied margin of safety.
Decision Rules and Thresholds
ROIC threshold: Prefer ROIC – WACC > 5% sustained. Flag companies where ROIC is falling.
FCF conversion: Demand FCF / Net Income > 80%. Below 70% suggests aggressive accounting or capital intensity.
Margin stability: Avoid companies where operating margin swings >500bps year-over-year without clear explanation (one-time charges, M&A).
Multiple sanity check: If exit multiple > 25x EV/EBIT, require ROIC > 25% and revenue growth > 10%. Otherwise, you’re overpaying for growth.
Per-share framing: Always check if buybacks are value-accretive. If a company repurchases stock at 30x P/E with 10% earnings yield, it’s destroying value (3.3% yield << 10% earnings yield would suggest).
Pitfalls and False Positives
Pitfall 1: Anchoring to peak earnings and valuing a company at 20x EBIT when EBIT is at a cyclical high guarantees overpayment. Always normalize to mid-cycle.
Pitfall 2: Ignoring goodwill in ROIC. Serial acquirers like TMO carry significant goodwill, which depresses reported ROIC. Calculate ROIC ex-goodwill to see the economic reality.
Pitfall 3: Static multiples across scenarios. Multiples should flex with growth and ROIC. A bear case with 2% growth and 15% ROIC doesn’t deserve a 22x EV/EBIT multiple.
Pitfall 4: Overweighting the bull case. Human psychology is optimistic. Discipline yourself: 20% bull, 60% base, 20% bear is a reasonable default. Adjust only with strong evidence.
Pitfall 5: Ignoring capital allocation. A company buying back stock at peak valuations destroys value. Check historical buyback prices relative to intrinsic value.
False positive: High FCF margin with falling ROIC. A company can juice FCF by slashing capex, but this kills future growth. Always pair FCF margin analysis with ROIC trends.
False positive: Compressed multiple “on the cheap.” A stock trading at 15x EV/EBIT (below its 20x median) isn’t cheap if ROIC is collapsing and growth is turning negative. Multiples compress for a reason.
Checklist
Pulled 10 years of revenue, EBIT, FCF, and margin data
Calculated mid-cycle operating margin (use 3-5 year average or percentile bands)
Confirmed ROIC > WACC sustainably; calculated ROIC ex-goodwill for acquirers
Defined bear/base/bull revenue CAGR (±2% spread around base)
Mapped margin assumptions to historical percentiles (25th/50th/75th)
Selected exit multiples from 10-year historical range (adjusted for growth/ROIC)
Glossary
EV/EBIT: Enterprise Value divided by Earnings Before Interest and Tax; valuation multiple ignoring capital structure.
FCF Margin: Free Cash Flow divided by Revenue; measures cash conversion efficiency.
ROIC: Return on Invested Capital; operating income after tax divided by total capital invested.
ROIC ex-goodwill: ROIC calculated by excluding goodwill from invested capital; isolates organic capital efficiency.
WACC: Weighted Average Cost of Capital; blended cost of equity and debt used as hurdle rate.
Mid-cycle margins: Normalized profitability level between cyclical peaks and troughs.
Terminal value: Estimated company value at the end of a forecast period, based on exit multiple × terminal EBIT.
Scenario weighting: Assigning probabilities to bear/base/bull cases to calculate expected value.
Further Reading
Thermo Fisher Q4 2024 Earnings Call Transcript — January 30, 2025
Thermo Fisher 10-K (FY 2024) — February 2025
GuruFocus ROIC Analysis for TMO — Updated May 2025
Damodaran, Aswath. “Narrative and Numbers: The Value of Stories in Business” (2017) — scenarios as probabilistic storytelling
Greenblatt, Joel. “The Little Book That Beats the Market” (2006) — ROIC and earnings yield framework
Disclaimer: Educational content, not investment advice.