
How to Value LVMH’s Houses: A Quality Investor’s SOTP Playbook

Luxury brands don’t rent factories; they rent desirability. That makes valuation tricky when a group owns dozens of “Houses” with different economics and moat strengths. In today’s post, we build a practical SOTP (Sum of the Parts) for LVMH and demonstrate how to translate soft moats, such as craftsmanship, scarcity, and clienteling, into hard metrics: ROIC, reinvestment, and cash conversion.
TL;DR
Use SOTP to separate high-ROIC Houses (Fashion & Leather Goods) from cyclicals (Wines & Spirits) and retail (Sephora/DFS).
Tie every multiple or DCF driver to evidence: ROIC > WACC, margin durability, cash conversion, and per‑share discipline.
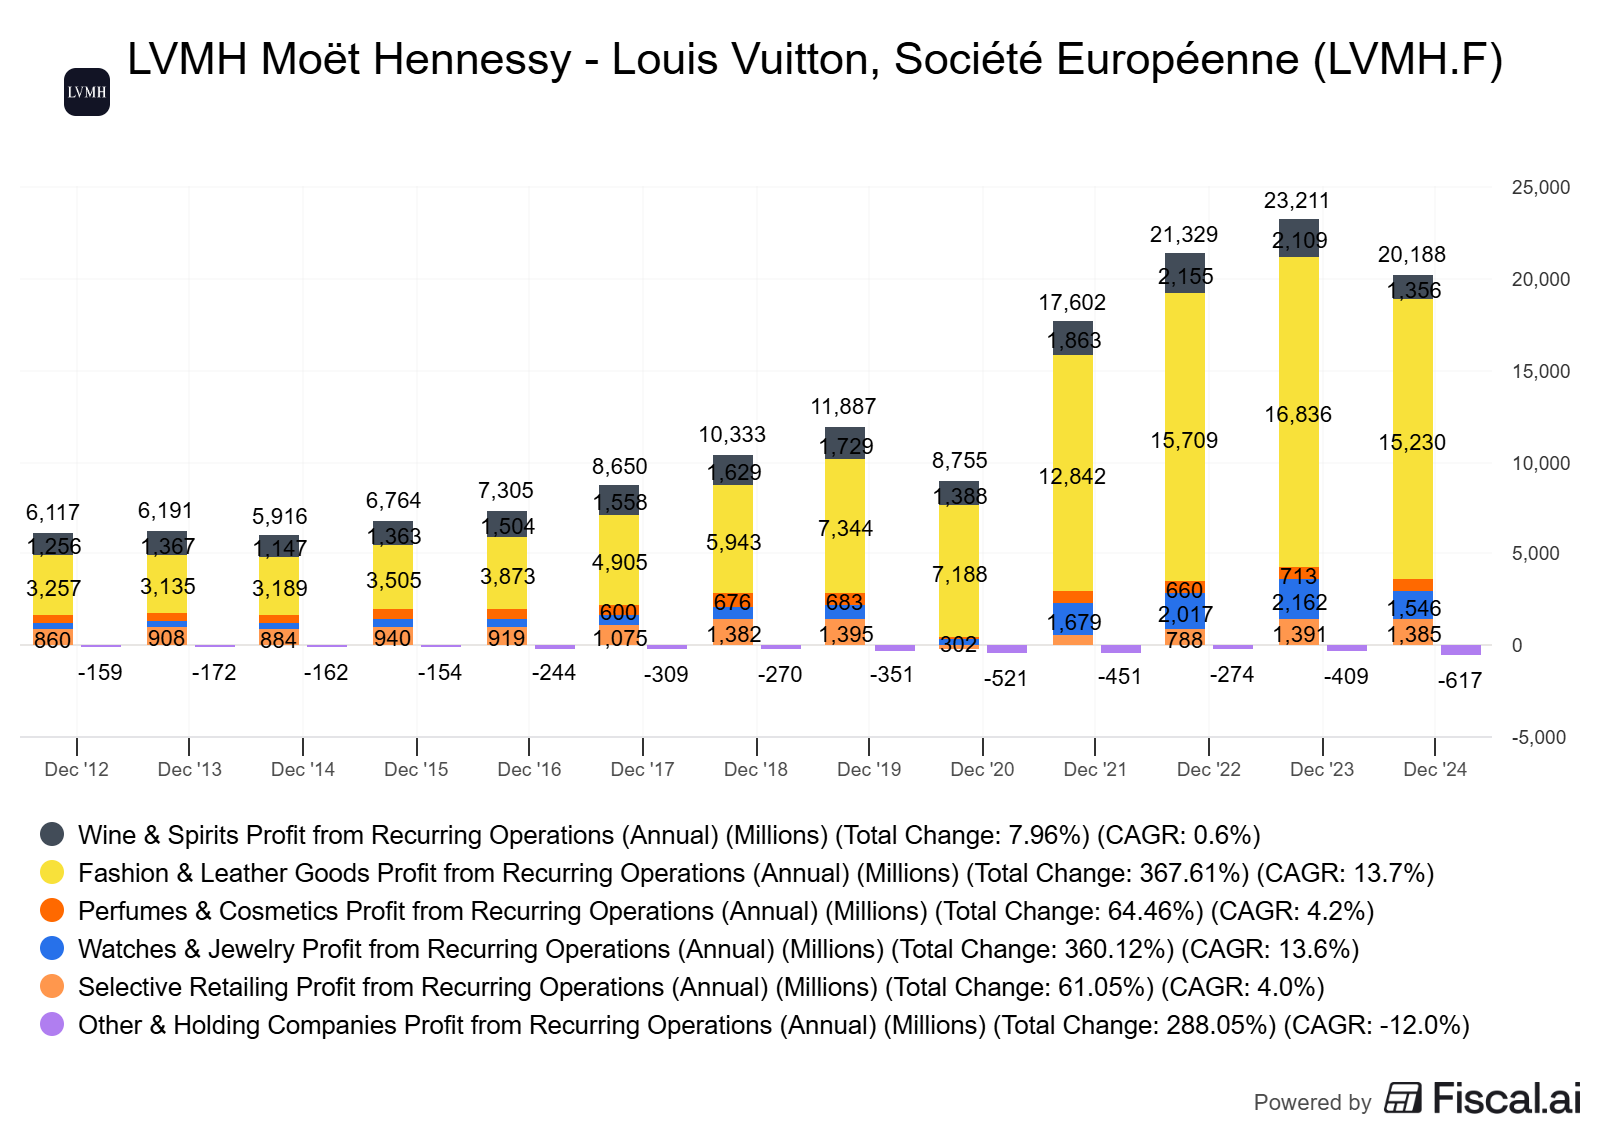
Start with FY2024 anchors: revenue €84.7B, operating margin 23.1%, operating FCF ~€10.5B, segment profits disclosed by LVMH.
Build three scenarios with explicit levers (top-line, margins, capex/working capital, reinvestment cadence) and a WACC range.
Common traps include overpaying for a “brand” without proof of pricing power/retention, ignoring DFS cyclicality, and double-counting network effects.
End with a checklist you can rerun for any multi-brand luxury group.
Why it matters
Conglomerates hide dispersion. In luxury, dispersion is extreme: Louis Vuitton-level economics can coexist with capital-intensive travel retail or the normalization of cognac. A blended multiple misses this. SOTP forces you to:
Attribute value to each business with its true driver set and base rates.
Avoid paying “Vuitton multiples” for DFS or Wines & Spirits.
Tie valuation to economics (ROIC – WACC, FCF conversion) rather than narratives.
Base rates and context:
LVMH FY2024 revenue €84.7B; profit from recurring operations €19.6B; operating margin 23.1%; operating FCF ~€10.5B (as of 2024, reported Jan 28, 2025) LVMH press release.
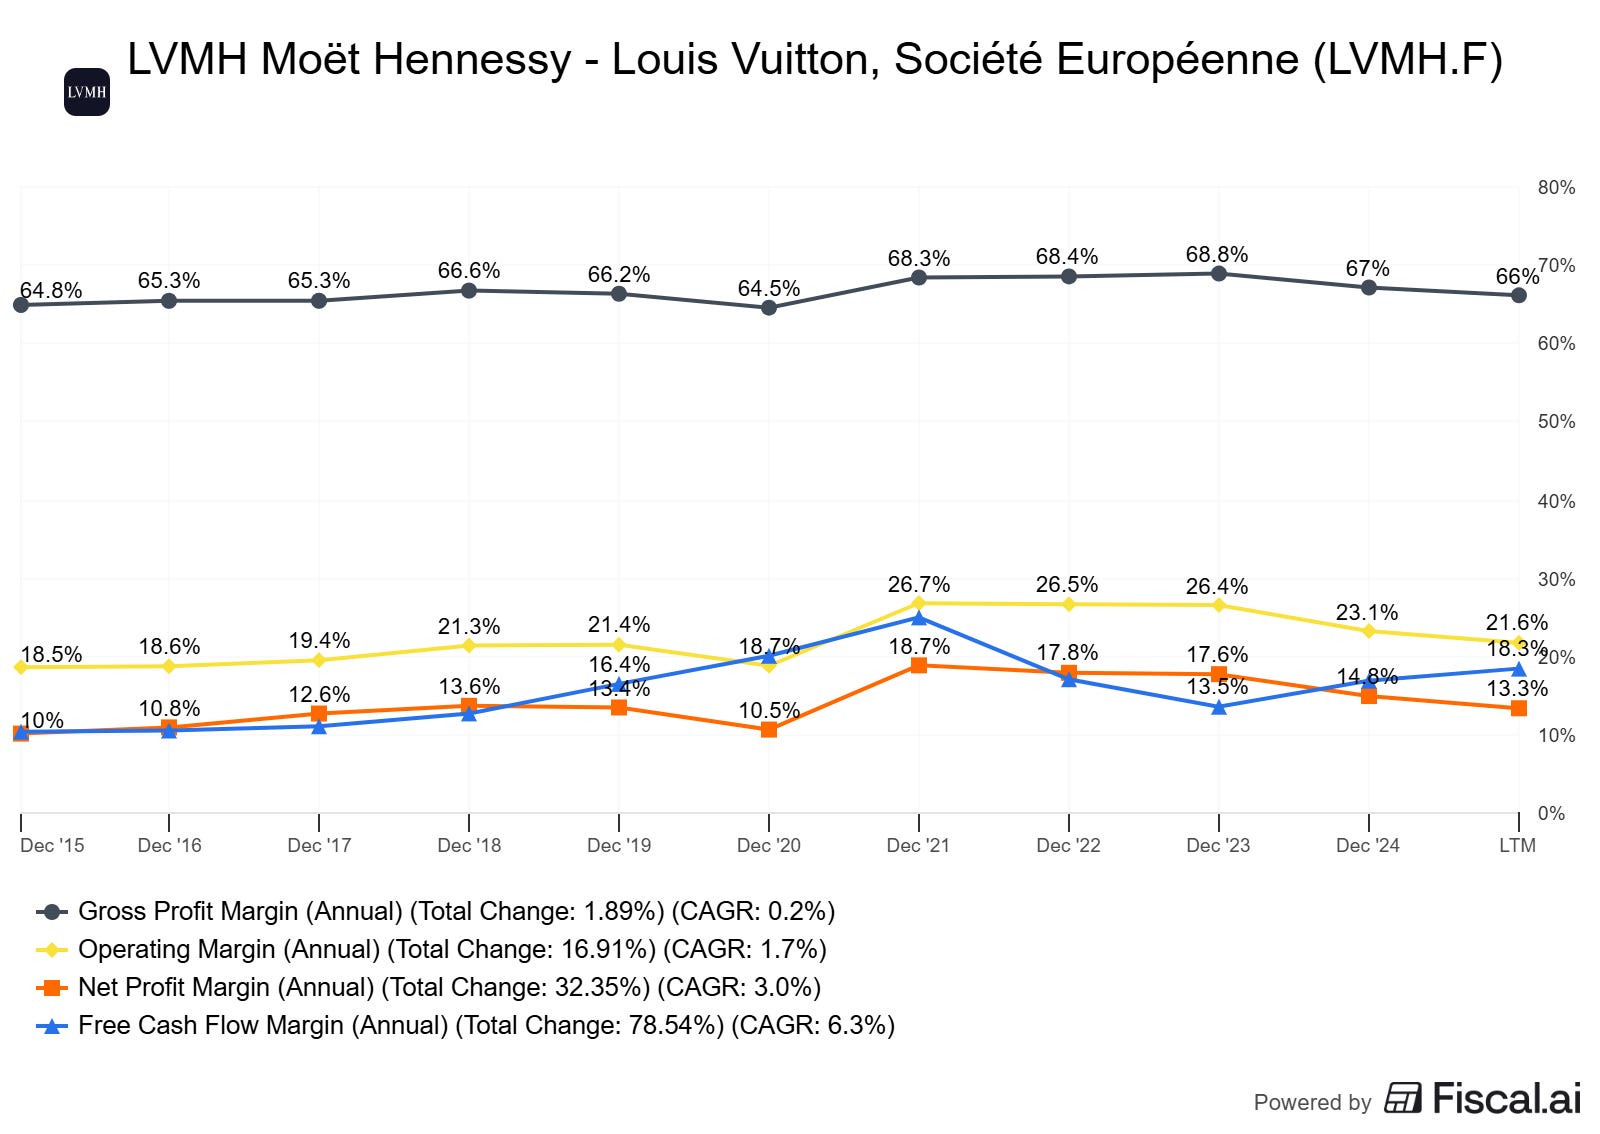
Segment profits 2024 (in €m): F&LG €15,230; Perfumes & Cosmetics €671; Watches & Jewelry €1,546; Selective Retailing €1,385; Wines & Spirits €1,356 (as of FY2024) LVMH investors & analysts key figures.
Industry backdrop: personal luxury goods dipped ~2% in 2024 to ~€363B at current FX; longer-term growth remains intact but performance is polarized; beauty/jewelry resilient, China slowed, Japan/Europe/US mixed (as of Nov 2024–Jun 2025) Bain-Altagamma study and Bain press release.
Where investors go wrong:
Treating all Houses as equal “brands.”
Using a single multiple for the group.
Ignoring working capital swings (especially DFS) and SBC/dilution.
Over-indexing to one region (e.g., China) without stress-testing hedges (tourism, Japan, US).
Core concepts (quality lens)
ROIC vs WACC and value creation
ROIC measures after-tax operating profit over invested capital. WACC is your blended required return.
Value creation happens when ROIC – WACC > 0, and growth is funded at an attractive incremental ROIC.
In luxury, brand power + tight control of distribution can yield high ROIC with low capital intensity (especially in leather goods).
Definition:
ROIC = NOPAT / Invested Capital, where NOPAT = EBIT × (1 – tax rate).
Invested Capital = Net working capital + Net PP&E + Other operating assets – Operating liabilities.
Decision rule:
Prefer segments with ROIC – WACC > 5% sustained, and evidence of incremental ROIC stability.
Reinvestment runway and capital intensity
Reinvestment runway = capacity to redeploy FCF at high incremental ROIC (e.g., store densification, category extensions, geographic expansion).
Fashion & Leather Goods has a large runway via clienteling, VICs (Very Important Clients), and adjacent categories. Wines & Spirits is more cyclical and asset-tied. Selective Retailing (Sephora) reinvests in stores, digital experiences, and last-mile delivery.
Decision rule:
Reward segments with reinvestment avenues that don’t dilute ROIC (e.g., LV store renovations vs. heavy capex plant builds).
Unit economics and per-share metrics
Unit economics: SKU-level margin, ticket size, sell-through, and repeat rates inform the sustainability of gross margins and SGA leverage.
Per-share framing: Track FCF/share, EPS/share, and share count. In European luxury, SBC tends to be lower than in the US tech sector, but consider dilution versus buybacks and M&A issuance.
Decision rule:
Prefer businesses with stable or rising FCF margin and improving FCF/share with minimal dilution.
Moat durability and evidence (not claims)
“Soft moats” are real but must be evidenced:
Desirability and cultural relevance: watch retention, waitlists, secondary market pricing.
Scarcity management: controlled distribution, iconic lines with replenishment discipline.
Craftsmanship and savoir-faire: limited throughput but pricing power and brand equity.
Distribution power: mono-brand stores, clienteling, and data loops via retail (Sephora excellence).
Evidence checklist:
Margin stability through cycles.
Low promo cadence.
Stable/expanding gross margin despite FX pressure.
Strong like-for-like (LFL) sales were disclosed.
Mode focus: Valuation frameworks
Use a hybrid approach:
SOTP by business group using EV/EBIT or DCF, with segment-specific drivers.
Calibrate multiple scenarios with comparable data and historical medians; test sensitivity to WACC, FX, margins, and China exposure.
Build three scenarios (Bear/Base/Bull) on organic growth, margin bands, and capex/working capital.
Worked example or mini case
We’ll value LVMH’s five reportable groups (based on FY2024). Source anchors:
Group: revenue €84.7B; operating margin 23.1%; operating FCF ~€10.5B (as of FY2024) LVMH press.
Segment profit from recurring operations (EBIT proxy), FY2024 (as of FY2024) LVMH investors & analysts:
Fashion & Leather Goods (F&LG): €15,230m
Perfumes & Cosmetics (P&C): €671m
Watches & Jewelry (W&J): €1,546m
Selective Retailing: €1,385m
Wines & Spirits (W&S): €1,356m
We’ll translate “soft moats” to valuation choices:
F&LG: premium economics (iconic Houses, high ROIC, low cap intensity).
P&C: resilient category with strong beauty momentum; lower margins than F&LG, capex-light.
W&J: cyclical with high brand dispersion (Tiffany, Bvlgari strong); capex moderate; pricing power variable by collection.
Selective Retailing (Sephora/DFS): Sephora is a standout operator; DFS is cyclical/tourism-exposed.
W&S: normalizing post-Covid; FX-sensitive; capital intensity higher; category headwinds in cognac.
Illustrative Base Case multiples (not recommendations; cross-check with comps like Richemont, Kering, Estée Lauder, Ulta Beauty, Pernod Ricard/Diageo):
F&LG: 20–24x EBIT
P&C: 14–17x EBIT
W&J: 16–20x EBIT
Selective Retailing: 14–18x EBIT (Sephora deserves high end; DFS low end)
W&S: 12–15x EBIT
Apply mid-range Base Case:
F&LG: 22x × €15,230m ≈ €335B EV
P&C: 15.5x × €671m ≈ €10.4B EV
W&J: 18x × €1,546m ≈ €27.8B EV
Selective Retailing: 16x × €1,385m ≈ €22.2B EV
W&S: 13.5x × €1,356m ≈ €18.3B EV
SOTP EV ≈ €413.7B before corporate items/adjustments.
Add/Subtract:
Corporate/eliminations EBIT (FY2024 “Other activities and eliminations”: -€617m). Assign negative value via a capitalized drag at 12x: -€7.4B EV (or handle via group-level net debt).
Net debt: FY2024 net financial debt €9.2B (as of FY2024) LVMH press.
Equity value rough-in: EV minus net debt ≈ €413.7B - €9.2B - €7.4B ≈ €397B.
Per-share framing:
Use current shares outstanding from the Universal Registration Document to translate to equity value per share (€397 divided by 500 million shares equals €798 per share) LVMH investors.
Caveats and alt views:
If you believe W&J structurally merits >20x (high jewelry premium, Tiffany turnaround), upside exists.
If you’re conservative on DFS recovery or China exposure, cut Selective Retailing multiple to 12–14x on the DFS mix portion.
FX can swing EBIT and perceived growth; triangulate with multi-currency disclosures.
Historical context:
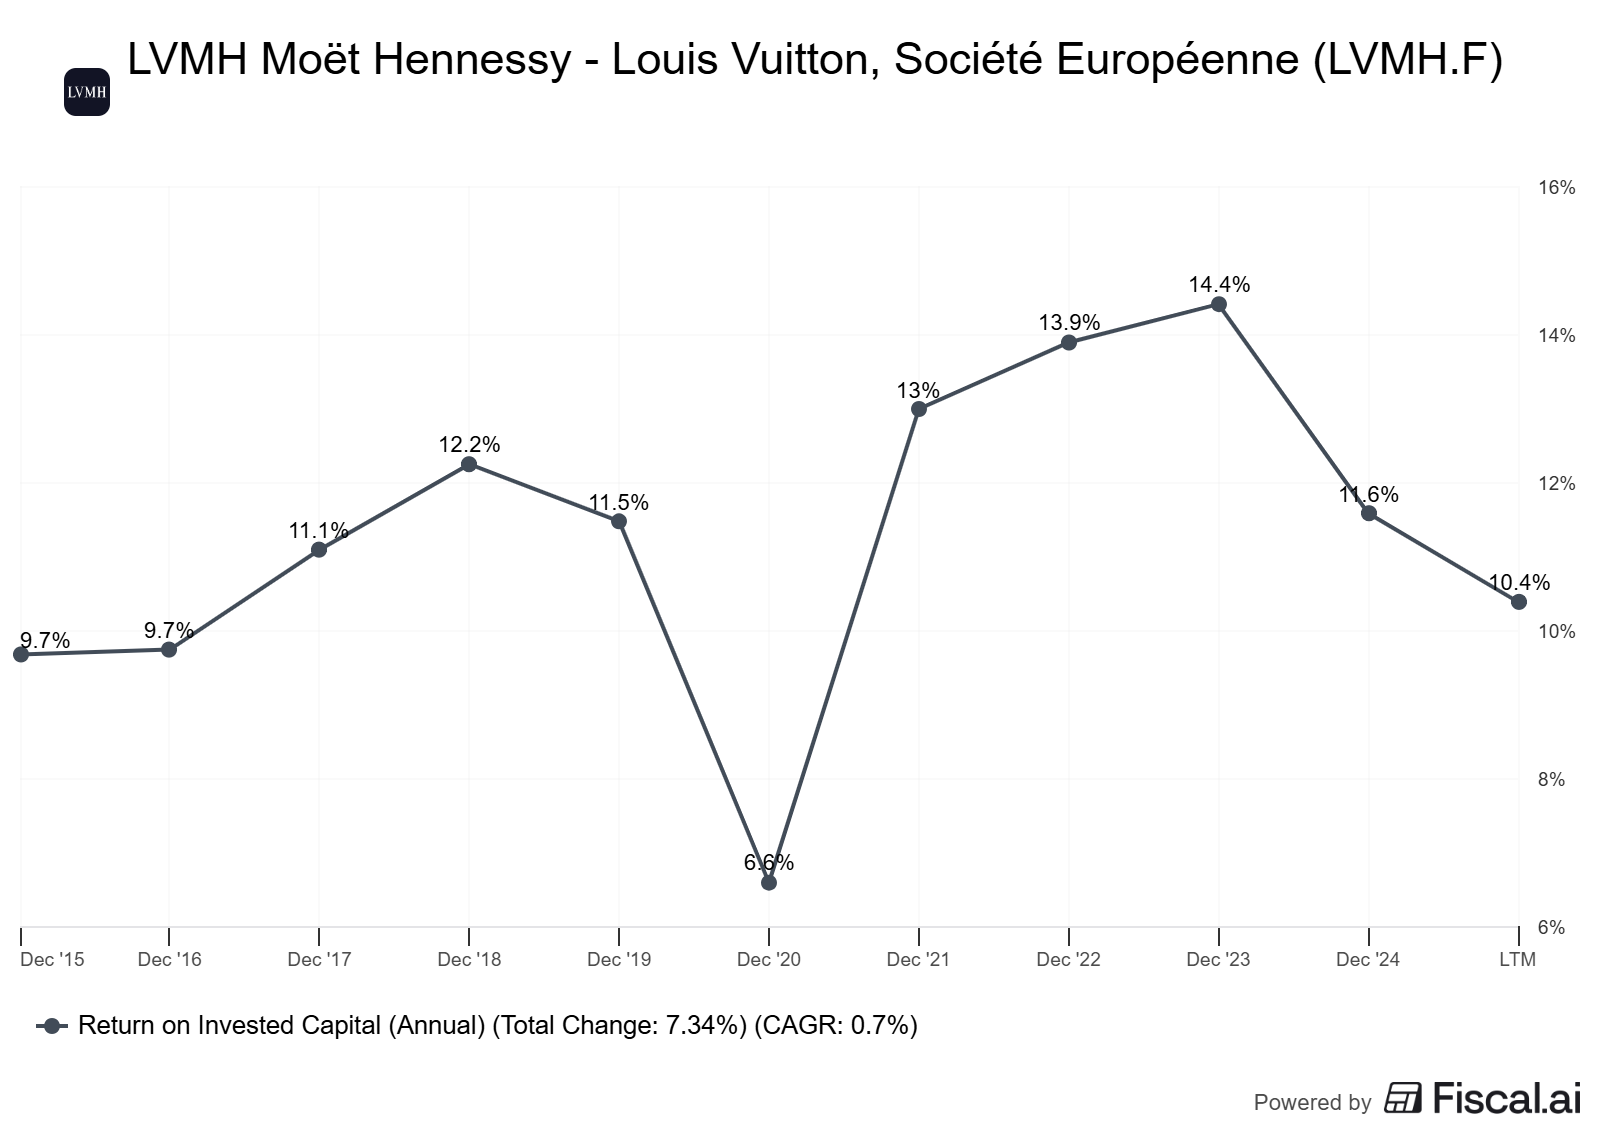
2017 operating margin was 19.5% with free cash flow ~€4.8B (as of 2017) LVMH 2017 press.
2024 operating margin 23.1%, operating FCF ~€10.5B (as of FY2024) LVMH press.
How to do this yourself
Step-by-step:
Gather data
FY and segment EBIT, revenue mix, region mix: LVMH investors & analysts pages and 2024 Annual Report (as of 2024) LVMH investors & analysts.
Group-level FCF and net debt: LVMH press release FY2024.
Historical context: older press releases (e.g., 2017) for trend anchors LVMH 2017 results.
Industry backdrop: Bain-Altagamma insights and press release.
Define WACC and FX
Use a Euro WACC base 8.5% with a sensitivity band 7–10%. Justify with risk-free (Euro sovereign ~2–3% historically), ERP 5–6%, beta 1.0–1.2, and modest net debt. Stress-test FX (USD/EUR, JPY/EUR, CNY/EUR) on EBIT.
Build SOTP
Set segment EBIT base and apply a multiple range per segment aligned to quality, durability, and cyclicality.
Cross-check ranges vs comps. Decision rule: premium multiples for segments with ROIC – WACC >5%, stable margins, strong FCF conversion.
Scenarios (3)
Bear: lower organic growth (flat to -2%), margin compression 100–200 bps, slower DFS recovery, WACC +100 bps.
Base: 2–4% organic, stable margins, DFS stabilizing, WACC 8.5%.
Bull: 4–6% organic, mix/pricing lift keeps or expands margins, DFS recovers, WACC -100 bps.
5. Per-share framing
Translate to equity value per share using the current diluted share count; adjust for net debt—track dilution/buybacks in the URD.
Decision rules and thresholds
Prefer sustained ROIC – WACC >5% and FCF margin >12%.
Discount segments with high macroeconomic and foreign exchange exposure unless visibility improves.
Demand evidence of pricing power (gross margin resilience) and controlled distribution (markdown discipline) to pay premium multiples.
Pitfalls and false positives
Treating DFS like Sephora. One is cyclical/travel-exposed; the other is a structurally advantaged beauty retailer.
“Iconic” without data. Require evidence: waitlists, resale premiums, category pricing without mix shifts.
Overlooking working capital. Luxury retail can sit on inventory; watch CCC trends.
Double-counting synergies across segments in SOTP. Keep them conservative or at corporate level.
Assuming China re-accelerates evenly. The market is polarized and promotional in some areas; consider triangulating with Japan/Europe/US offsets.
Checklist / one-pager
Pull FY and segment EBIT; confirm with the latest press release and Annual Report.
Compute ROIC by segment where possible; otherwise, infer via margin + capital turns.
Score moats: pricing power, scarcity, clienteling, distribution control.
Assign multiples by segment with comps and history; document rationale.
Build Bear/Base/Bull with explicit levers; run WACC and FX sensitivities.
Convert to equity value per share and verify the share count/dilution.
Sanity check vs historical EV/EBIT and EV/FCF bands.
Read footnotes: currency effects, one-offs, eliminations.
Glossary
ROIC: Return on Invested Capital; NOPAT / Invested Capital.
WACC: Weighted Average Cost of Capital; blended required return for debt + equity.
SOTP: Sum-of-the-Parts valuation; valuing each segment separately.
Operating FCF: Cash generated after operating needs (often defined by company; confirm definition).
CCC: Cash Conversion Cycle; DSO + DIO – DPO.
LFL: Like-for-like sales growth; same-store growth adjusting for openings/closures.
VIC: Very Important Client; top-tier luxury clients with high repeat spend.
Further reading
Bain-Altagamma Luxury Market insights on 2024–2025 dynamics and polarization (as of Nov 2024–Jun 2025): Snap Chart and Press release.
LVMH FY2024 press materials and key figures (as of Jan 28, 2025): Full year results hub and Investors & analysts.
References
LVMH, “LVMH achieves a solid performance…” press release (as of Jan 28, 2025; FY2024 figures): https://www.lvmh.com/en/publications/lvmh-achieves-a-solid-performance-despite-an-unfavorable-global-economic-environment
LVMH, Investors & Analysts → Key Figures (as of FY2024): https://www.lvmh.com/en/investors/investors-and-analysts
LVMH, 2024 Full Year Results hub (as of Jan 28, 2025): https://www.lvmh.com/en/financial-calendar/2024-full-year-results
LVMH, “2017 Record results” press release (as of Jan 25, 2018): https://www.lvmh.com/en/publications/2017-record-results
Bain & Company, “Luxury Stumbles in 2024…” Snap Chart (as of Nov 2024): https://www.bain.com/insights/luxury-stumbles-in-2024-but-can-still-return-to-solid-growth-snap-chart/
Bain & Company, “Luxury confronts slowdown…” press release (as of Jun 19, 2025): https://www.bain.com/about/media-center/press-releases/20252/luxury-confronts-slowdown-amid-economic-headwinds-and-market-disruptions-while-industry-resilience-and-strong-fundamentals-underpin-future-prospects/