
How to Value a Conglomerate: Sum of the Parts Analysis Using Berkshire Hathaway

Why do some of the world’s best investors love conglomerates while others avoid them completely? The answer often comes down to one thing: whether you can see through the complexity to value each business on its own merits.
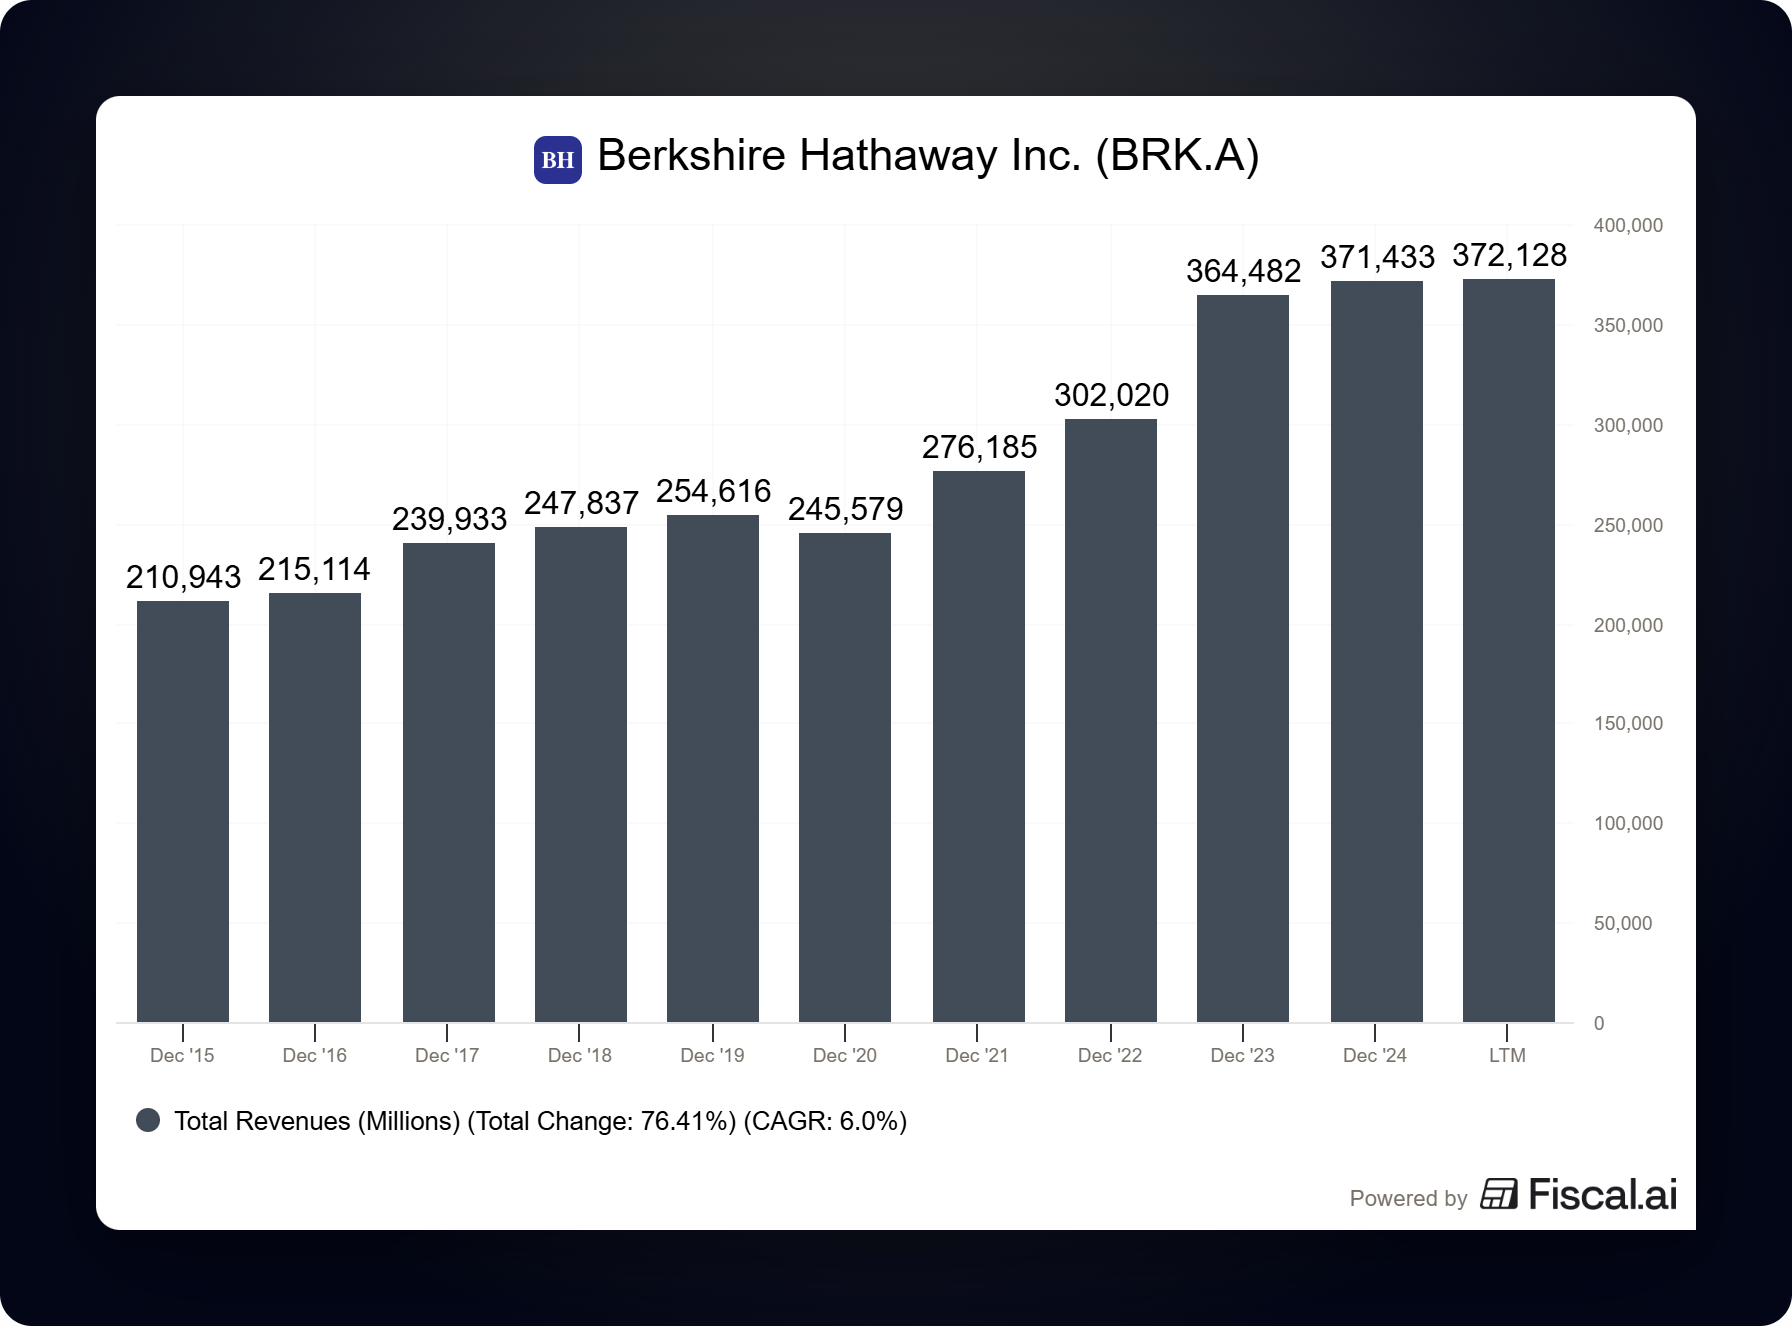
In this article, I’ll walk you through the Sum of the Parts (SOTP) valuation method, designed specifically for companies operating multiple distinct businesses. You’ll learn how to break down a conglomerate, value each segment independently, and determine if the whole is worth more (or less) than the sum of its parts. We’ll use Berkshire Hathaway as our example because it’s the ultimate test case for this approach.
What is the Sum of the Parts Valuation?
Sum of the Parts valuation is exactly what it sounds like: you value each business segment separately, add them together, and compare that total to the company’s current market value.
Think of it like buying a house with a main residence, a rental unit, and a detached workshop. A cursory appraisal might give you a single price for the entire property. But a smart buyer values each component separately (what’s the main house worth? what rental income does the unit generate? what’s the workshop worth to a buyer?) and then adds them up to see if the asking price makes sense.
The same principle applies to conglomerates. When you have a company running an insurance business, a railroad, an energy company, and dozens of other operations under one roof, valuing the whole thing as a single entity often misses important details.
Why SOTP matters for investors: Conglomerates often trade at a “conglomerate discount” because the market struggles to value complexity. If you can accurately value each part, you might find opportunities where the market has undervalued the whole.
When to Use the Sum of the Parts Valuation
SOTP works best for companies with:
Distinct business segments that operate independently with separate financial reporting. If a company reports detailed segment information in its 10-K, that’s your signal that SOTP might be appropriate.
Different business models across segments that would normally command different valuation multiples. An insurance business deserves different metrics than a railroad, which deserves different metrics than a manufacturing business.
Segments large enough to matter individually. If one segment represents 2% of the total value, don’t spend hours on a detailed valuation. Focus your energy on the segments that move the needle.
SOTP is less useful for companies where business units are deeply integrated and cannot be readily separated. A tech company where the software, hardware, and services all support one another likely doesn’t need SOTP. But a holding company that owns completely separate businesses? That’s SOTP territory.
The SOTP Process: A Step-by-Step Framework
Here’s how you actually do a Sum of the Parts analysis:
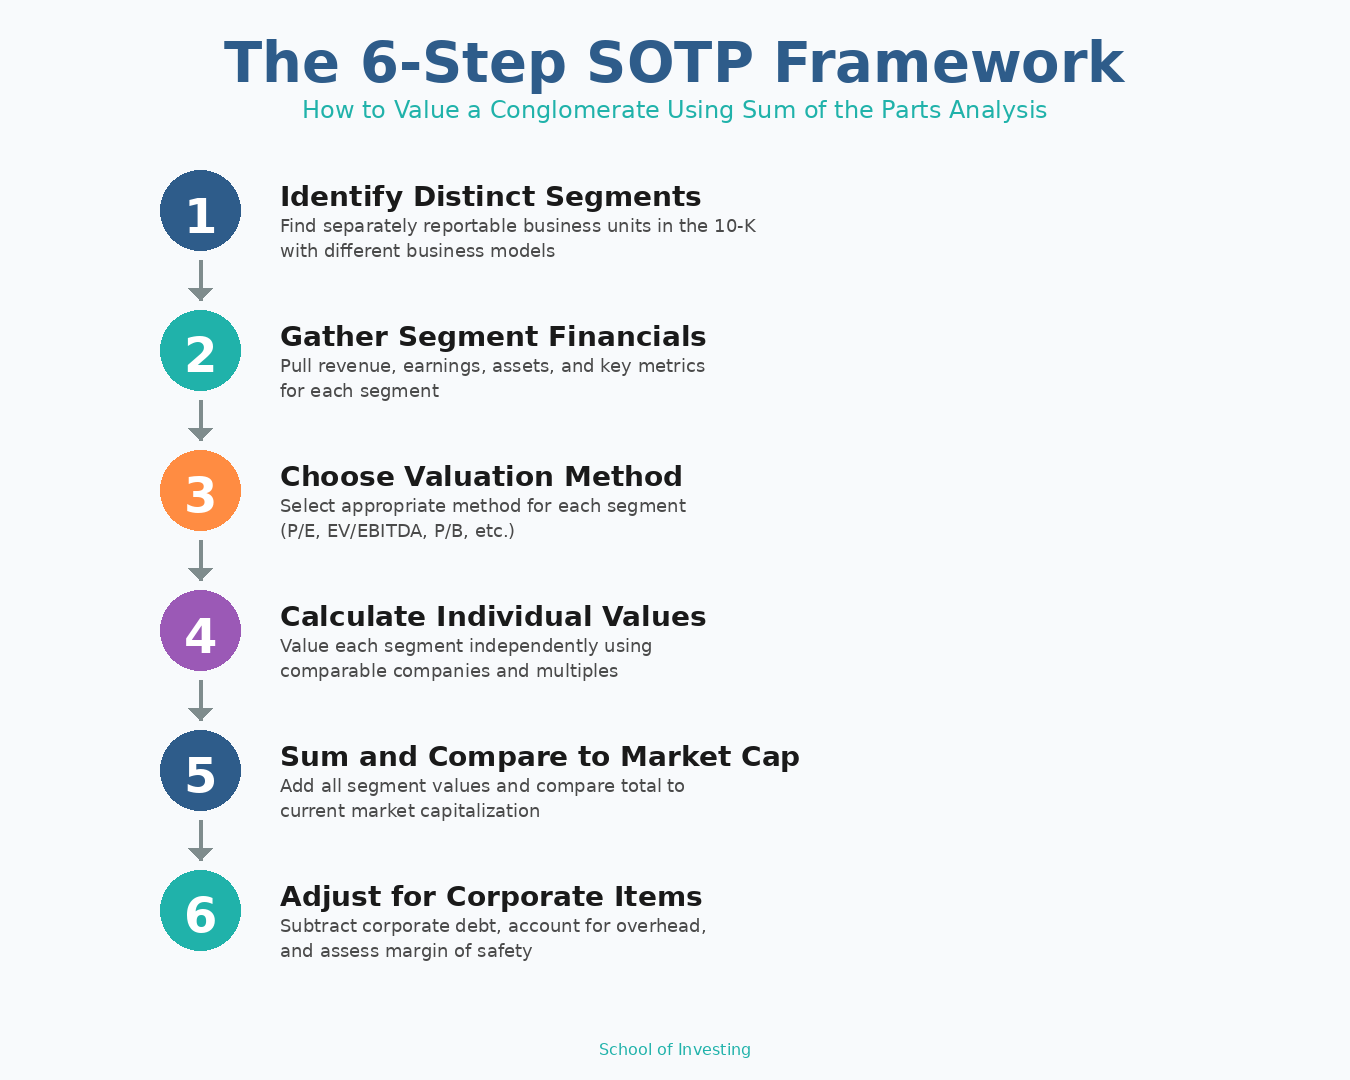
Step 1: Identify the distinct business segments
Start with the company’s 10-K and locate the segment reporting section (typically in the MD&A or a dedicated segment note). Companies are required to break out segments that meet certain materiality thresholds.
For Berkshire Hathaway, the major segments disclosed in their December 31, 2024, 10-K (Note 26, page K-108) include:
Insurance operations (GEICO, Berkshire Hathaway Primary Group, Berkshire Hathaway Reinsurance Group)
BNSF Railway (railroad)
Berkshire Hathaway Energy (BHE)
Manufacturing
Service and Retailing
Pilot Travel Centers
McLane Company
Each operates largely independently and has distinct economic characteristics.
Step 2: Gather financial data for each segment
Pull the key metrics for each segment from the 10-K. You typically want:
Revenue by segment
Operating earnings or pre-tax earnings by segment
Assets allocated to each segment (if disclosed)
Any segment-specific metrics that matter (for insurance: float, combined ratio; for railroads: operating ratio, etc.)
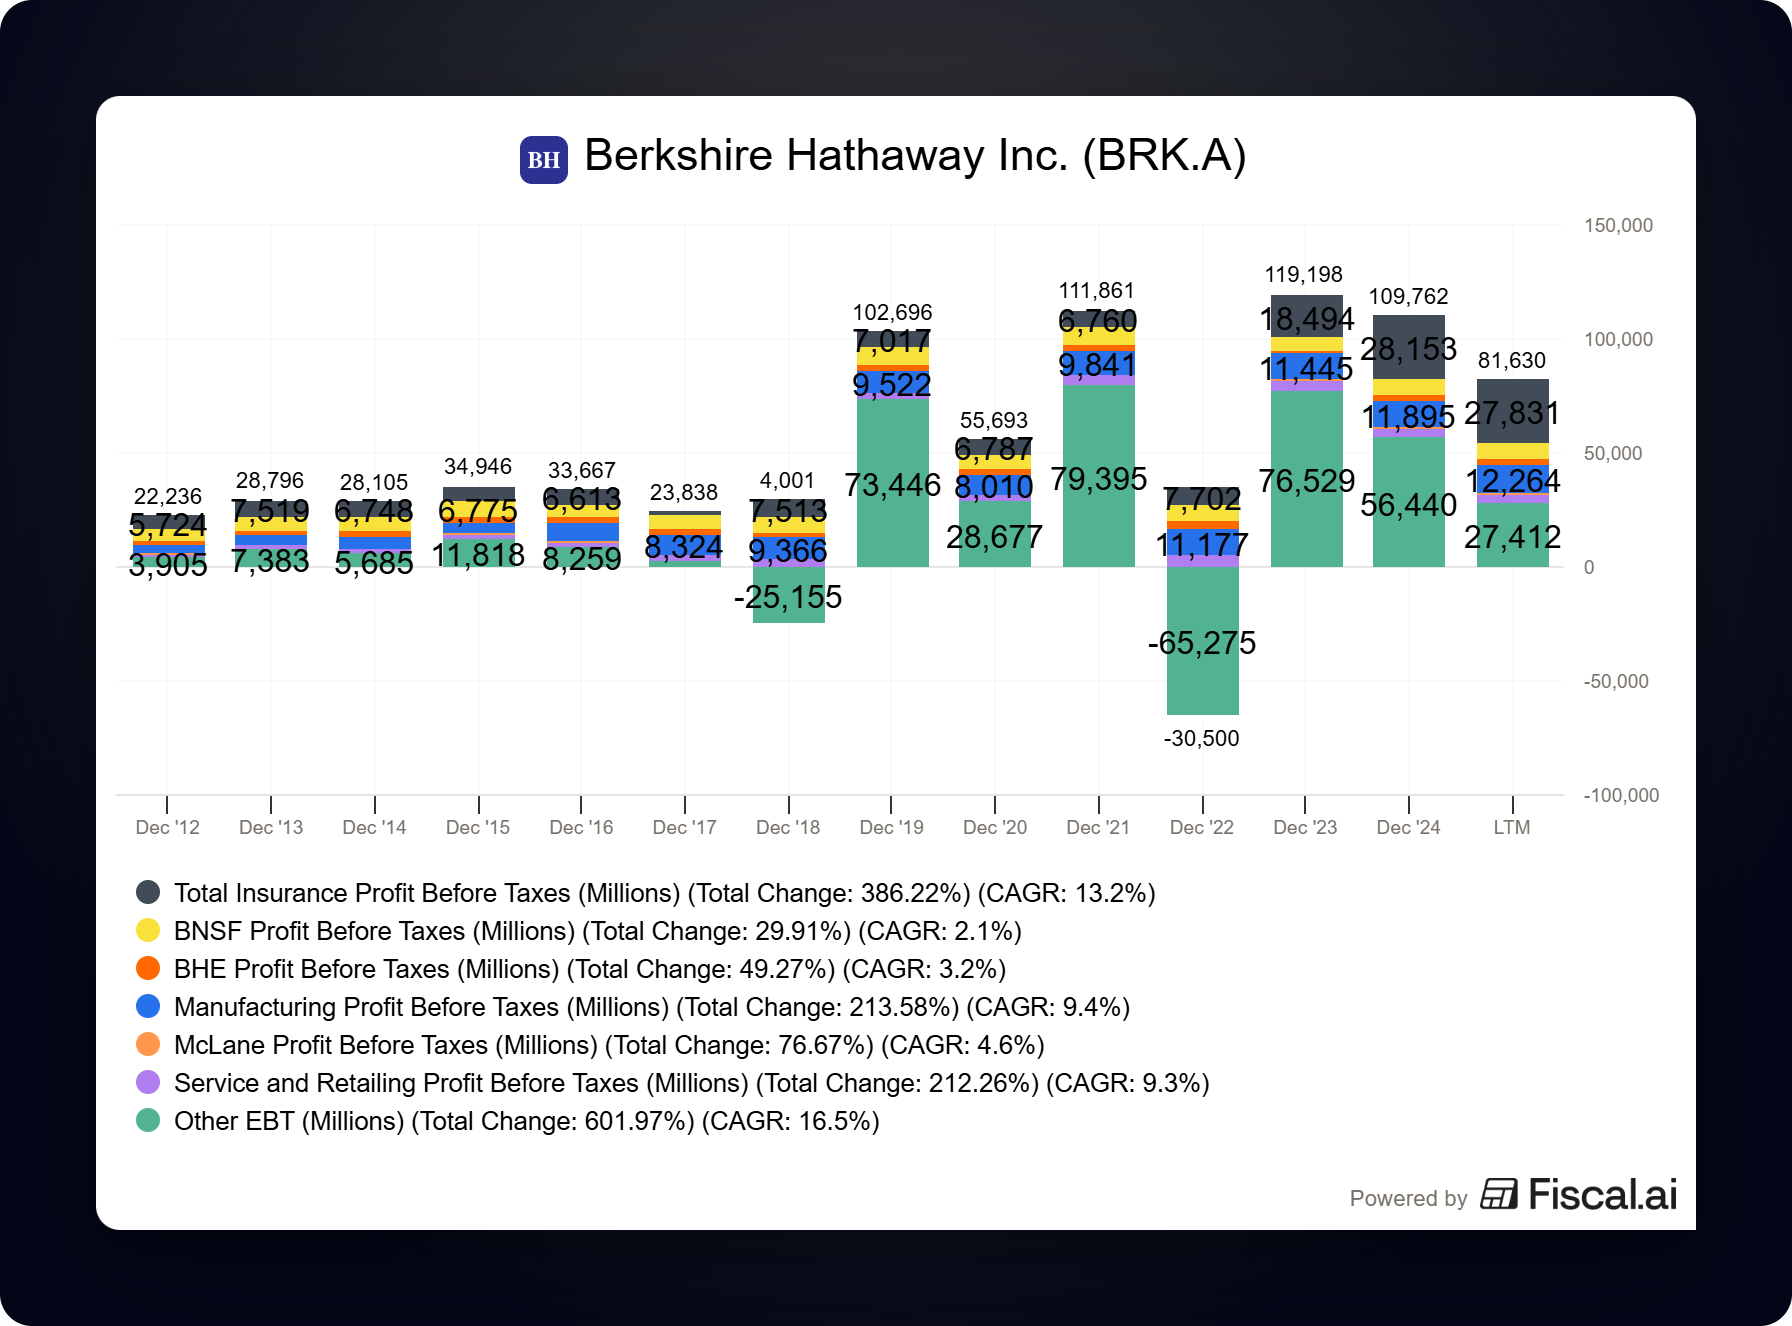
According to Berkshire’s 2024 10-K (Note 26, page K-110 to K-112), here are the 2024 segment earnings before income taxes:
Insurance Operations:
Total pre-tax earnings (including investment income): $28,153 million
Underwriting pre-tax earnings: $11,405 million
Investment income: $16,748 million
Insurance float (from page 8): approximately $171 billion as of December 31, 2024
BNSF Railway:
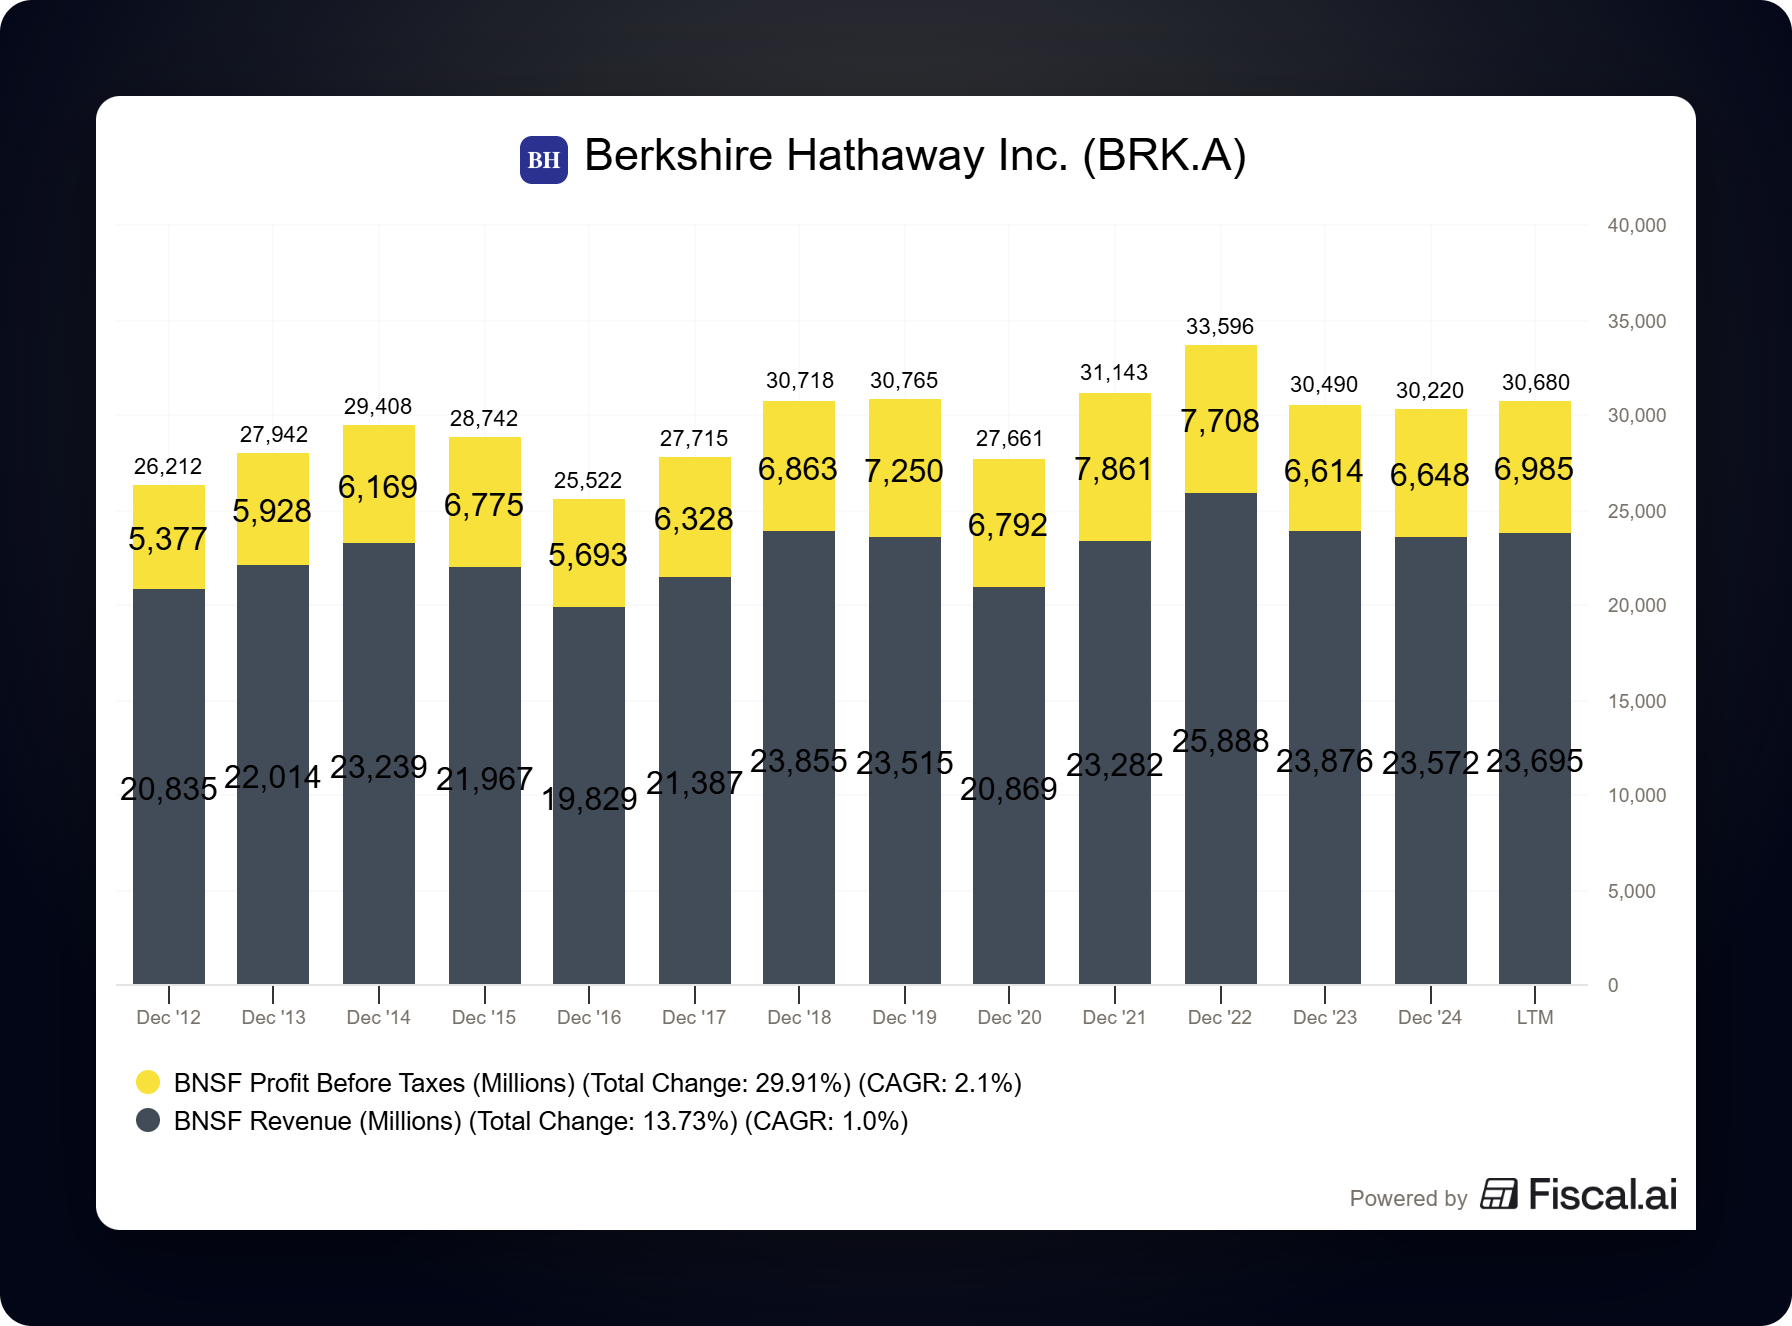
Revenues: $23,572 million
Pre-tax earnings: $6,648 million
Outstanding debt (from page 74): $23.5 billion
Berkshire Hathaway Energy:
Revenues: $26,348 million
Pre-tax earnings: $2,292 million
Outstanding debt (from page 74): $56.4 billion
Manufacturing:
Revenues: $77,231 million
Pre-tax earnings: $11,895 million
Service and Retailing:
Revenues: $39,874 million
Pre-tax earnings: $3,700 million
Pilot Travel Centers:
Revenues: $46,891 million
Pre-tax earnings: $614 million
McLane Company:
Revenues: $51,907 million
Pre-tax earnings: $634 million
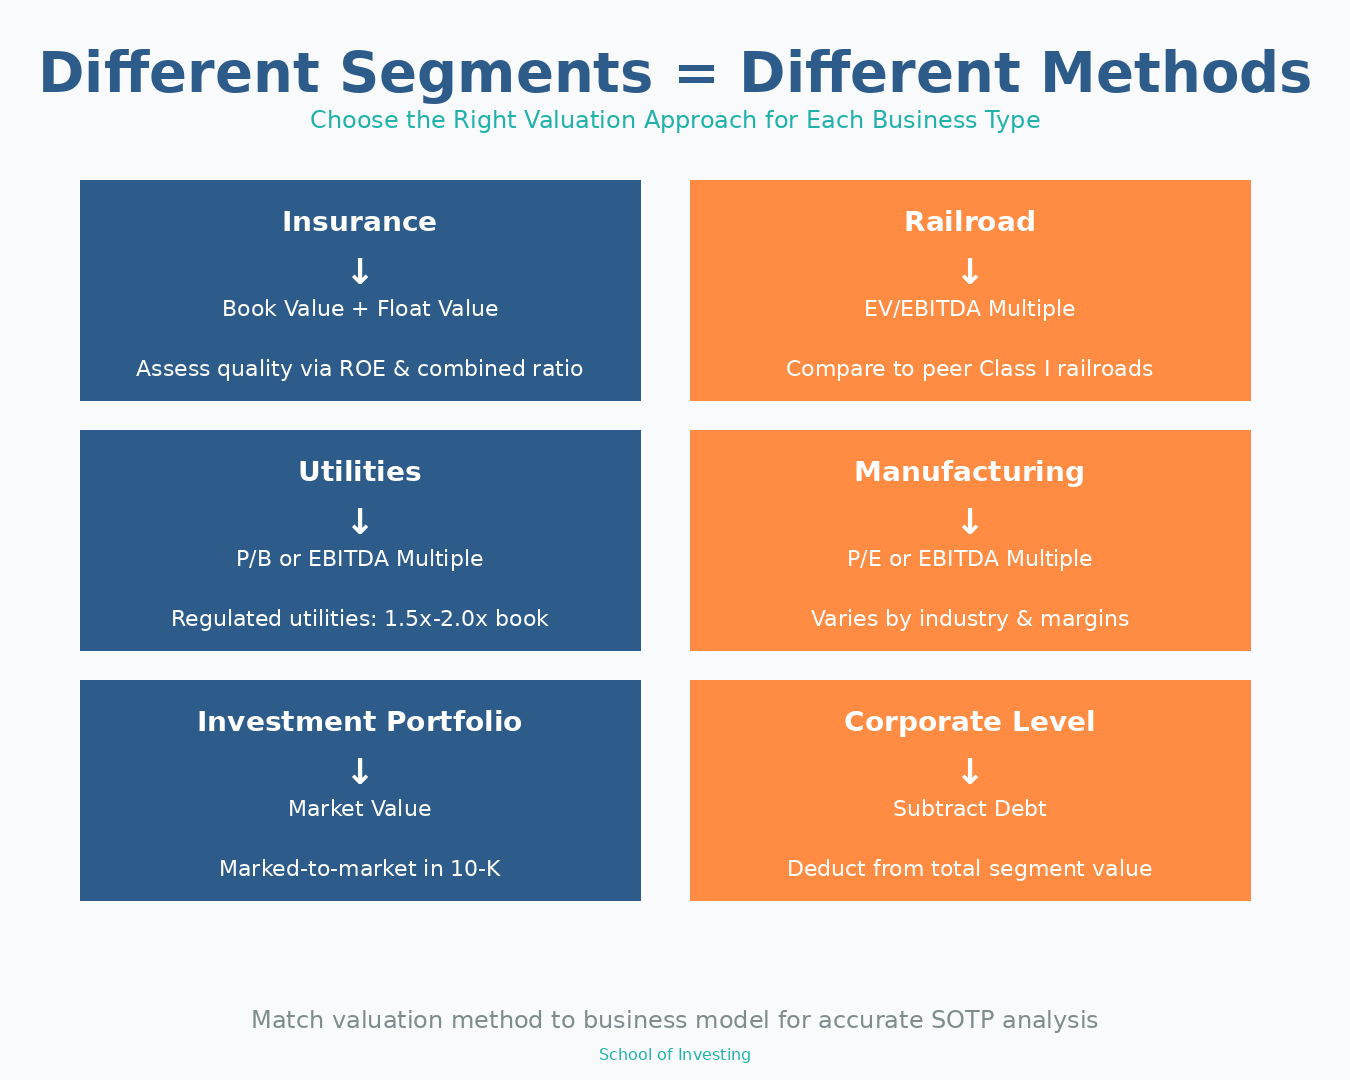
Step 3: Choose the right valuation method for each segment
This is where SOTP gets interesting. Different businesses deserve different valuation approaches:
For insurance operations, you typically value based on:
Book value of equity plus
Value of the insurance float (the money they hold from premiums before paying claims)
Historical return on equity to assess quality
For BNSF Railway, you might use:
EV/EBITDA multiples compared to other Class I railroads (Union Pacific, Norfolk Southern, CSX)
P/E multiples if you prefer earnings-based valuation
Operating ratio benchmarks (lower is better for railroads)
For Berkshire Hathaway Energy, you could use:
Regulated utilities typically trade at 1.5x to 2.0x book value
Or use a P/E multiple compared to other utility companies
For Manufacturing, Service, and Retailing, you might use:
EBITDA multiples are appropriate for the specific industries within each bucket
These are tricky because they’re collections of diverse businesses
For the investment portfolio:
This one’s straightforward: it’s marked to market
The exact value is disclosed in the 10-K
Step 4: Calculate the value of each segment
Let me walk through the actual valuation using Berkshire’s 2024 data:
Insurance Operations Value:
According to Berkshire’s balance sheet (page K-66), total shareholders’ equity was $649.4 billion as of December 31, 2024. A significant portion of this belongs to the insurance operations, though Berkshire doesn’t break out insurance-specific equity in their segment reporting.
For insurance operations, you need to consider:
The book value of insurance equity
The value creation from float
The quality of underwriting
Berkshire’s insurance operations generated $11.4 billion in underwriting profit in 2024 on approximately $171 billion of float. This represents a negative cost of float (they actually made money on underwriting while holding the float for investment). This is exceptionally rare and valuable.
High-quality insurers with consistent underwriting profits and low combined ratios might trade at 1.2x to 1.5x book value. Given Berkshire’s track record, a premium to book value is justified, but the exact allocation of Berkshire’s total book value to insurance vs. other segments requires detailed work.
BNSF Railway Value:
BNSF generated $6.6 billion in pre-tax earnings in 2024. To calculate enterprise value, we need to add back interest and either use EBITDA or apply a P/E multiple.
From the income statement (page K-110), BNSF’s costs included:
Depreciation and amortization: $2,621 million
Interest expense: $1,078 million
EBITDA = Pre-tax earnings + Interest + Depreciation = $6,648M + $1,078M + $2,621M = $10,347 million
Comparable railroads (Union Pacific, CSX, Norfolk Southern) typically trade at 10x to 12x EBITDA depending on market conditions. Using a conservative 10x multiple:
BNSF Enterprise Value = $10.3B × 10 = $103 billion
Subtract net debt: BNSF has $23.5 billion in debt. If we assume minimal cash at the railroad level, BNSF equity value = $103B - $23.5B = approximately $79.5 billion
Berkshire Hathaway Energy Value:
BHE earned $2.3 billion in pre-tax earnings in 2024, down significantly from $3.1 billion in 2022. The decline relates to wildfire liabilities and other operational challenges.
From page K-111:
Depreciation and amortization: $3,957 million
Interest expense: $2,528 million
EBITDA = $2,292M + $2,528M + $3,957M = $8,777 million
Regulated utilities typically trade at 8x to 10x EBITDA. Given BHE’s challenges with wildfire exposure and regulatory issues, let’s use 8x:
BHE Enterprise Value = $8.8B × 8 = $70 billion
Subtract debt: BHE has $56.4 billion in debt BHE equity value = $70B - $56.4B = approximately $13.6 billion
Alternatively, utilities often trade at 1.5x to 2.0x book value. You’d need to extract BHE’s specific book value from the segment assets to use this method.
Manufacturing Value:
Manufacturing generated $11.9 billion in pre-tax earnings in 2024 from $77.2 billion in revenue. This segment comprises dozens of businesses, making it challenging to value precisely.
Without detailed EBITDA breakouts, we can use a P/E approach. Manufacturing businesses typically trade at 12x to 15x earnings depending on quality and growth. Using a conservative 12x on after-tax earnings (assuming a 21% tax rate):
After-tax earnings = $11.9B × (1 - 0.21) = $9.4 billion Manufacturing value = $9.4B × 12 = approximately $113 billion
Service and Retailing Value:
Service and Retailing earned $3.7 billion in pre-tax earnings in 2024. Similar to manufacturing, this is a diverse collection of businesses (aircraft services, auto dealerships, furniture leasing, etc.).
Using a 12x after-tax earnings multiple: After-tax earnings = $3.7B × 0.79 = $2.9 billion Service and Retailing value = $2.9B × 12 = approximately $35 billion
Pilot Travel Centers Value:
Pilot earned just $614 million in pre-tax earnings in 2024, down from $968 million in 2023. This is a lower-margin wholesale fuel and travel center business.
Using a 10x after-tax earnings multiple (lower due to thin margins): After-tax earnings = $614M × 0.79 = $485 million Pilot value = $485M × 10 = approximately $4.9 billion
McLane Company Value:
McLane earned $634 million in pre-tax earnings from wholesale food distribution in 2024. This is another low-margin business.
Using a 10x after-tax earnings multiple: After-tax earnings = $634M × 0.79 = $501 million McLane value = $501M × 10 = approximately $5.0 billion
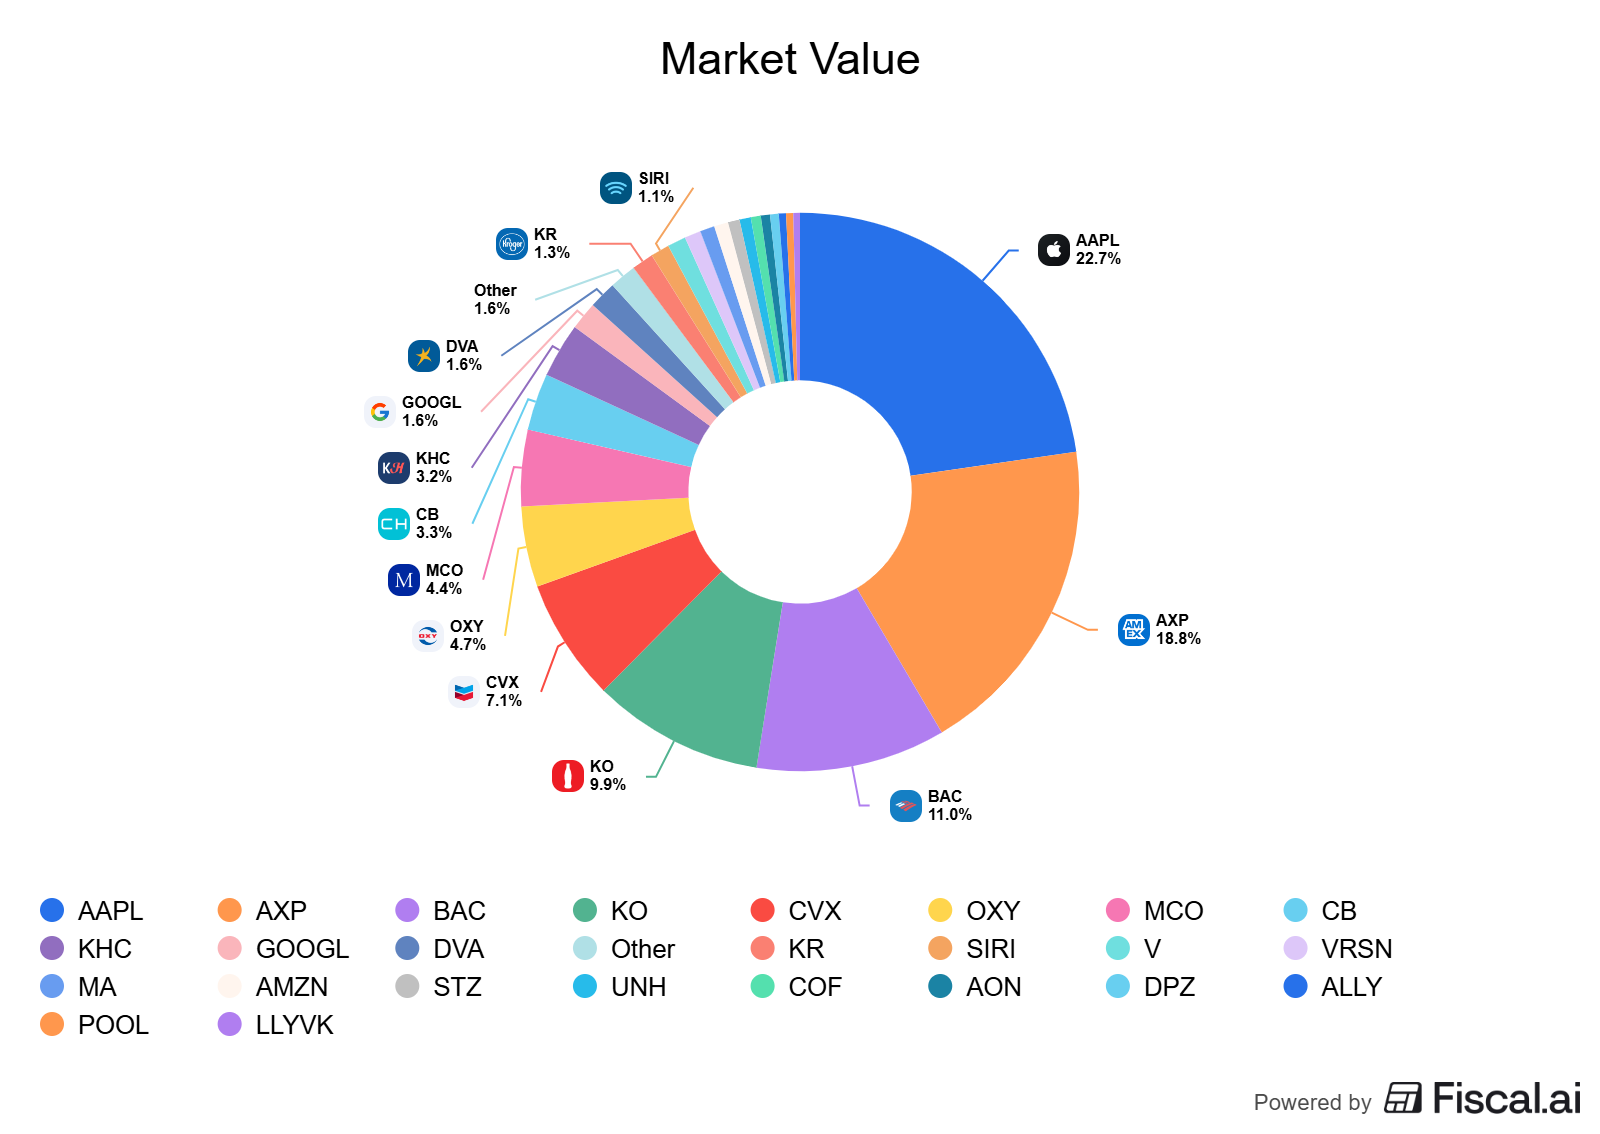
Investment Portfolio Value:
According to Berkshire’s balance sheet (page K-66), as of December 31, 2024:
Cash and cash equivalents: $44,333 million (insurance and other) + $3,396 million (railroad/utilities) = $47.7 billion
Short-term U.S. Treasury Bills: $286,472 million = $286.5 billion
Investments in equity securities: $271,588 million = $271.6 billion
Investments in fixed maturity securities: $15,364 million = $15.4 billion
Total readily marketable investment portfolio = $621.2 billion
Step 5: Add it all up and compare to market cap
Let me create a summary table using conservative midpoint estimates:
Segment Estimated Value (Billions) BNSF Railway $80 BHE $14 Manufacturing $113 Service and Retailing $35 Pilot $5 McLane $5 Investment Portfolio $621 Subtotal (Non-Insurance) $873
The challenge is valuing the insurance operations. Given the complexity and the fact that insurance equity and float are intertwined with the overall capital structure, a full SOTP requires allocating the total $649.4 billion in book value between insurance-attributable equity and equity supporting the other operating businesses.
A simplified approach: If we assume the operating businesses above (BNSF, BHE, Manufacturing, etc.) represent their own equity value and are self-funded, then the remaining book value plus the investment portfolio could be attributed to insurance operations and corporate.
Step 6: Adjust for corporate-level items
Don’t forget to account for:
Corporate debt: Berkshire parent company debt was $21.1 billion as of December 31, 2024 (page 74). This should be subtracted from total value.
Corporate overhead costs: Berkshire’s corporate overhead is famously minimal (around $50-100 million per year), so this doesn’t materially impact valuation.
Tax considerations: Berkshire’s structure is quite tax-efficient. The investment gains are taxed at corporate rates when realized, but much of the value is in unrealized gains.
Above, I’ve shown you the complete framework for valuing a conglomerate using Sum of the Parts analysis, including real 2024 data from Berkshire’s 10-K. Below, I’ll walk you through how to think about the quality adjustments for each Berkshire segment, the common mistakes investors make when applying SOTP, and how to use this method to find mispriced conglomerates in your own research.
