
How to Use ROIIC to Find Great Investments

Finding companies that grow remains easy—finding companies where growth actually creates shareholder value? That’s the challenge.
Every year, countless companies report impressive revenue growth while quietly destroying value through poor capital allocation. They invest billions into expansion, new facilities, or acquisitions that generate returns below their cost of capital. The revenue numbers look exciting in press releases, but shareholders would have been better off if management had returned that capital through dividends or buybacks.
Return on Incremental Invested Capital (ROIIC) cuts through this noise. It reveals whether each dollar management invests into growth generates meaningful returns or burns cash. The metric remains particularly powerful because it focuses on new investments rather than historical performance, showing whether management continues to identify attractive opportunities or is chasing growth for growth’s sake.
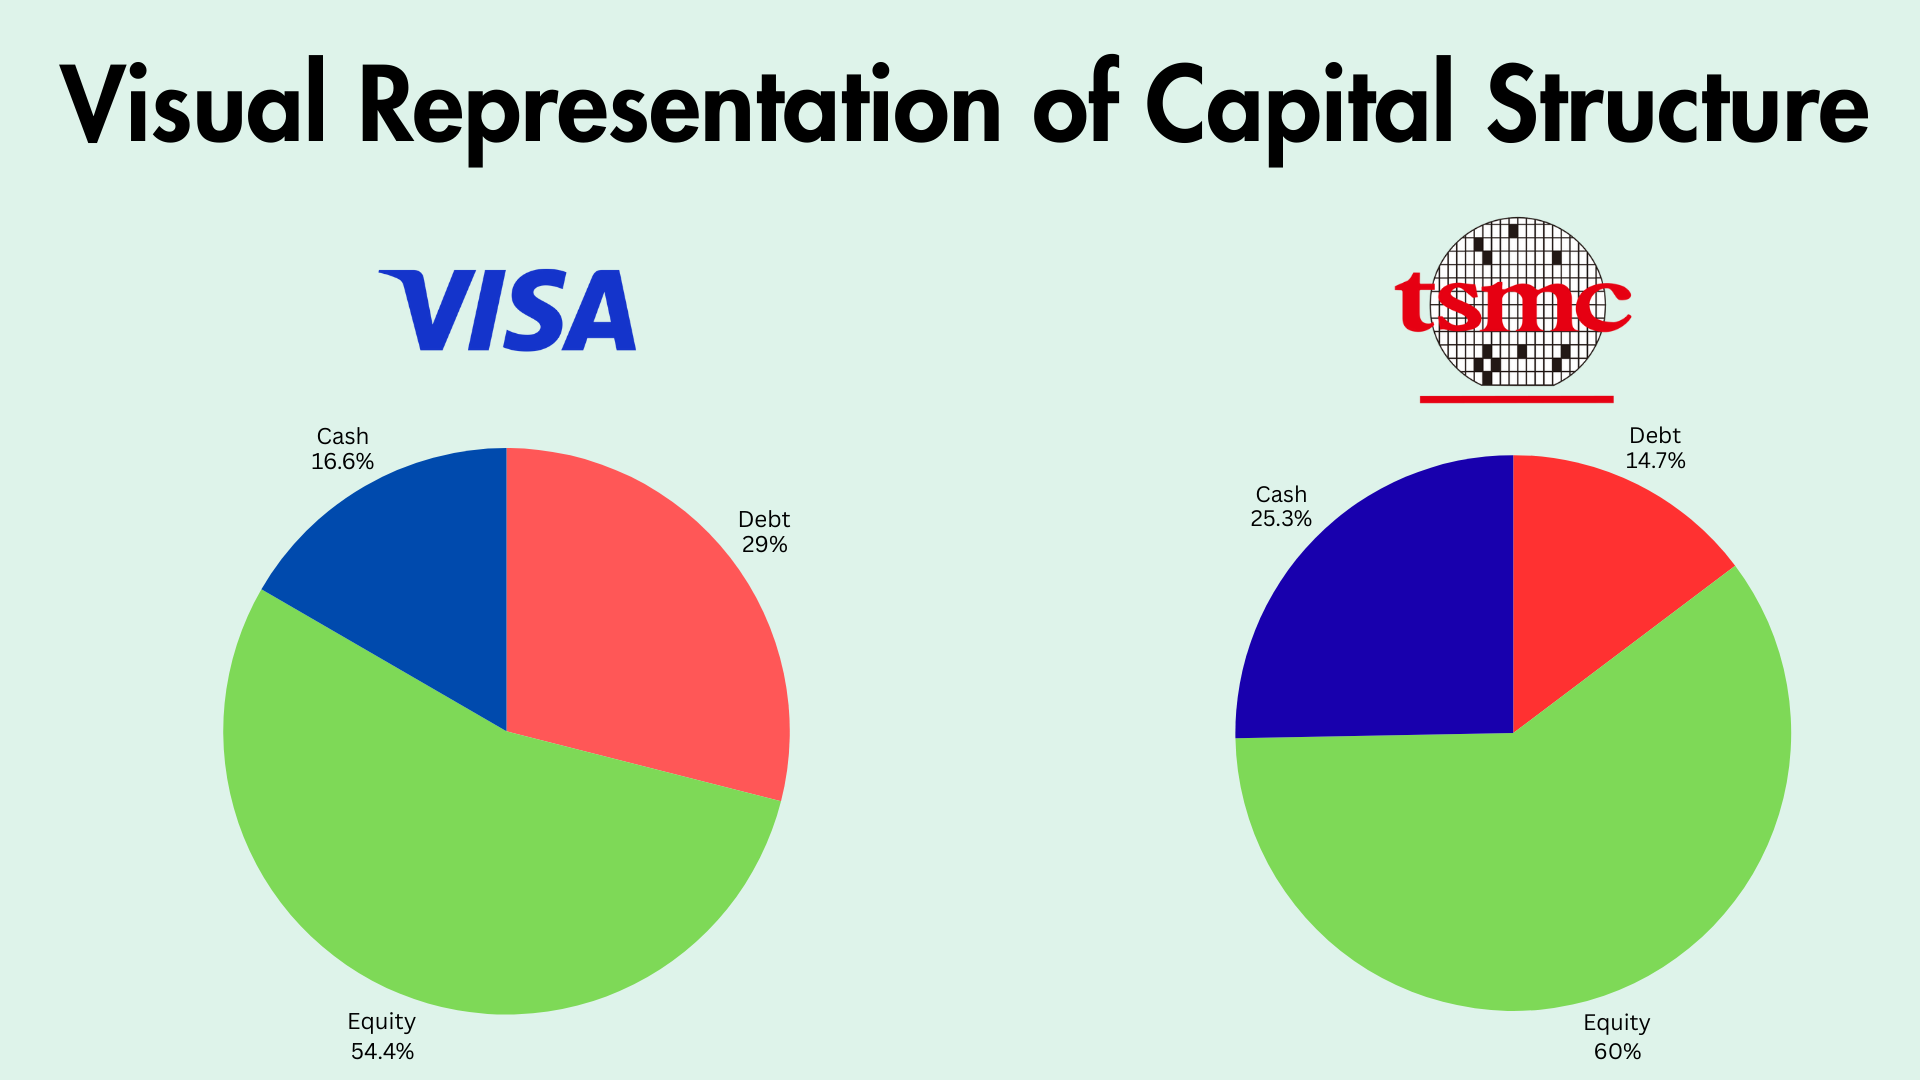
In today’s post, we will learn how to calculate and use ROIIC to identify companies where growth creates genuine value, using real examples from two very different businesses: Visa’s capital-light payment network and TSMC’s capital-intensive semiconductor manufacturing.
Okay, let’s dive in and learn more about ROIIC.
What is ROIIC?
Return on Incremental Invested Capital, or ROIIC, remains one of the most powerful metrics for identifying companies where growth creates genuine value for shareholders.
Think of it this way: when a company invests a dollar of capital into its business, how much operating profit does that dollar generate? Some companies turn every dollar into quarters. Others turn dollars into dimes. The great ones? They turn dollars into multiple dollars.
According to investment research, ROIIC measures the efficiency of new capital deployment by showing the return generated per additional dollar invested. While traditional ROIC shows you the return on all capital currently deployed, ROIIC focuses specifically on the incremental returns from new investments.
This distinction matters tremendously. A company might show strong historical ROIC because it made brilliant investments decades ago. But if management’s recent capital allocation decisions generate poor returns, that company’s future remains far less attractive than its past. ROIIC indicates whether management continues to identify profitable growth opportunities or is simply reinvesting with diminishing returns.
The bottom line remains that ROIIC helps you identify companies where each dollar of growth spending creates real shareholder value, not just revenue growth for its own sake.
Why ROIIC Matters for Investors
I know this may seem like just another financial ratio, but ROIIC reveals a critical insight: whether a company’s growth actually creates value.
Here’s the challenge many investors face: Revenue growth sounds exciting. But revenue growth that requires massive capital investment and generates minimal returns? That’s a recipe for value destruction, not value creation.
Let’s use a simple example. Imagine two companies, both growing revenue at 15% annually:
Company A needs to invest $100 million in new capital (equipment, facilities, working capital) to generate an additional $30 million in operating profit. That’s a 30% ROIIC.
Company B invests that same $100 million but generates only $8 million in additional operating profit. That’s an 8% ROIIC.
If your cost of capital remains around 10%, Company A creates wealth with every dollar invested. Company B? It destroys value by investing at returns below its cost of capital.
Warren Buffett talks about this constantly. He looks for companies that can reinvest capital at high rates of return, creating what he calls “compounding machines.” ROIIC shows you whether you’re looking at a true compounder or just a growth story that burns cash.
Not too hard, was it?
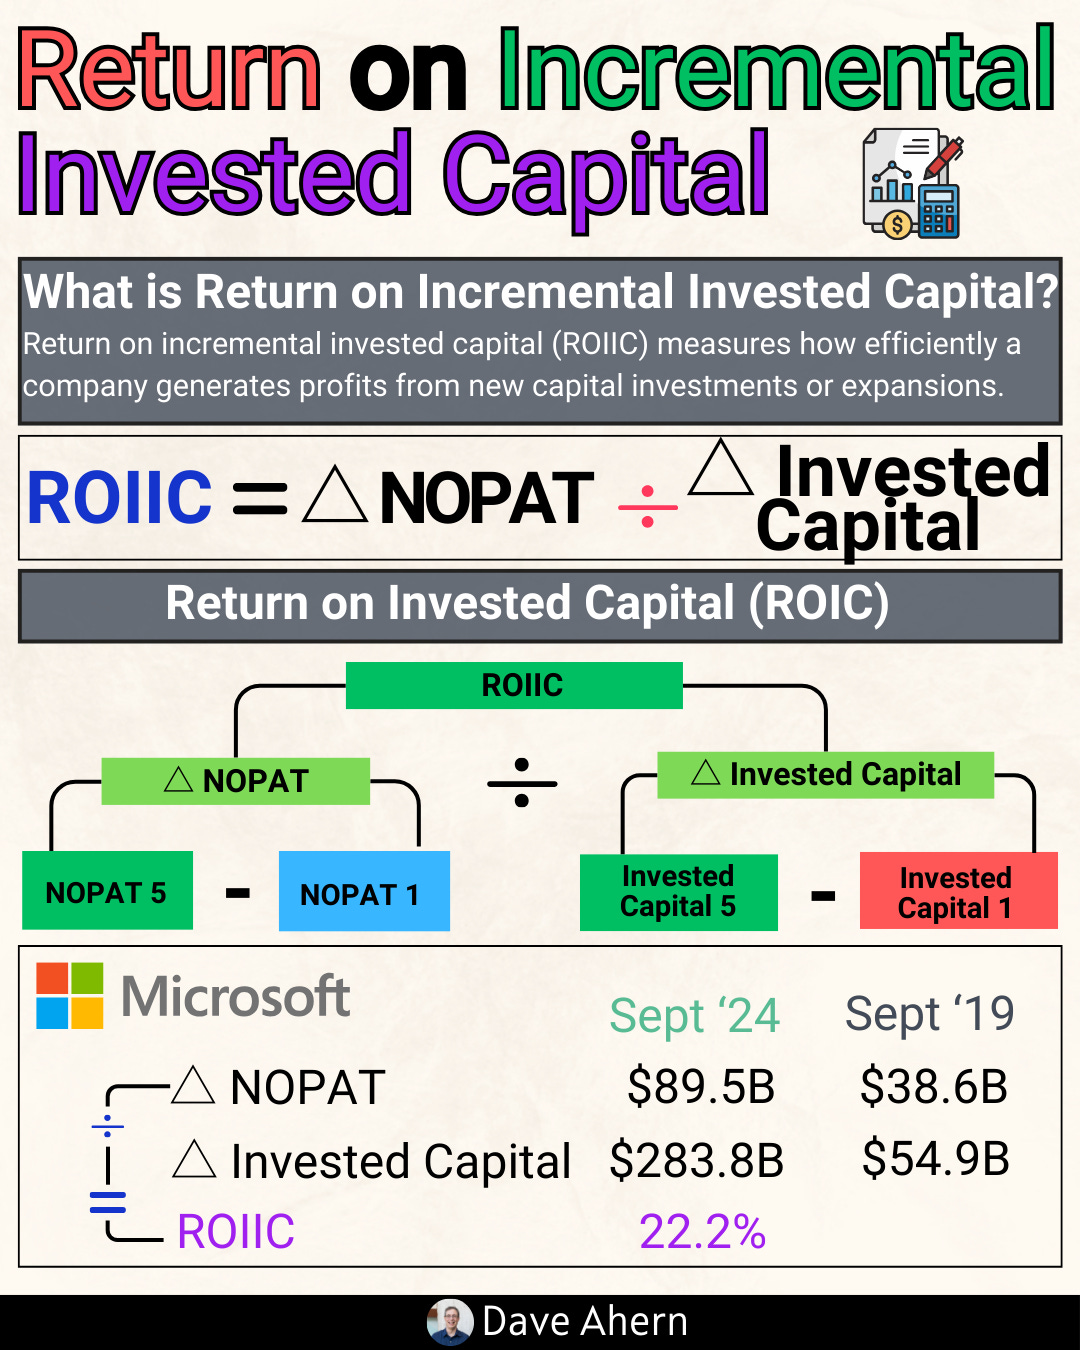
How to Calculate ROIIC
The formula for ROIIC looks like this:
ROIIC = Change in NOPAT / Change in Invested Capital
Where:
Change in NOPAT = Net Operating Profit After Tax from the current year minus the prior year.
Change in Invested Capital = (Debt + Equity - Cash) from the current year minus the prior year
I know it looks scary, but we will walk through each step with real companies.
The first step is calculating NOPAT (Net Operating Profit After Tax). We start with operating income from the income statement, then adjust for taxes:
NOPAT = Operating Income × (1 - Tax Rate)
The second step is calculating the Invested Capital for both years:
Invested Capital = Total Debt + Total Equity - Cash and Cash Equivalents
Why subtract cash? Because cash sitting on the balance sheet generates minimal returns and doesn’t represent capital invested in the operating business. We want to see returns on the capital actually deployed in operations.
The third step is finding the change between years:
Change in NOPAT = Current Year NOPAT - Prior Year NOPAT
Change in Invested Capital = Current Year IC - Prior Year IC
Finally, we divide:
ROIIC = Change in NOPAT / Change in Invested Capital
Let’s look at two real companies to see this in action.
Here ends the free part.
You’ve got the framework. Now let’s put it to work. In the next section, I’ll walk you through a complete ROIIC analysis of Visa and Taiwan Semiconductor —step-by-step, with real numbers. You’ll see how each component we just covered reveals how efficiently the company is deploying shareholder capital.
