
How to Use NotebookLM to Turn Over More Rocks: Accelerating Your Investment Research

Peter Lynch, one of the most successful mutual fund managers in history, famously said investors should “turn over more rocks” to find investment opportunities. The more companies you research, the better your chances of finding quality businesses trading at reasonable prices.
But here remains the challenge: deep research takes time. Reading multiple 10-Ks, analyzing earnings transcripts, and comparing competitors can consume hours per company. If you can only thoroughly research one company per week, you’re limited to about 50 companies per year. That’s not nearly enough rocks.
Enter NotebookLM, Google’s AI research assistant that can dramatically accelerate your investment research process without sacrificing quality. I’m not talking about using AI to make investment decisions for you - that remains your job. Instead, NotebookLM helps you digest information faster, spot patterns across documents, and create custom study materials that deepen your understanding.
In today’s post, we will learn:
What is NotebookLM and Why It Matters for Investors
How to Compare Multiple 10-Ks Side-by-Side (Google Example)
How to Analyze Earnings Call Transcripts for Management Tone and Promises (Shift4 Payments Example)
How to Create Custom Study Guides and Quizzes (Brown & Brown Example)
Limitations and Best Practices
Investor Takeaway
Okay, let’s dive in and learn more about how NotebookLM can help you turn over more rocks in your investment research.
What is NotebookLM and Why It Matters for Investors
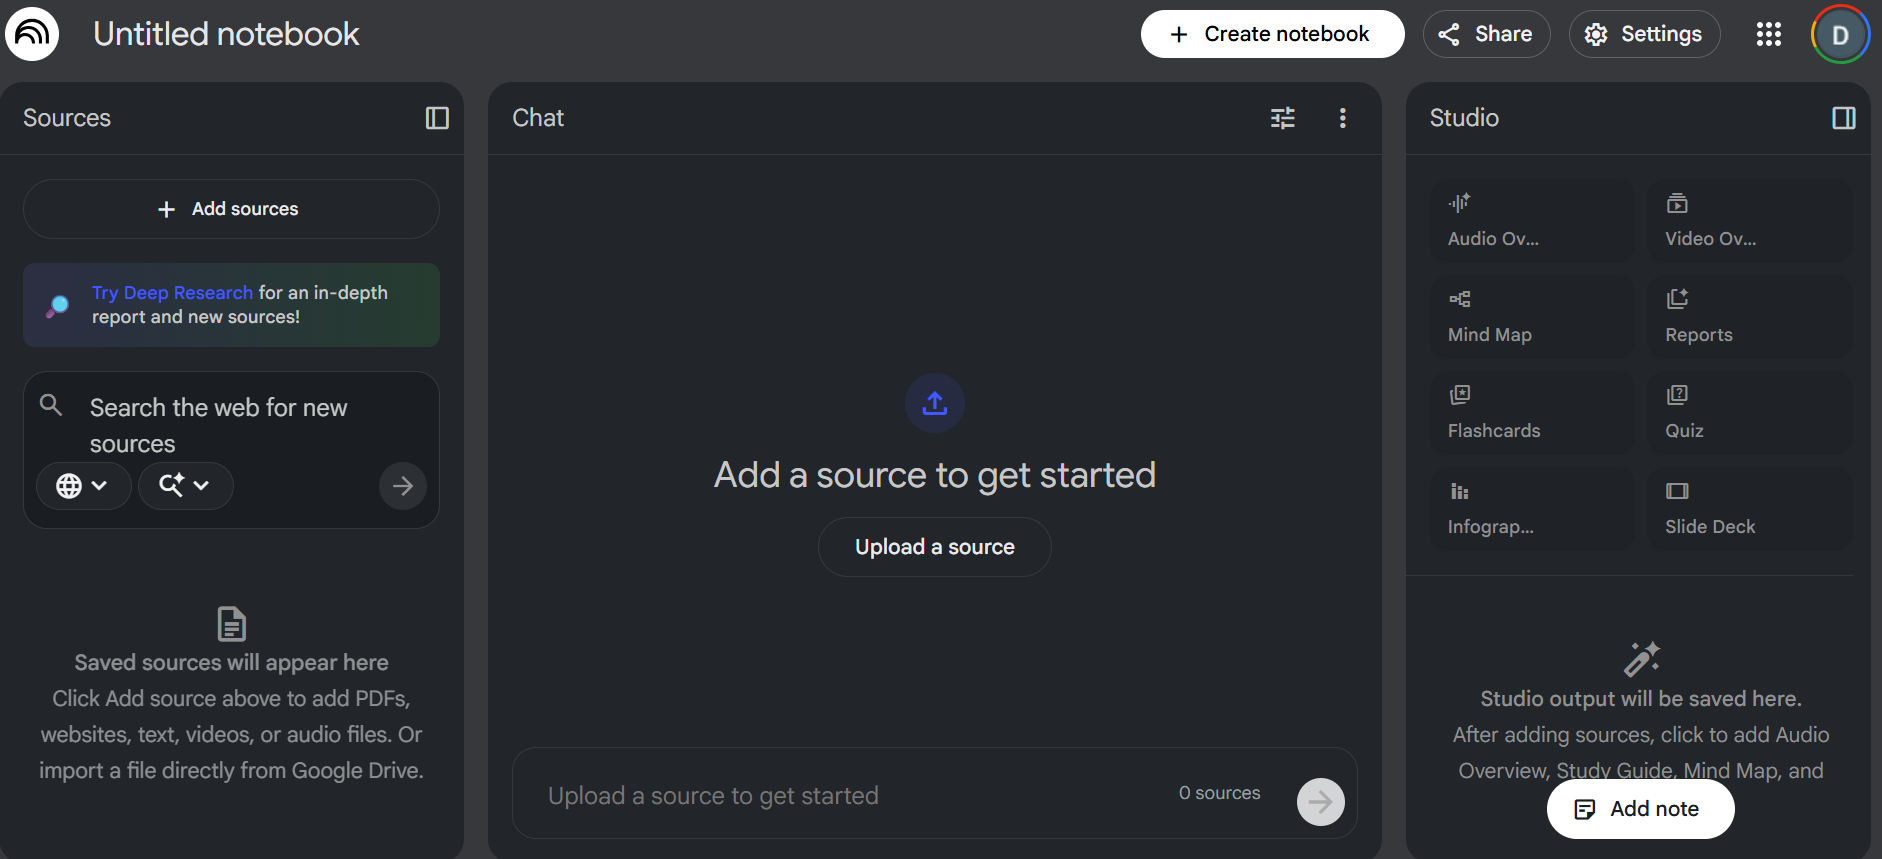
NotebookLM remains Google’s AI-powered research assistant designed to help you make sense of documents. Think of it as a research partner who has read all your source materials and can answer questions, draw connections, and create summaries based solely on what you’ve uploaded.
Here’s what makes it valuable for investment research:
It works with YOUR documents. Unlike ChatGPT or other general AI tools, NotebookLM creates a “notebook” where you upload specific sources - 10-Ks, earnings transcripts, industry reports - and it only references those documents when answering questions. No hallucinations about earnings that didn’t happen. No made-up financial metrics. Just what’s in your uploaded files.
It handles multiple sources simultaneously. You can upload up to 50 sources per notebook, each up to 500,000 words. That means you could upload five years of 10-Ks for multiple competitors and ask comparative questions across all of them at once.
It’s free. As of this writing, NotebookLM remains completely free to use with a Google account. No subscription, no per-query fees.
For investors trying to emulate Peter Lynch’s approach, NotebookLM solves a critical problem: it lets you research more companies without sacrificing depth. Instead of spending six hours reading a 10-K and taking notes, you might spend two hours uploading the document, asking targeted questions, and verifying key insights. That’s three companies researched in the time it used to take for one.
I know it sounds too good to be true, but let me show you exactly how this works with real examples.
Workflow #1: Comparing Multiple 10-Ks Side-by-Side (Google Example)
Let’s use Google (Alphabet) as our guinea pig to demonstrate how NotebookLM helps you spot trends across multiple years of financial statements.
The Problem: You want to understand how Google’s AI investments have evolved and whether they’re actually generating revenue or just burning cash. Reading three years of 10-Ks (each over 100 pages) would take most of a day.
The NotebookLM Solution: Upload multiple 10-Ks and ask specific comparative questions.
Step-by-Step Process
Step 1: Create a New Notebook
Go to notebooklm.google.com and click “New Notebook.” Give it a descriptive name like “Google - AI Investment Analysis.”
Step 2: Upload the 10-Ks
For this example, we’ll upload Google’s 10-Ks from 2022, 2023, and 2024. You can find these on SEC.gov by searching “Alphabet Inc” and downloading the 10-K files as PDFs.
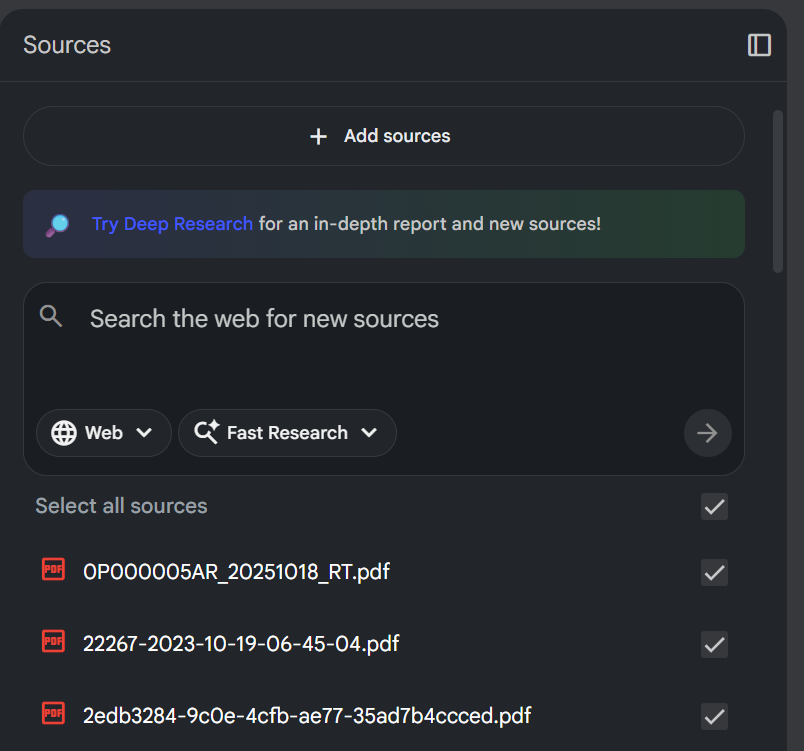
In NotebookLM, click “Sources” and upload each PDF. The system will process them (usually takes 30-60 seconds per document). Once uploaded, you’ll see all three sources listed in your notebook.
Step 3: Ask Comparative Questions
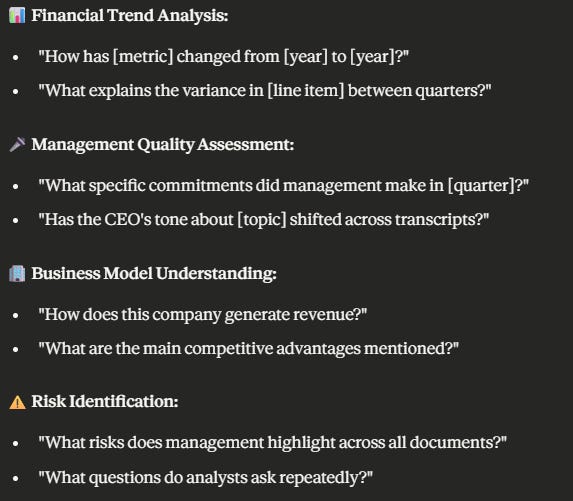
Now here’s where it gets powerful. Instead of manually searching through three documents, ask questions like:
“How has Google’s capital expenditure on AI infrastructure changed from 2022 to 2024?”
“What revenue did Google report from AI-powered products in each year?”
“Has management’s tone about AI competition shifted across these three years?”
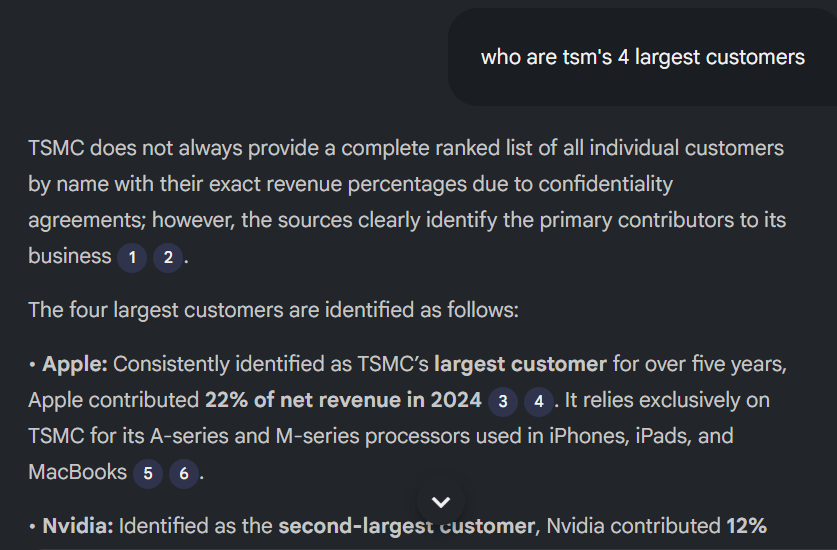
NotebookLM will scan all three 10-Ks and provide answers with citations that identify the exact document and page for each piece of information.
Step 4: Verify the Citations
This remains critical, and I’ll emphasize it throughout the article. ALWAYS click on the citation links and verify the information in the original 10-K. NotebookLM is generally accurate, but you’re the investor making the decision. Trust, but verify.
What You’ll Discover
When I ran this analysis on Google’s recent 10-Ks, NotebookLM quickly surfaced:
CapEx trajectory: Google increased data center investments from $31.5 billion in 2022 to approximately $50 billion in 2024, with AI infrastructure as a primary driver.
Revenue attribution: The 10-Ks show Google Cloud revenue growing from $26.3 billion in 2022 to $41.9 billion in 2024, with management explicitly attributing much of this growth to AI and ML services.
Competitive positioning: The tone shifted from defensive (2022-2023, discussing search competition) to more confident (2024, emphasizing Gemini integration and AI leadership).
Finding these patterns manually would have required hours of page-flipping and note-taking. With NotebookLM, it took about 20 minutes, including verification.
Not too hard, was it?
Workflow #2: Analyzing Earnings Call Transcripts (Shift4 Payments Example)
Let’s look at another powerful use case: tracking what management promises on earnings calls and whether they follow through.
For this example, we’ll use Shift4 Payments, a payment processing company that’s been making bold growth predictions. The question remains: does management do what they say they’ll do?
The Problem: Earnings call transcripts run 20-30 pages each. Reading four quarters of calls and tracking specific promises across them takes considerable time. Plus, it’s easy to miss subtle tone changes.
The NotebookLM Solution: Upload multiple quarters of transcripts and ask pointed questions about commitments and follow-through.
Step-by-Step Process
Step 1: Gather the Transcripts
You can find earnings call transcripts on Shift4’s investor relations page or through services like Seeking Alpha. For this example, grab the last four quarters of transcripts (Q1 2024 through Q4 2024 if available, or the most recent four quarters).
Step 2: Upload to a New Notebook
Create a notebook called “Shift4 Payments - Management Track Record” and upload all four transcripts. NotebookLM handles these quickly since transcripts are text-based.
Step 3: Track Specific Promises
Here’s where you get strategic. Ask questions like:
“What specific growth targets or timelines did management commit to in Q1 2024?”
“In Q2 2024, did management reference the Q1 commitments? Did they report progress or miss targets?”
“Has the CEO’s tone about competition changed across these four quarters?”
“What questions did analysts ask repeatedly, and how did management’s answers evolve?”
Step 4: Create a Promise Tracker
Based on NotebookLM’s answers, create a simple spreadsheet:
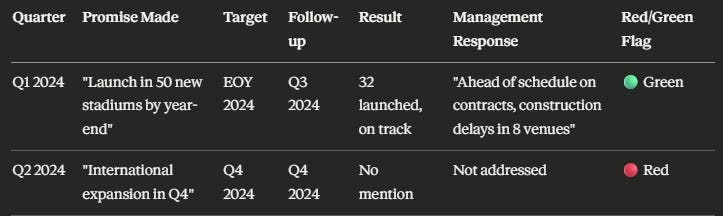
Fill this in using information from NotebookLM surfaces, but always verify by reading the original transcript sections.
What This Reveals
When I analyzed payment processing companies using this method, patterns emerged quickly:
High-integrity management consistently references prior commitments, provides updates even when targets are missed, and explains variances honestly. These are companies you can potentially trust with your capital.
Red flag management makes bold predictions that quietly disappear from future calls, shifts blame externally, or shows an increasingly defensive tone when analysts ask tough questions.
For Shift4 specifically, you might ask NotebookLM to track their stadium and venue rollout promises, their international expansion timeline, or their margin improvement targets. The key remains comparing what they said in Q1 to what they reported in Q4.
This analysis style helps you assess management quality, which Warren Buffett considers one of the most important investment criteria. As he famously said, “I try to buy stock in businesses that are so wonderful that an idiot can run them. Because sooner or later, one will.”
Workflow #3: Creating Custom Study Guides and Quizzes (Brown & Brown Example)
Now let’s tackle a different scenario: you’re researching a company in an unfamiliar industry and need to understand the business model quickly.
For this example, we’ll use Brown & Brown, one of the largest insurance brokers in the United States. If you’ve never researched insurance brokers before, the business model can seem confusing at first.
The Problem: Reading a 10-K for a company in an unfamiliar industry means constantly pausing to look up terminology, understand revenue streams, and grasp how the business actually makes money.
The NotebookLM Solution: Upload the 10-K and ask NotebookLM to create custom study materials to help you systematically learn the business model.
Step-by-Step Process
Step 1: Upload the Latest 10-K
Create a notebook called “Brown & Brown - Business Model Study” and upload their most recent 10-K (you can find this on SEC.gov).
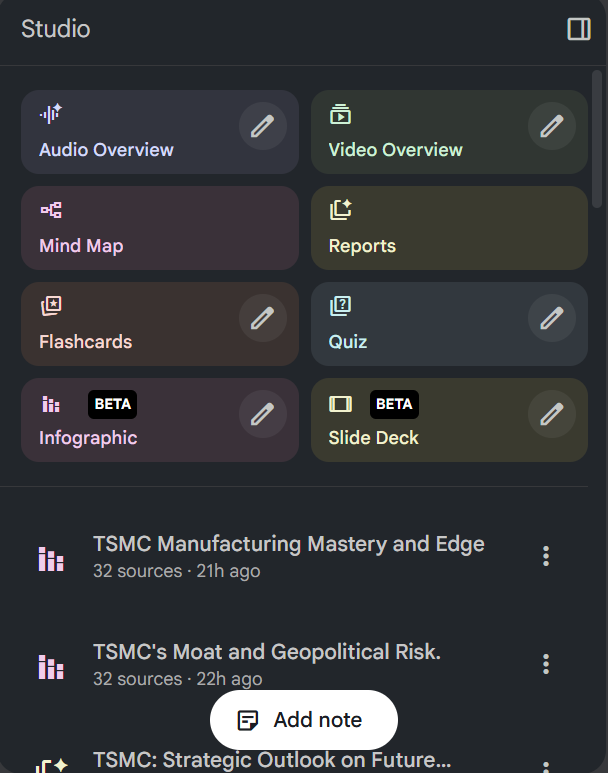
Step 2: Request a Study Guide
Ask NotebookLM: “Create a study guide explaining Brown & Brown’s business model, including: 1) How they make money, 2) Their main revenue segments, 3) Key metrics that matter, 4) Main competitive advantages, 5) Risks specific to their model.”
NotebookLM will generate a structured guide pulling directly from the 10-K. This typically covers:
Revenue model: Brown & Brown earns commissions and fees as a broker between insurance buyers and insurance carriers
Segments: Retail, National Programs, Wholesale Brokerage, Services
Key metrics: Organic revenue growth, margin trends, acquisition integration success
Moats: Client relationships, specialized expertise in niche markets, and regulatory barriers
Risks: Carrier relationships, competition, regulatory changes, contingent commissions
Step 3: Generate Quiz Questions
Here’s a feature many investors don’t use: ask NotebookLM to create quiz questions to test your understanding.
Try: “Create 10 quiz questions about Brown & Brown’s business model that would help me verify I understand how they create value.”
NotebookLM might generate questions like:
What percentage of Brown & Brown’s revenue comes from commissions vs. fees?
How does the Wholesale Brokerage segment differ from the Retail segment?
What happens to Brown & Brown’s revenue if insurance premiums increase industry-wide?
Why might regulatory changes impact their business model?
Step 4: Deep Dive Specific Areas
Once you have the overview, drill deeper into areas that matter for valuation:
“How has Brown & Brown’s organic revenue growth trended over the past three years?”
“What acquisition strategy does management describe, and what’s their integration success rate?”
“What contingent commission arrangements exist, and how might they create risk?”
Why This Matters
The study guide approach dramatically shortens the learning curve for unfamiliar industries. Instead of reading the entire 10-K sequentially and taking notes, you get a structured education customized to what matters for investment analysis.
I know some of you might think, “Dave, shouldn’t I just read the whole 10-K anyway?” Yes, eventually. But NotebookLM helps you quickly determine if a company is worth that deep dive. If the study guide reveals a business model you don’t understand or don’t like, you’ve saved hours before investing significant time.
Remember Peter Lynch’s approach: he researched hundreds of companies to find the few dozen worth owning. NotebookLM helps you quickly screen through the “hundreds” to identify the “few dozen” worthy of deeper analysis.
Combining All Three Workflows: The Power User Approach
Now that you understand each workflow individually, let’s discuss how to combine them for maximum research efficiency.
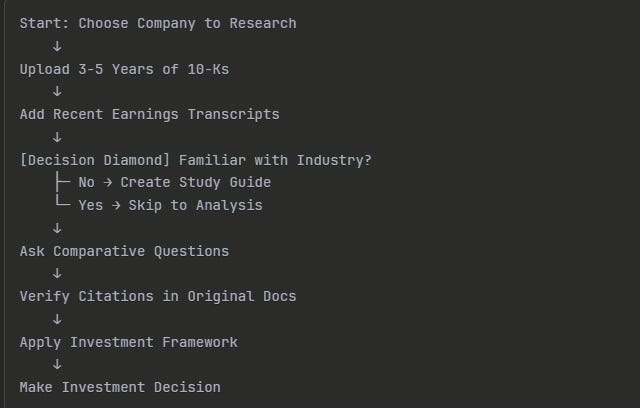
The Complete Research Process:
Upload multiple 10-Ks for a company (3-5 years) to understand financial trends
Add earnings transcripts from the past year to assess management quality
Include competitor 10-Ks to understand relative positioning
Create a study guide if the industry is new to you
Generate comparison tables asking NotebookLM to extract specific metrics across all sources
For example, if you’re researching payment processors, you might have a notebook with:
Shift4 Payments 10-Ks (2022-2024)
Shift4 earnings transcripts (last 4 quarters)
Toast 10-K (2024)
Square 10-K (2024)
Industry research report on payment processing trends
Then ask questions like: “Compare the gross margin trends for Shift4 vs Toast over the past two years. What explains the difference?”
NotebookLM will pull data from multiple sources and show you patterns that might take days to identify manually.
Limitations and Best Practices
Before you run off and start using NotebookLM for all your research, let’s discuss important limitations. I remain a big believer in this tool, but like any analytical method, it has weaknesses.
Limitation #1: It Only Knows What You Upload
NotebookLM can’t search the internet or access information beyond your uploaded documents. If you ask about recent news or industry trends not in your sources, it will tell you it doesn’t have that information.
Best Practice: Supplement NotebookLM analysis with traditional research. Use it to digest documents faster, but still read industry reports, follow company news, and understand macro trends.
Limitation #2: It Can Misinterpret Context
While NotebookLM is generally accurate, it can occasionally misread nuance or context, especially with complex financial footnotes or conditional statements.
Best Practice: ALWAYS verify important information in the original source. Click every citation link. If a number seems surprising, find it in the 10-K yourself. You’re the investor making the decision, not the AI.
Limitation #3: It Doesn’t Replace Critical Thinking
NotebookLM can surface information brilliantly, but it can’t judge whether a business model is good, whether management is trustworthy, or whether a stock is undervalued. That remains your job.
Best Practice: Use NotebookLM to gather and organize information faster, then apply your own investment framework to make decisions. Think of it as a research assistant, not a portfolio manager.
Limitation #4: Financial Calculations Need Verification
If you ask NotebookLM to calculate ratios or metrics, double-check the math. It generally does well, but I’ve seen instances where it used the wrong line items or miscalculated percentages.
Best Practice: For any valuation work (DCF, ROIC, etc.), extract the numbers using NotebookLM but perform calculations yourself or verify them independently. Generally, NotebookLM calculations are not the best; use Fiscal.ai or calculate them yourself.
Limitation #5: It Can’t Predict the Future
NotebookLM works with historical documents. It can identify trends but can’t tell you whether Google’s AI investments will pay off or whether Shift4’s growth will continue.
Best Practice: Use NotebookLM to understand what HAS happened, then apply your judgment about what MIGHT happen. Remember Buffett’s wisdom: “It’s better to be approximately right than precisely wrong.”
Investor Takeaway
NotebookLM represents a genuine breakthrough for retail investors trying to emulate Peter Lynch’s “turn over more rocks” philosophy. By accelerating the document analysis process, it allows you to research 3-5x more companies in the same amount of time without sacrificing analytical depth.
The three workflows we covered today - comparing multiple 10-Ks, analyzing earnings transcripts, and creating study guides - address the most time-consuming parts of fundamental research. When you can quickly understand a business model, track management’s track record, and spot financial trends across years, you dramatically increase your ability to find undervalued opportunities.
But remember that NotebookLM remains a tool, not a replacement for investor judgment. Use it to gather information faster, but apply your own critical thinking to investment decisions. Trust, but verify. Read the sources. Do your own calculations. Make your own assessments of management quality and business moats.
The bottom line remains this: NotebookLM helps you research more companies, but you still need to think like an investor. Quality research done quickly beats slow research or no research at all. And the more rocks you turn over, the better your chances of finding diamonds hiding underneath.
Start small. Pick one company you’ve been meaning to research, upload its 10-K to NotebookLM, and spend 30 minutes asking questions. You’ll quickly see how this tool can accelerate your research process. Then expand to multiple sources, earnings transcripts, and competitive comparisons.
Investors who adapt their research process to include tools such as NotebookLM will have a significant advantage over those who rely solely on traditional methods. Not because AI is “smarter,” but because it enables you to be more thorough, more efficient, and more consistent in your research approach.
With that, we will wrap up our discussion today. As always, thank you for taking the time to read today’s post, and I hope you find something of value in your investing journey. If I can be of further assistance, please don’t hesitate to reach out.
Until next time, take care and be safe out there,
Dave
Fantastic
Hey, fantastic tips. Thank you so much. Just wanted to make a small correction to the quote “It’s better to be vaguely right than precisely wrong”, was said by the Economist Keynes not Buffet.