
How to Use EV/FCF to Value Companies

Finding an accurate way to value a company remains one of the most important skills any investor can develop. While there are dozens of valuation metrics floating around, one of the most reliable measures for assessing what you’re actually paying for a business is the Enterprise Value to Free Cash Flow ratio, or EV/FCF.
I know what you might be thinking: “That sounds complicated.” But I promise you, it isn’t. Once we walk through the components together, you’ll see that EV/FCF is actually quite intuitive and gives you something the more popular P/E ratio can’t, a picture of what the entire business costs relative to the actual cash it generates.
The beauty of EV/FCF remains its simplicity: it tells you how many years of free cash flow it would take to “buy” the entire enterprise, including its debt. The lower the ratio, the cheaper the company (all else being equal). The higher the ratio, the more you’re paying for each dollar of cash flow.
In today’s post, we will learn:
- What is Enterprise Value (EV) and why it matters
- What is Free Cash Flow (FCF) and how to find it
- The EV/FCF formula explained step by step
- Real examples using Microsoft’s SEC filings (2021-2024)
- Comparing Microsoft and Apple’s cash generation
- Limitations and when EV/FCF can mislead you
- Investor Takeaway
Okay, let’s dive in and learn more about EV/FCF valuation.
What is Enterprise Value (EV) and Why It Matters
Before we can calculate EV/FCF, we need to understand what Enterprise Value actually means. Think of it this way: if you were going to buy an entire company tomorrow, how much would you really need to pay?
The market capitalization (stock price times shares outstanding) only tells part of the story. It represents the equity value—what shareholders own. But when you buy a company, you also inherit its debts. At the same time, you get to keep any cash sitting on the balance sheet.
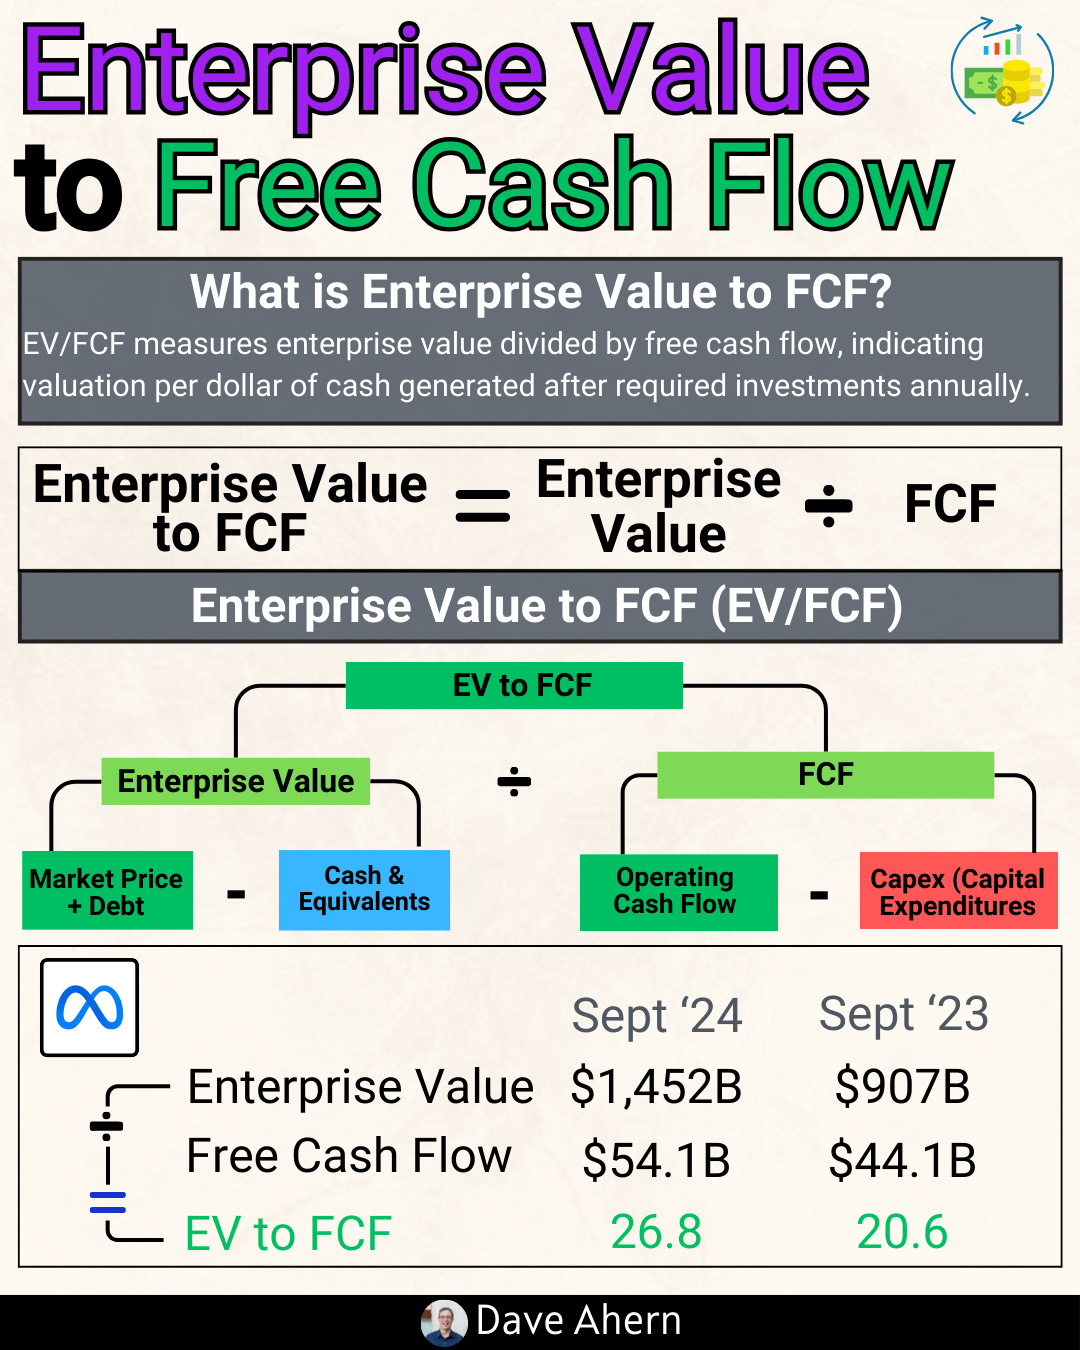
Enterprise Value captures this complete picture. The formula looks like this:
Enterprise Value = Market Cap + Total Debt - Cash and Cash Equivalents
Where:
• Market Cap = Current stock price × total shares outstanding
• Total Debt = Short-term debt + long-term debt (found on the balance sheet)
• Cash and Cash Equivalents = Cash + short-term investments (also on the balance sheet)
Why do we add debt and subtract cash? Because debt represents an obligation the new owner must pay off, while cash is an asset they immediately receive. If Company A has a $100 billion market cap, $50 billion in debt, and $10 billion in cash, the true cost to acquire the entire business is $140 billion ($100B + $50B - $10B).
This remains critically important when comparing companies. Two businesses might have identical market caps, but if one carries massive debt while the other has a fortress balance sheet full of cash, they are not equally priced. EV accounts for this difference.
What is Free Cash Flow (FCF) and How to Find It
Free Cash Flow is the cash a business generates after paying for all costs required to maintain and grow its operations. It’s the money left over that could theoretically be distributed to shareholders, used to pay down debt, or reinvested in the business.
The formula is straightforward:
Free Cash Flow = Operating Cash Flow - Capital Expenditures
Where:
• Operating Cash Flow = Cash generated from normal business operations (found in the Cash Flow Statement)
• Capital Expenditures (CapEx) = Money spent on property, plant, and equipment (also in the Cash Flow Statement, usually listed as “Purchases of property and equipment”)
Here’s the beautiful thing about free cash flow: unlike earnings, which can be manipulated through accounting choices, cash is cash. A company either generated it or it didn’t. This makes FCF one of the most honest measures of business performance available to us.
To find these numbers, head to the company’s 10-K filing on SEC.gov and look for the “Consolidated Statements of Cash Flows.” The operating cash flow appears at the top (often called “Net cash provided by operating activities”), and capital expenditures appear in the investing section.
The EV/FCF Formula Explained Step by Step
Now that we understand both components, putting them together is simple:
EV/FCF = Enterprise Value ÷ Free Cash Flow
The result tells you how many years of current free cash flow it would take to equal the enterprise value. A ratio of 20 means you’re paying 20 years’ worth of free cash flow to own the business. A ratio of 10 means you’re paying only 10 years’ worth.
Here’s how to interpret the results:
• Lower EV/FCF (under 15) = Generally considered cheap, but investigate why
• Moderate EV/FCF (15-25) = Fairly valued for quality companies
• Higher EV/FCF (over 25) = Premium valuation, market expects strong growth
Remember, these are rough guidelines. A company with 40% annual growth might deserve an EV/FCF of 40, while a declining business might be expensive at 10. Context always matters.
Real Examples Using Microsoft’s SEC Filings (2021-2024)
Let’s put this into practice using real data. We’ll use Microsoft (MSFT) as our guinea pig because it provides an excellent case study of how free cash flow can change over time—and why that matters for valuation.
I pulled all of the following data directly from Microsoft’s 10-K filings on SEC.gov. No estimates, no third-party projections—just the actual numbers reported to the Securities and Exchange Commission.
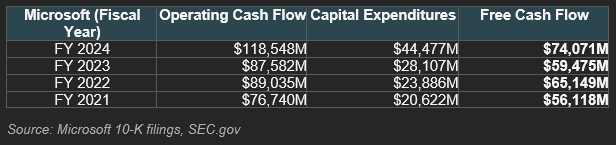
Step 1: Gathering Free Cash Flow Data
Microsoft’s fiscal year ends on June 30, so “FY 2024” means the twelve months ending June 30, 2024. Here’s what the cash flow statement tells us:
Not too hard to find, was it? Now let’s talk about what this data tells us.
Notice something interesting: Microsoft’s operating cash flow jumped dramatically in FY 2024, from $87.6 billion to $118.5 billion—a 35% increase. That’s fantastic. But look at what happened to capital expenditures: they more than doubled from FY 2021 to FY 2024, rising from $20.6 billion to $44.5 billion.
Why the massive increase in CapEx? Microsoft is investing heavily in AI infrastructure—data centers, servers, and the computing power needed to run Azure’s AI services. This is a strategic choice that may pay off handsomely, but it’s eating into current free cash flow.
Step 2: Calculating Enterprise Value
For Enterprise Value, we need the balance sheet data. Here’s what Microsoft reported:
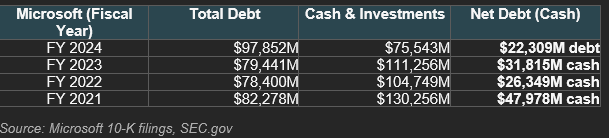
This table reveals another important trend: Microsoft’s balance sheet position has shifted dramatically. In FY 2021, the company had nearly $48 billion more in cash than debt—a net cash position. By FY 2024, that flipped to a net debt position of $22.3 billion.
Where did the cash go? Much of it funded the $69 billion Activision Blizzard acquisition (completed in October 2023) and the ongoing AI infrastructure buildout. Again, these may be excellent strategic investments, but they change the balance sheet picture significantly.
Step 3: Putting It All Together
Now let’s calculate a sample EV/FCF ratio. As of early December 2025, Microsoft’s market cap sits at approximately $3.1 trillion. Using the FY 2024 data:
Enterprise Value Calculation:
Market Cap: $3,100,000 million
+ Total Debt: $97,852 million
- Cash & Investments: $75,543 million
= Enterprise Value: $3,122,309 million (approximately $3.12 trillion)
EV/FCF Calculation:
Enterprise Value: $3,122,309 million
÷ Free Cash Flow: $74,071 million
= EV/FCF: 42.2x
Not too hard, was it? The calculation tells us that at current prices, you’re paying about 42 years of Microsoft’s current free cash flow to own the entire enterprise.
Is that expensive? Historically, yes—it’s a premium valuation. But Microsoft isn’t a typical company. The market is betting that AI-related revenues will dramatically increase free cash flow in coming years. Whether that bet pays off remains to be seen, but the current price reflects enormous optimism about Microsoft’s future cash generation.
Comparing Microsoft and Apple’s Cash Generation
Here ends the free part.
You've got the framework. Now let's see it in action with Apple and Microsoft's actual financials. Below: step-by-step EV/FCF calculations using their latest SEC filings, with all the numbers laid out.
