
How to Screen for Dividend Stocks: A Step-by-Step Framework

Most dividend investors start in the wrong place. They open a screener, sort by highest yield, and start researching the names at the top of the list. Six months later, they’re holding a stock that just cut its dividend by 40%, wondering what went wrong.
The problem isn’t dividend investing. The problem is screening for the wrong things in the wrong order. In today’s post, I’ll walk you through the exact screening framework I use to find quality dividend stocks, with specific filter criteria you can plug into any free screener (Finviz, Fiscal.ai, your brokerage’s tool) and start using today.
Here’s what we’ll cover:
Why yield is the worst place to start
The 7 filters I use, in order
How to apply each filter with specific thresholds
A real-world walkthrough using the framework
Common screening mistakes to avoid
Let’s dive in.
Why Yield Is the Worst Place to Start
A high dividend yield is often a warning, not an opportunity. Yield is just the annual dividend divided by the share price. When the share price falls as the business deteriorates, the yield mechanically rises. By the time a stock yields 9% or 10%, the market is usually telling you something.
Think of yield as the last filter, not the first. Quality comes first. Sustainability comes second. Growth comes third. Yield comes last, because a 3% yield from a business that grows its dividend 8% per year for two decades will crush an 8% yield that gets cut in half three years from now.
With that mindset, let’s build the framework.
You are learning to screen dividend stocks the way an analyst would. Imagine what a full year of frameworks like this does to your process. School of Investing is where investors go to stop guessing and start analyzing, with the weekly deep dives, the calculators, the infographic library, and the AI prompts that make it possible."
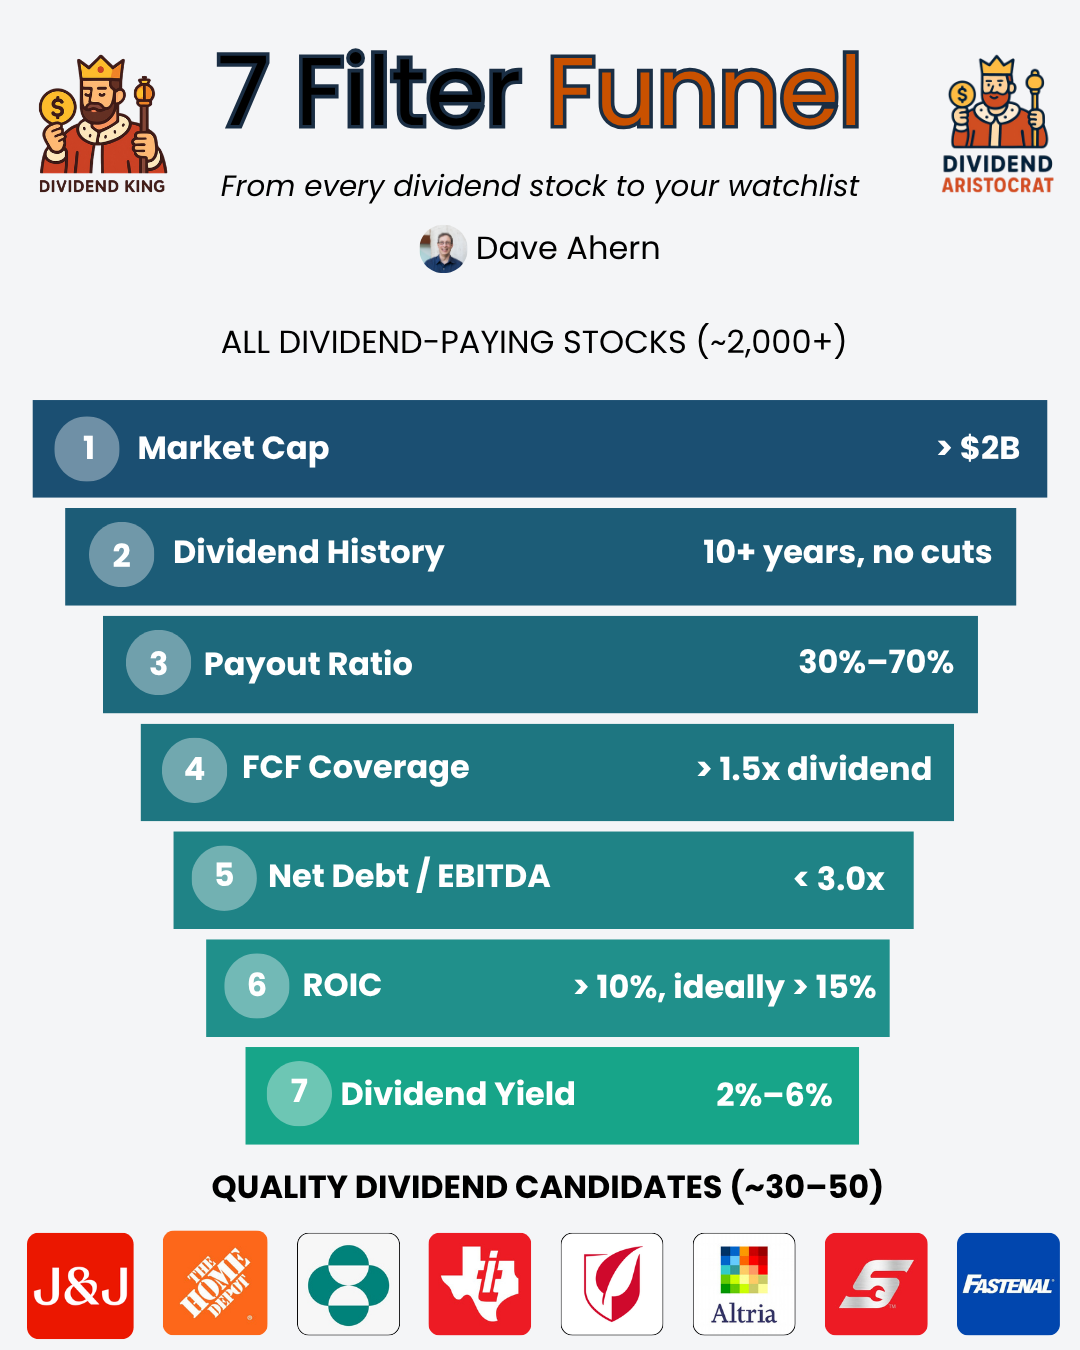
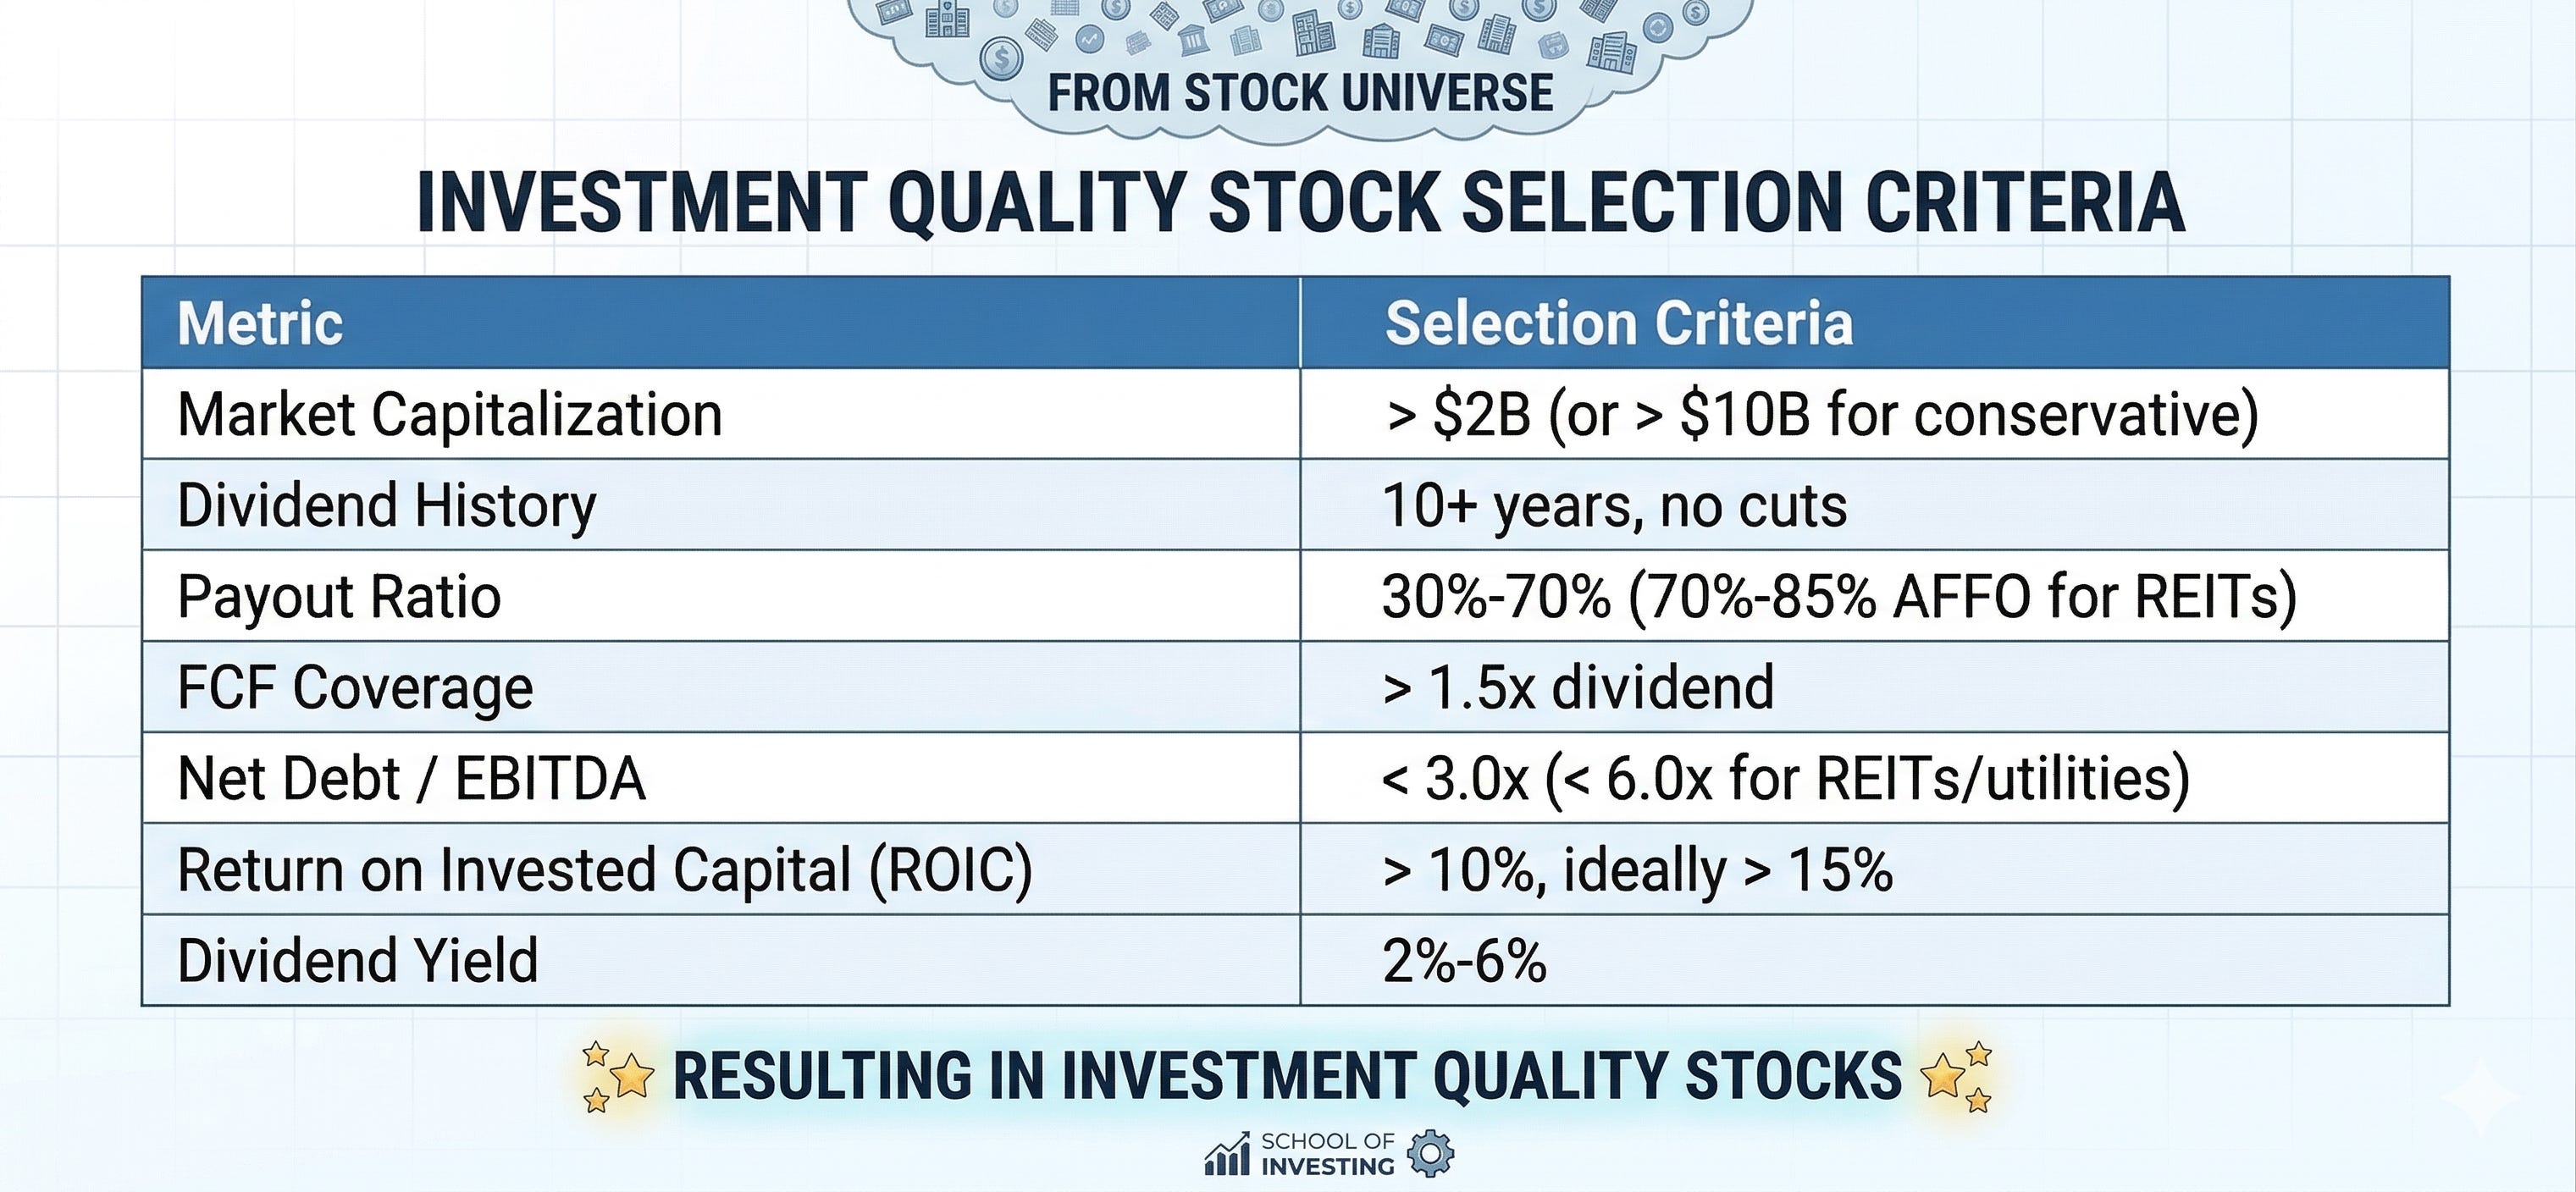
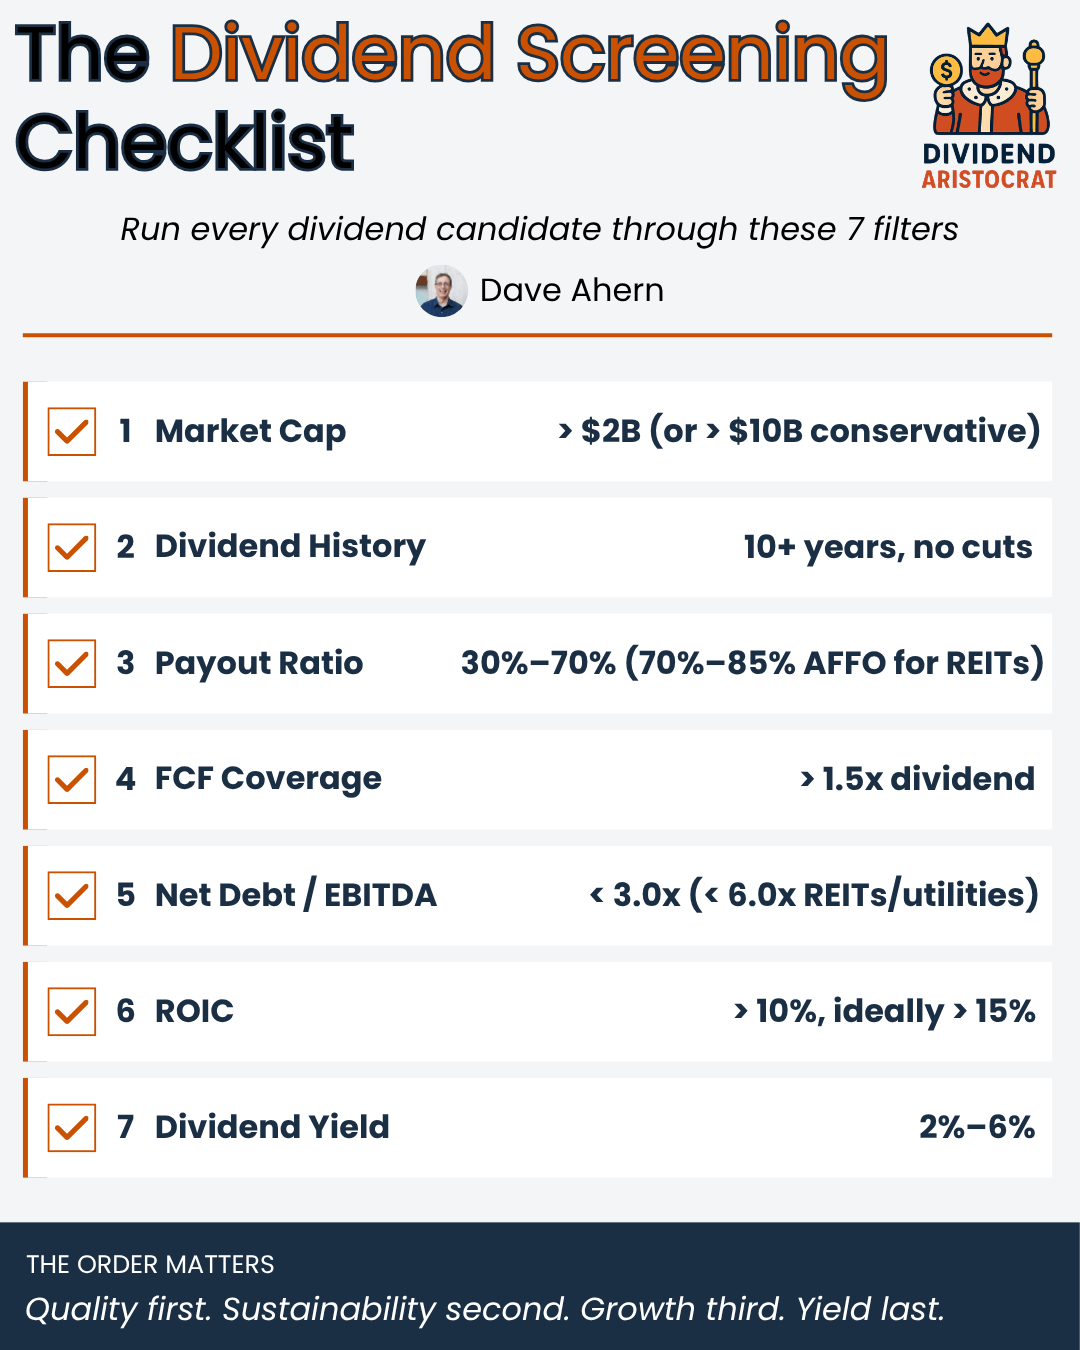
The 7-Filter Dividend Screening Framework
Filter 1: Market Capitalization (Stability Floor)
What to set: Market cap greater than $2 billion (or $10 billion if you want to be more conservative).
Why it matters: Smaller companies have less financial cushion. When recessions hit, small caps cut dividends at much higher rates than large caps. A market cap floor doesn’t guarantee safety, but it filters out the most fragile names before you spend any time researching them.
If you’re new to dividend investing, start with $10 billion or more. You’ll be looking at established businesses with longer operating histories, more analyst coverage, and easier access to SEC filings.
Filter 2: Dividend History (Track Record)
What to set: Has paid a dividend for at least 10 consecutive years, with no cuts.
Why it matters: A 10-year dividend history implies the company has survived at least one significant economic stress (the 2020 pandemic counts). Companies that maintained or grew their dividends during that period have demonstrated something important about their business models and management discipline.
For a higher bar, look at the Dividend Aristocrats (S&P 500 companies with 25+ consecutive years of dividend increases) or Dividend Kings (50+ years). These lists are publicly maintained and free to access.
Filter 3: Payout Ratio (Sustainability Check)
What to set: Payout ratio between 30% and 70% for most sectors. For REITs, use the AFFO payout ratio between 70% and 85%.
Why it matters: The payout ratio tells you what percentage of earnings the company is sending out as dividends. A level below 30% might mean the company is being too conservative or doesn’t prioritize dividends. Above 70% leaves little margin for error if earnings decline.
The formula is simple:
Payout Ratio = Dividends Per Share / Earnings Per Share
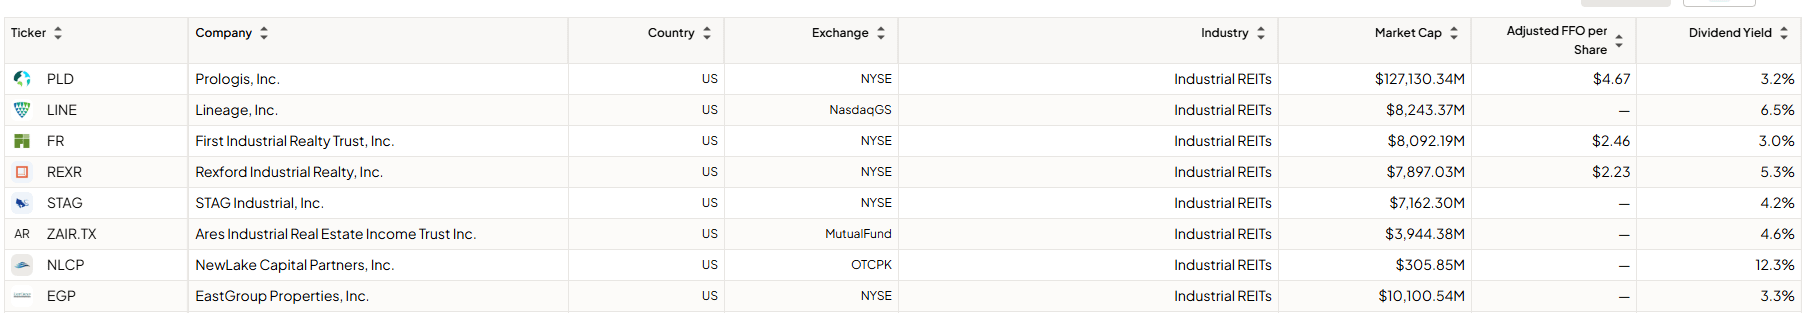
A note on REITs: because of depreciation accounting, REITs will look like they’re paying out more than 100% of net income. That’s normal and expected. For REITs, always use the AFFO (Adjusted Funds From Operations) payout ratio instead, which you’ll find in their quarterly earnings releases on sec.gov.
Another note, Fiscal.ai does have REIT screening capability. For example, you can scroll through both AFFO and FFO metrics to screen for these companies, making it a touch easier. You will need to do a bit of math (division) to calculate the AFFO payout ratio, but I have faith.
Filter 4: Free Cash Flow Coverage (The Real Test)
What to set: Free cash flow should cover the dividend at least 1.5x.
Why it matters: Earnings can be manipulated through accounting choices. Free cash flow is harder to fake. If a company isn’t generating enough actual cash to pay its dividend, it’s funding the dividend through debt or asset sales. That’s not sustainable.
The calculation:
FCF Coverage = Free Cash Flow / Total Dividends Paid
You’ll find both numbers in the cash flow statement of any 10-K or 10-Q filing on sec.gov. Free cash flow is typically operating cash flow minus capital expenditures. Total dividends paid is listed under financing activities.
A coverage ratio of 1.5x means the company generates $1.50 of free cash for every $1.00 it pays in dividends. That cushion absorbs bad quarters without forcing a cut.
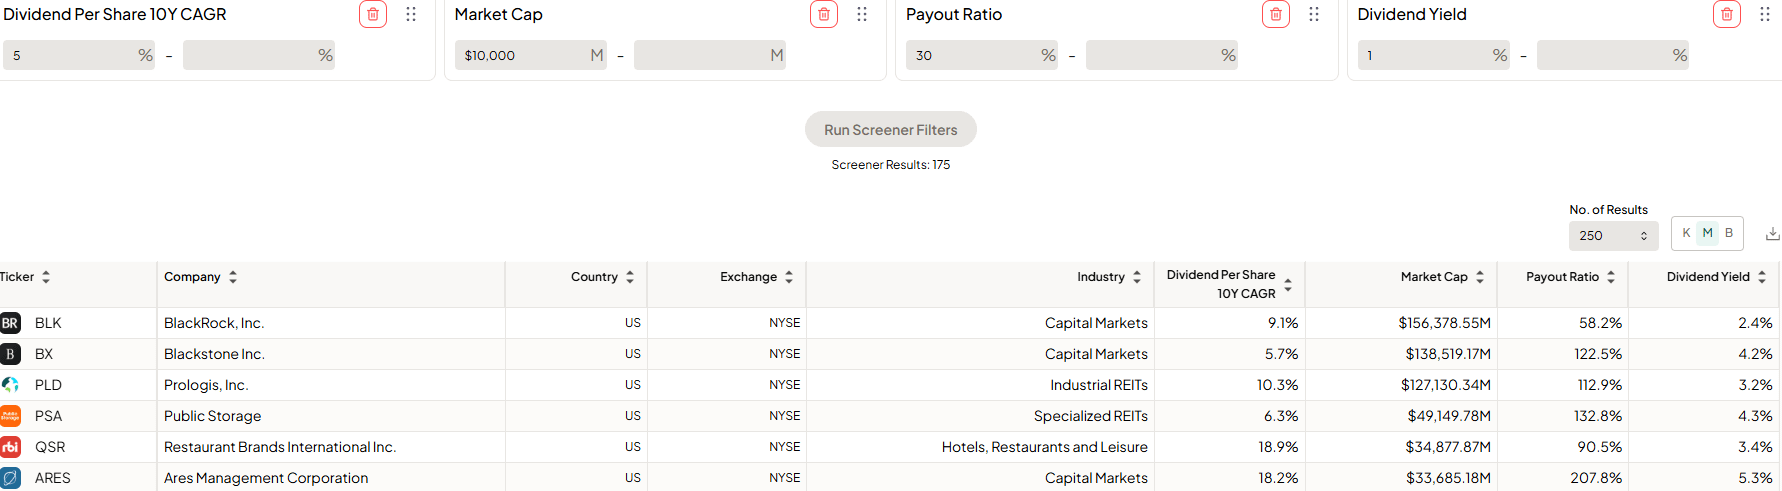
Unfortunately, there are no screeners who will do this calculation for us at this time. My suggestion is to run it as such in Fiscal, screen for dividends per share and FCF per share, and then either do the math manually (yes, I know) or download the spreadsheet, upload it to your favorite AI, and let them do the math.
I personally like the eyeball test, look to find an approximate number; this is screening after all, not buying.
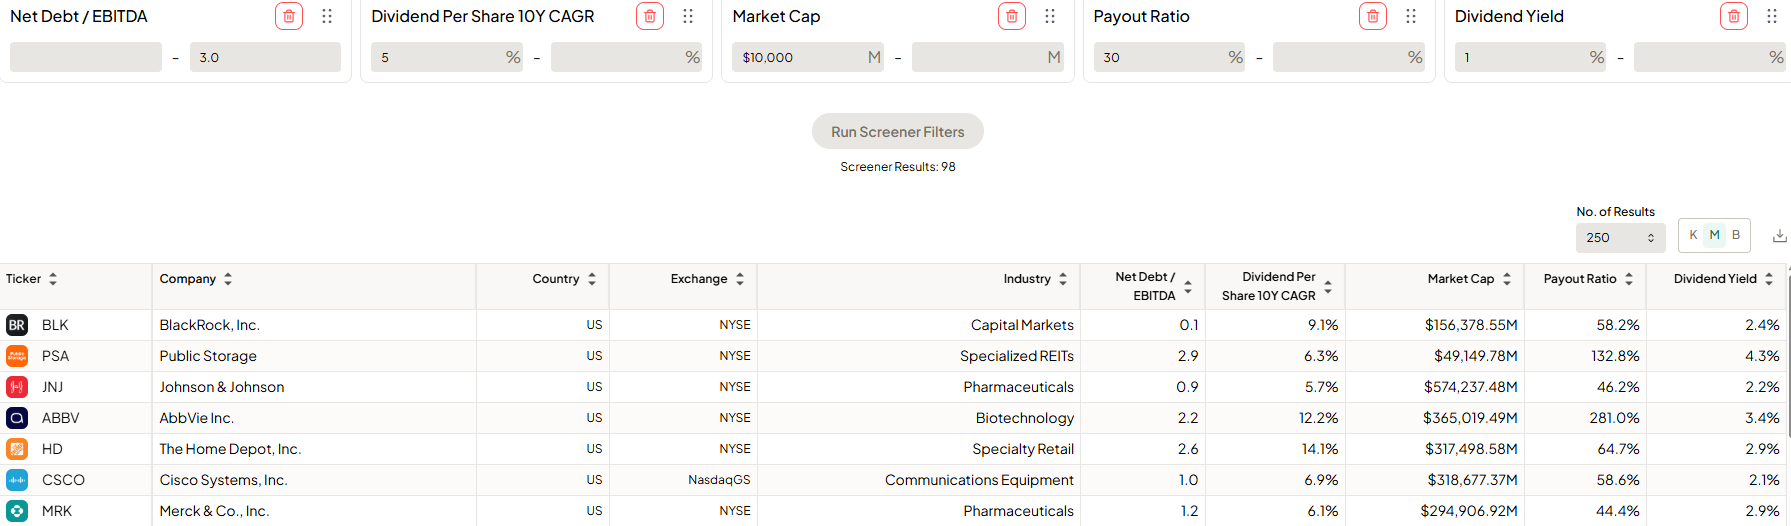
Filter 5: Debt Levels (Balance Sheet Health)
What to set: Net debt to EBITDA below 3.0x for most industries. Below 6.0x for REITs and utilities.
Why it matters: Highly leveraged companies have less flexibility. When interest rates rise or revenues drop, debt service eats into the cash that would otherwise fund dividends. A heavily indebted company facing trouble will almost always cut its dividend before defaulting on bondholders.
The formula:
Net Debt to EBITDA = (Total Debt − Cash) / EBITDA
REITs and utilities can carry more debt because their cash flows are more predictable, but the principle still applies: lower is safer.
Filter 6: Return on Invested Capital (Quality Check)
What to set: ROIC above 10%, ideally above 15%.
Why it matters: This is where you separate quality businesses from mediocre ones. ROIC measures how efficiently a company turns its capital into profits. Companies with high ROIC tend to have durable competitive advantages, which is exactly what you want backing your dividend stream.
Buffett built his career on this principle. The best dividend investments aren’t just companies that pay dividends. They’re great businesses that happen to return excess capital to shareholders. A company earning 20% on its invested capital has the financial strength to keep raising its dividend year after year. A company earning 5% does not.
If ROIC isn’t readily available in your screener, you can approximate it with Return on Assets (above 8%) or Return on Equity (above 15%) as a starting point.
Filter 7: Dividend Yield (Finally)
What to set: Yield between 2% and 6%.
Why it matters: Now that you’ve filtered for quality, sustainability, and growth potential, you can think about yield. The 2% floor ensures you’re getting meaningful current income. The 6% ceiling helps you avoid yield traps. Anything above 6% deserves extra scrutiny, not automatic exclusion, but you need to understand why the yield is that high before buying.
Putting the Framework Together
Here’s the full screening checklist in one place:
Run a stock through these seven filters in order. If it fails at any step, move on. You’re not trying to find reasons to buy. You’re trying to find reasons to disqualify, so the names that survive are worth your research time.
One thing to notice as we go through this process.
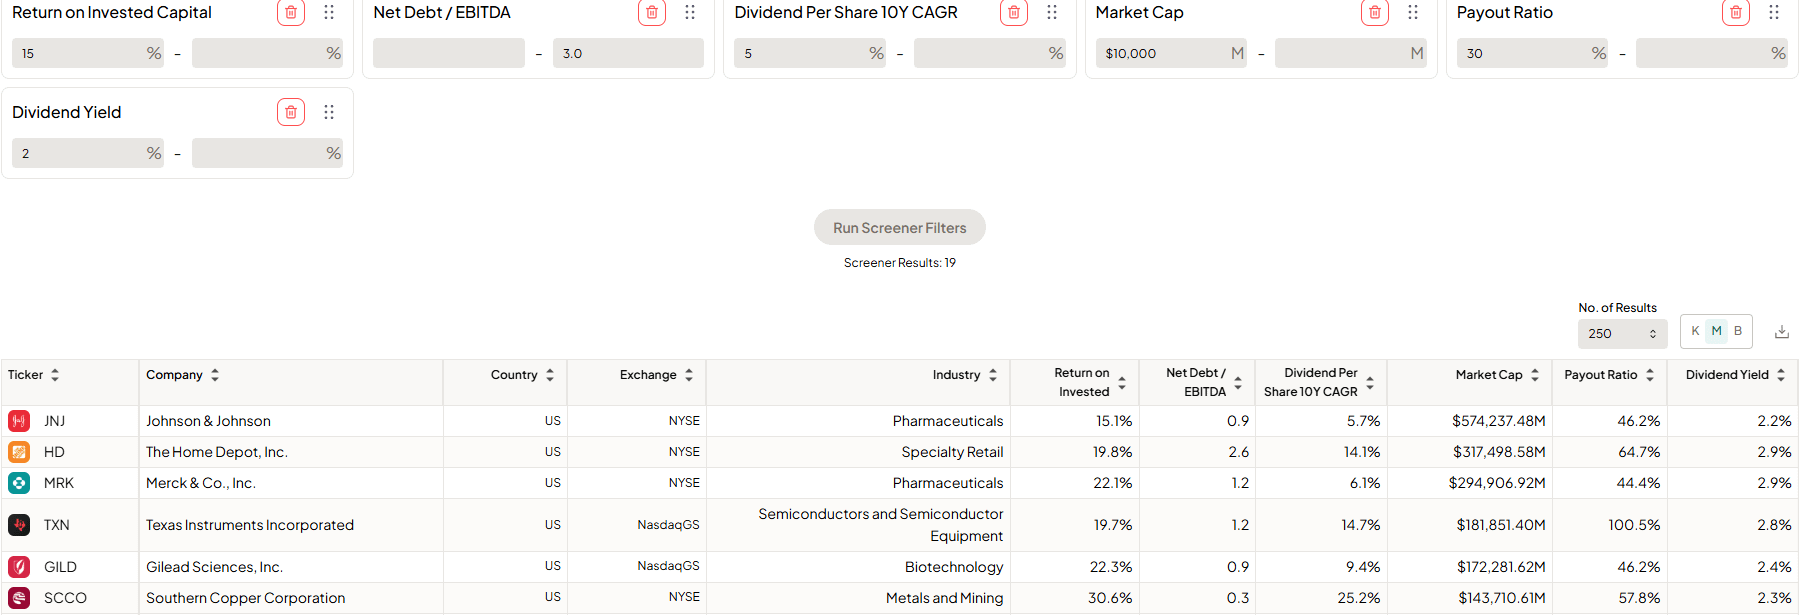
At the start, we have around 250 companies, and by the end, we are down to 19. This is the screening process. It helps us find companies that meet our criteria and that we can investigate, and thin the herd, so to speak. After all, who has time to analyze 250+ companies?
A Practical Walkthrough
Let me show you how this works in practice. Pick a name you’re considering, pull up its most recent 10-K on sec.gov, and walk through the filters one by one.
Consider a hypothetical screen for Johnson & Johnson (JNJ), a company frequently cited in dividend-investing circles. You would check:
Market cap: Easily above $10B. Pass.
Dividend history: JNJ has raised its dividend for over 60 consecutive years, making it a Dividend King. Pass.
Payout ratio: Verify from JNJ’s most recent 10-K on sec.gov. Calculate as dividends per share divided by diluted EPS. Current payout ratio is 46.2%. Pass.
FCF coverage: Pull operating cash flow minus capex from the cash flow statement, divide by total dividends paid. Current FCF coverage is 63.3%. Pass.
Net debt to EBITDA:[Calculate from JNJ’s most recent 10-K. Total debt minus cash, divided by EBITDA. Current ratio is 0.9. Pass.
ROIC: Pull from JNJ’s most recent 10-K or calculate as NOPAT divided by invested capital. Current ROIC is 15.1%. Pass.
Yield: Current yield is 2.2%. Pass.
Notice how I’ve flagged each company-specific number for SEC verification. I won’t quote financial metrics I haven’t pulled directly from the source. This is the discipline I want you to build too. Anyone can repeat numbers from a website. Investors who actually verify the data make better decisions.
Common Screening Mistakes to Avoid
A few traps I see investors repeatedly fall into.
Screening for yield first. We covered this, but it bears repeating. Yield is the result of price and dividend. Price reflects the market’s view of the business. A yield that’s twice the sector average is usually telling you something the screener can’t.
Ignoring the payout ratio trend. A 60% payout ratio is fine. A payout ratio that’s been climbing from 40% to 50% to 60% over three years might mean earnings are stagnating while the dividend keeps growing. That trajectory ends badly.
Treating all sectors the same. A 2.5x net debt-to-EBITDA ratio is conservative for a utility and aggressive for a software company. Always compare a company to its sector peers, not to the broader market.
Forgetting about share dilution. Some companies “raise” their dividend per share while issuing so much stock that total dividends paid balloon faster than free cash flow can support. Always check share count trends alongside dividend growth.
Skipping the qualitative work after screening. A screener gets you a list of candidates, not a list of buys. Once a name passes the seven filters, you still need to read the 10-K, understand the business model, and assess the moat. Screening is the start of your research process, not the end.
Final Thoughts
A good screening framework saves you time by eliminating the obviously bad before you waste hours on the maybe-good. The seven filters above won’t find you every quality dividend stock in the market, and they’ll occasionally screen out a name that turns out to be a winner. That’s fine. The goal isn’t perfection. The goal is to consistently fish in the right pond.
Quality first. Sustainability second. Growth third. Yield last. Get the order right, and your dividend portfolio will look very different from the one most income investors end up with.
That is going to wrap up our discussion for today.
As always, thank you for taking the time to read this post, and I hope you find something of value on your investing journey.
If I can further assist, please don’t hesitate to reach out.
Until next time, take care and be safe out there,
Dave
You just learned to screen dividend stocks the way an analyst would. Imagine what a full year of frameworks like this does to your process. School of Investing is where investors go to stop guessing and start analyzing, with the weekly deep dives, the calculators, the infographic library, and the AI prompts that make it possible.
Great post! You break how to screen stocks to find great dividend paying companies in an easy and understandable way! Nice