
How to Measure a Company's Efficiency

When you invest in a company, you're not just buying a stock ticker; you're buying a piece of a business. And just like you wouldn't want to own a car that guzzles gas and is always in the shop, you don't want to own a business that wastes its resources.
Efficiency metrics help us peek under the hood. They show us how well a company uses its assets, capital, and operational processes to generate sales and profits. Think of it as measuring how much "bang" the company gets for its "buck."
Here are five essential metrics to help you gauge a company's efficiency.
Operating Margins
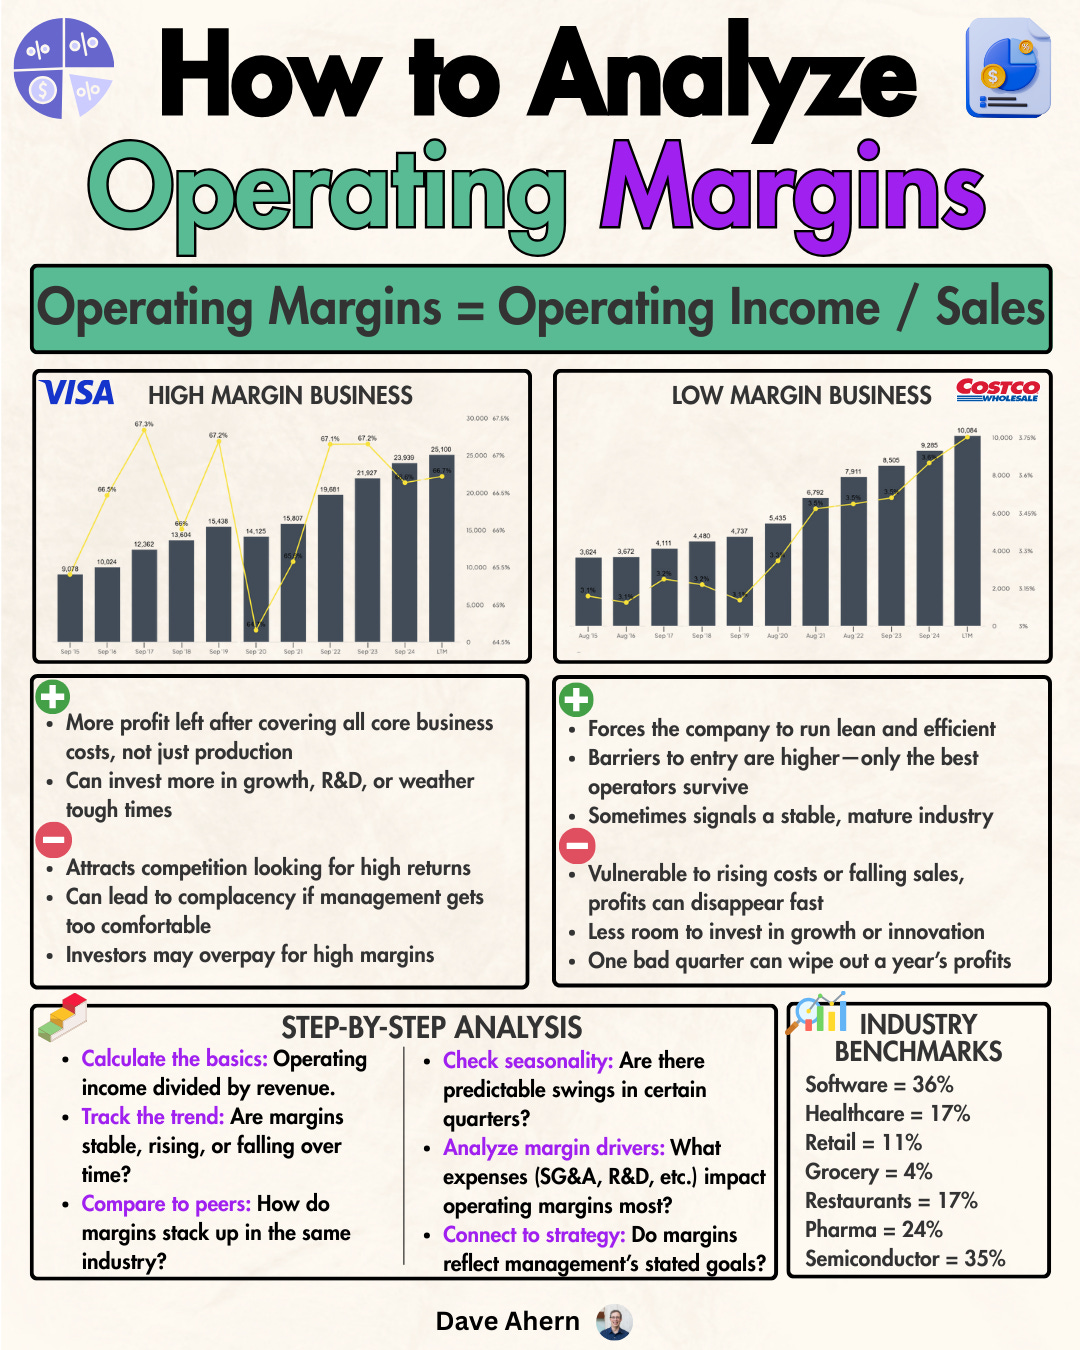
What it is: This metric shows how much profit a company makes from its core business operations for every dollar of sales, before accounting for interest and taxes. It strips away financing and tax strategies to give you a pure look at the business's day-to-day profitability.
Why it matters: A high or rising operating margin is a fantastic sign. It suggests the company has strong pricing power (it can charge more without losing customers) or it's becoming better at controlling its costs. A declining margin can be a red flag that competition is heating up or costs are getting out of control.
How to use it: Compare a company's operating margin to its own history and to its direct competitors. A software company will naturally have a much higher margin than a grocery store, so context is everything.
Return on Invested Capital
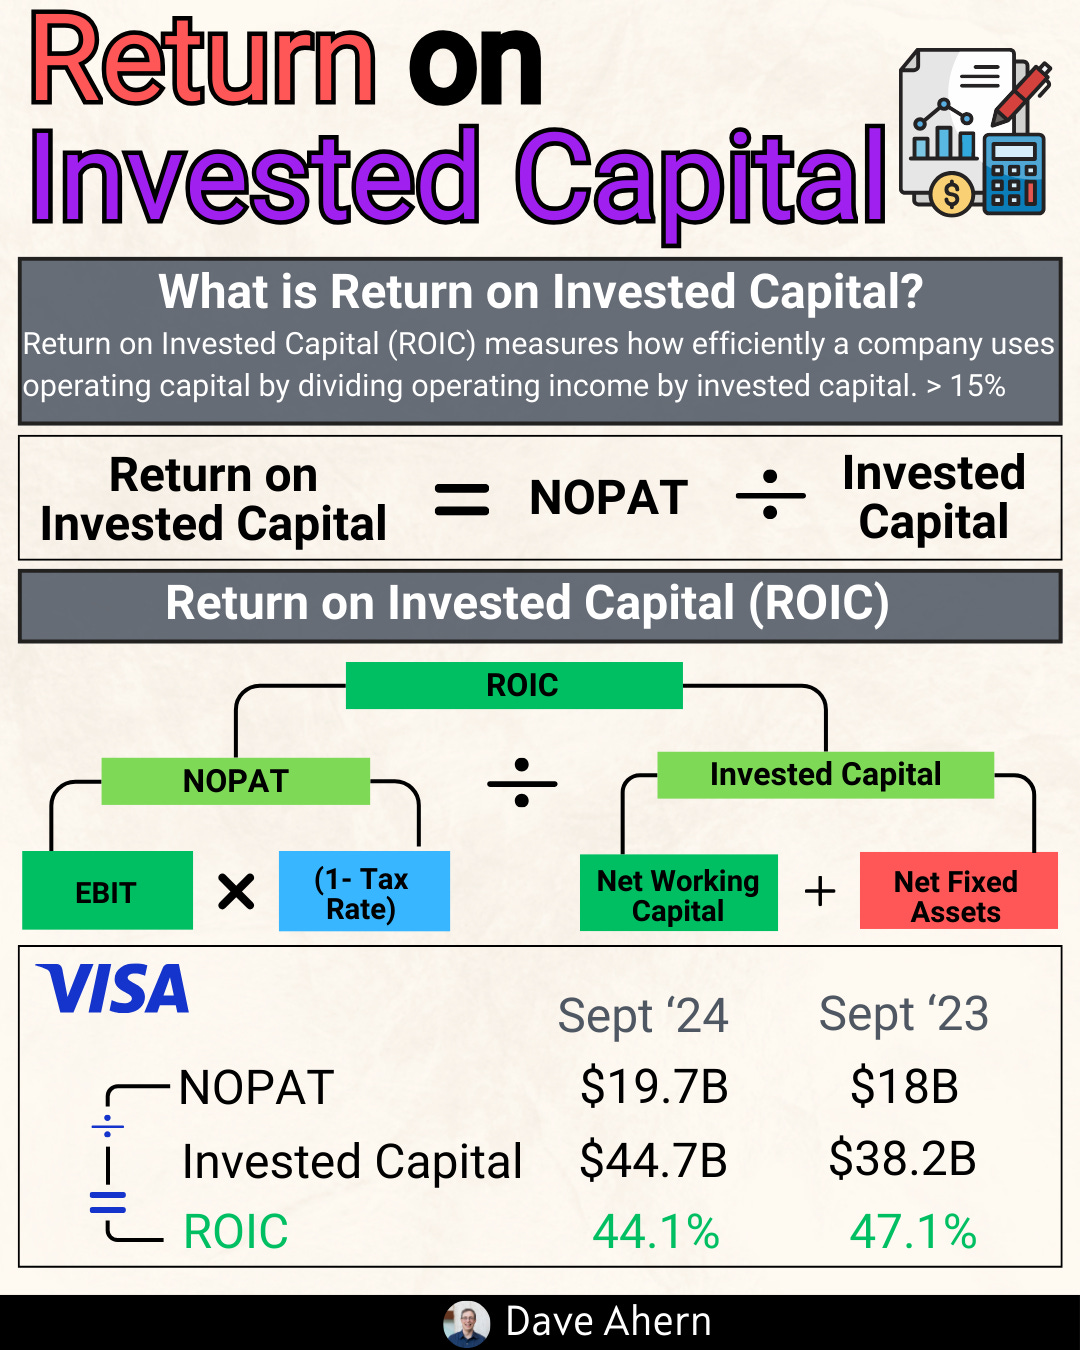
What it is: Think of this as the ultimate report card for management. ROIC measures how much profit the company generates for every dollar of capital invested in the business—and that includes both money from shareholders (equity) and from lenders (debt).
Why it matters: A company with a consistently high ROIC (say, above 15%) is likely a high-quality business with a strong competitive advantage, or "moat." It shows that management is excellent at allocating money to projects that earn great returns. It answers the question: "Is the leadership team creating real value with the money they have?"
How to use it: Look for companies with a high and stable (or rising) ROIC over many years. This is often a hallmark of the best long-term compounders.
Asset Turnover Ratio
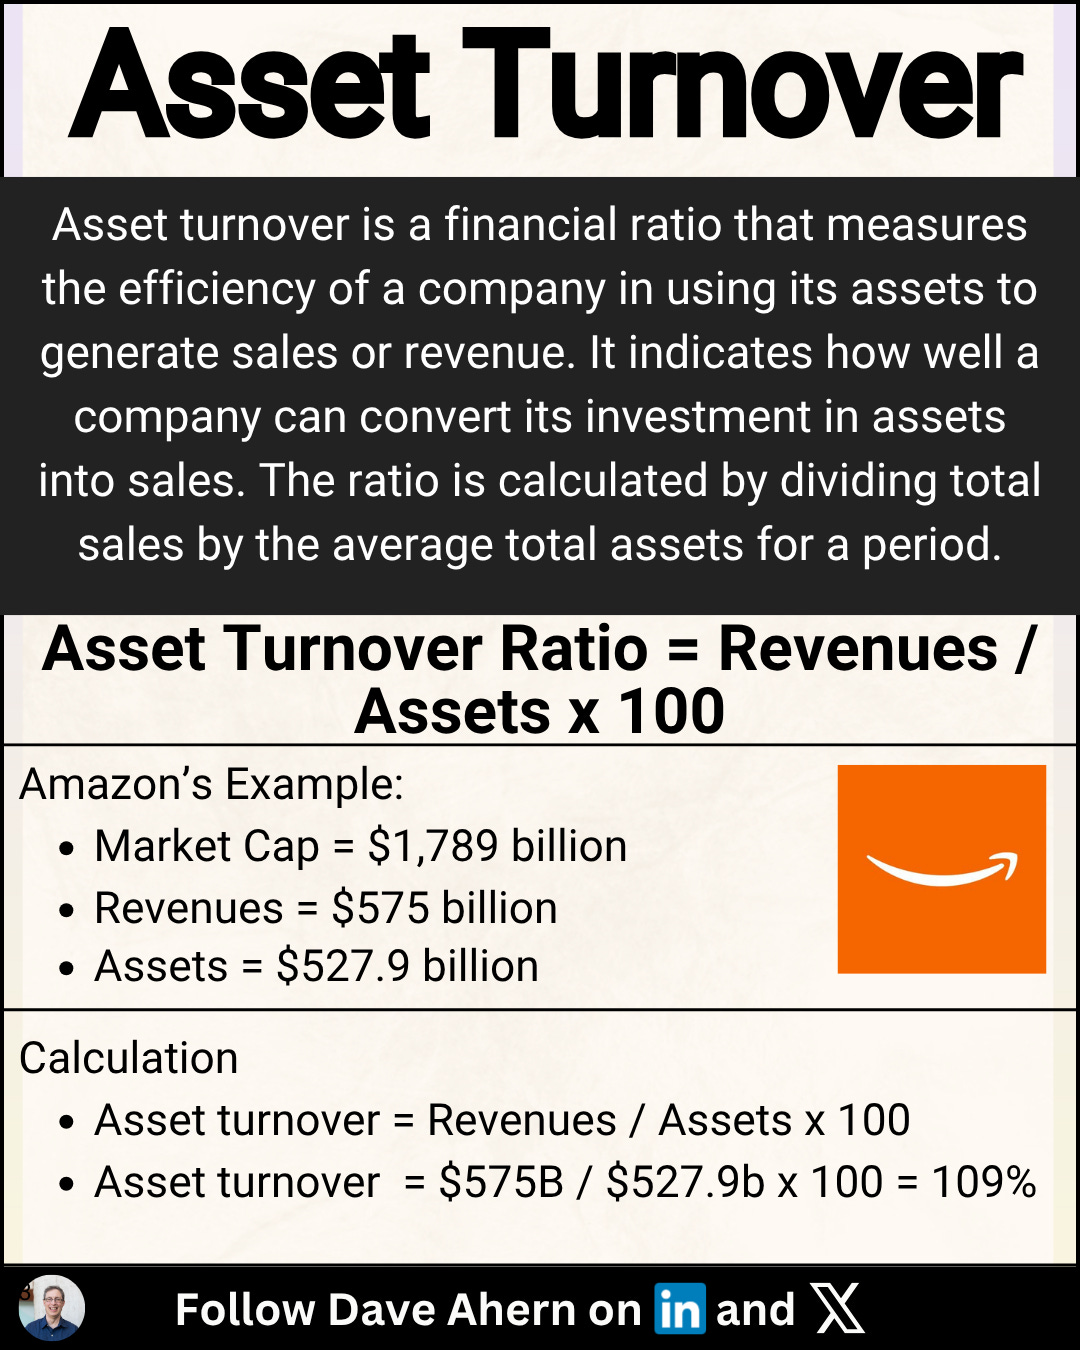
What it is: This metric measures how efficiently a company uses its assets (like factories, equipment, and inventory) to generate revenue. The formula is simply Total Revenue / Total Assets.
Why it matters: A higher asset turnover ratio means the company is getting more sales mileage out of its asset base. A low number might suggest the company has invested heavily in assets that aren't producing much revenue. Think of two factories: one is running 24/7, churning out products (high turnover), while the other sits idle most of the week (low turnover). You'd rather own the busy one.
How to use it: This is another metric that is highly industry-specific. A retail company will have a much higher asset turnover than a heavy industrial manufacturer. The key is to compare it to peers and look for trends over time.
Inventory Turnover
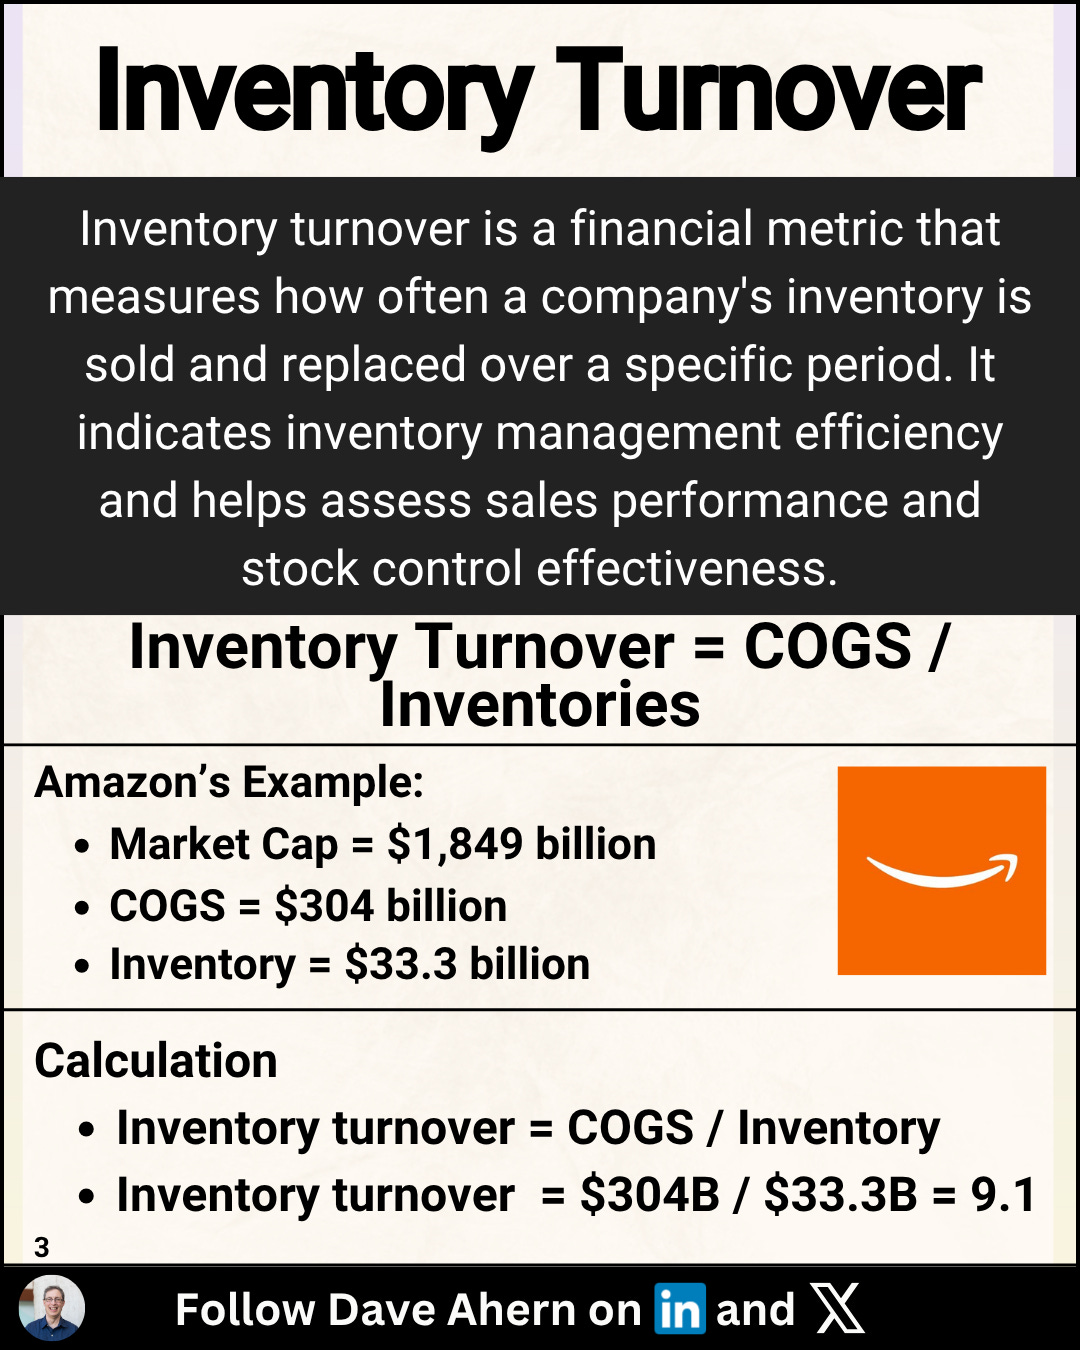
What it is: For any company that sells physical products, this is crucial. It measures how many times a company sells and replaces its entire inventory over a specific period (usually a year). A close cousin is "Days Inventory Outstanding," which tells you the average number of days it takes to sell the inventory.
Why it matters: A high inventory turnover is a sign of strong sales and efficient supply chain management. It means products aren't sitting on shelves collecting dust. Slow turnover can signal weak demand or poor inventory management, which can lead to markdowns and wasted capital. Think of a grocery store selling fresh bread quickly versus a dusty antique shop.
How to use it: Look for a stable or increasing inventory turnover relative to competitors. A sudden drop can be an early warning sign of trouble.
Cash Conversion Cycle
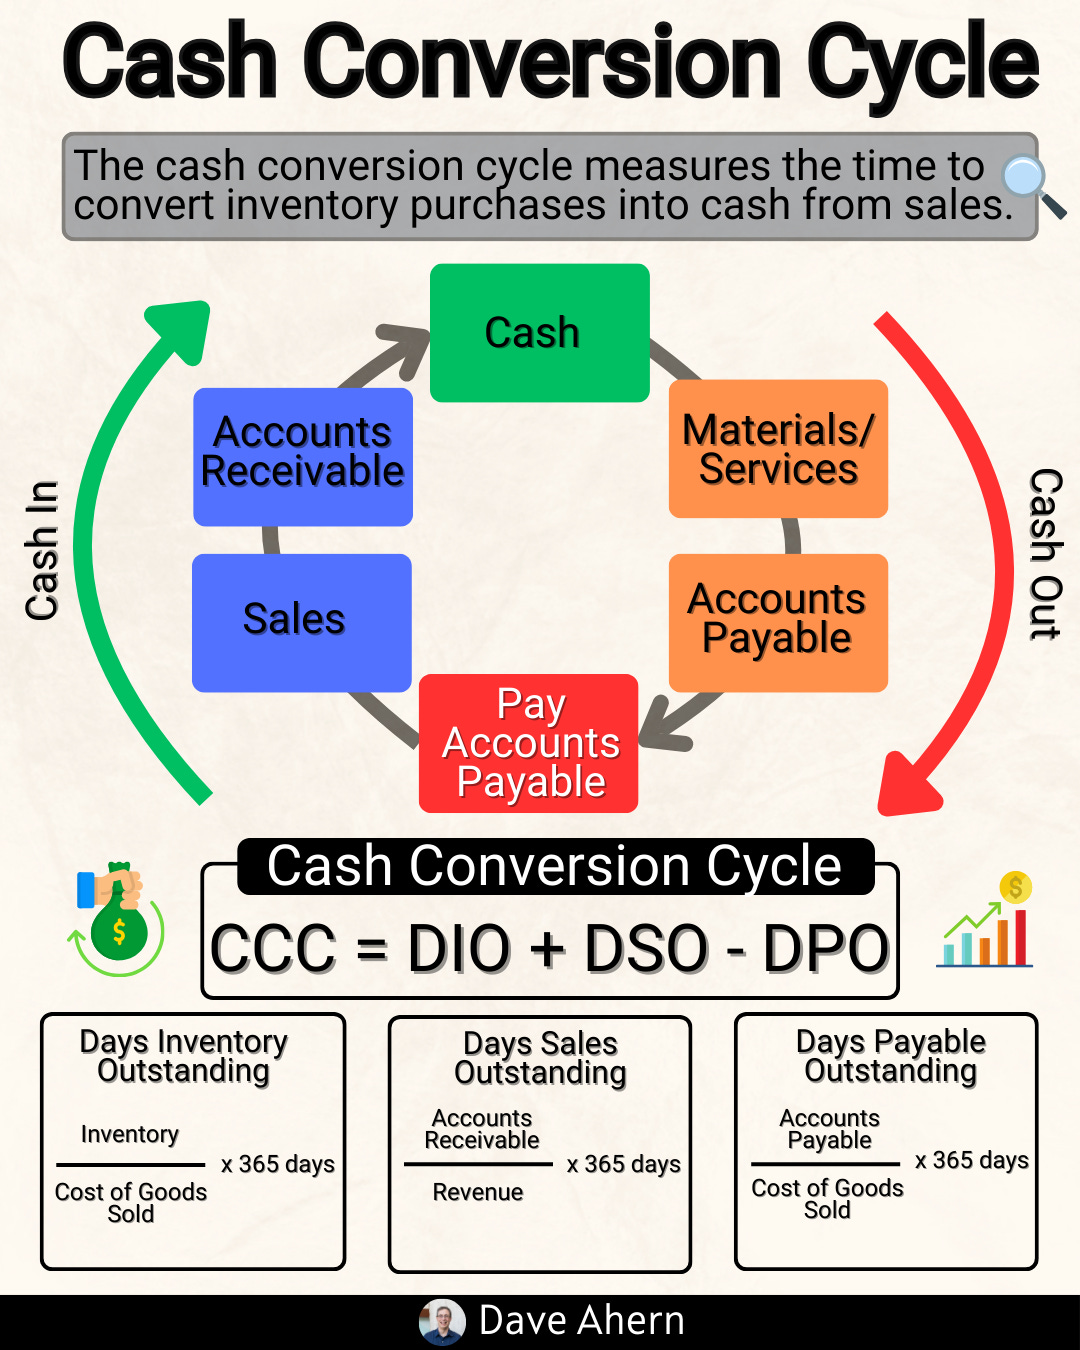
What it is: This one sounds complex, but the idea is simple. It measures the number of days it takes for a company to convert its investments in inventory and other resources into cash from sales. It tracks the entire operational loop: from the day it pays for its supplies to the day it gets paid by its customers.
Why it matters: A shorter cash conversion cycle is better. It means the company's cash isn't tied up for long periods in its operations. Some incredible businesses, like Amazon, have a negative CCC, meaning they get paid by customers before they even have to pay their suppliers—it's like getting paid to grow!
How to use it: A low and stable CCC is a sign of a very efficient, cash-generating business model. Comparing it to industry rivals can reveal who has the most operational leverage.
No single metric tells the whole story. By using these five lenses together, you can get a much clearer picture of how well a company is run and whether it's the kind of efficient, value-creating machine you want to own for the long term.
Hey, thanks for this overview article
If you have the time, I would kindly ask you a small favor.
If you’d like, could you please review my proposed modification to the CCC metric to reflect prepayments, accrued expenses, and most importantly (the initial motivation) deferred revenue…
I described it in the following article, and use it frequently. I am convinced it is a neat and useful idea (obviously :) ), but I never received any consctructive feedback.
Thank you for your consideration.
https://compcap.substack.com/p/modifications-to-working-capital