
How to Identify Capital-Light Compounders: Understanding Capital Intensity and FCF Durability

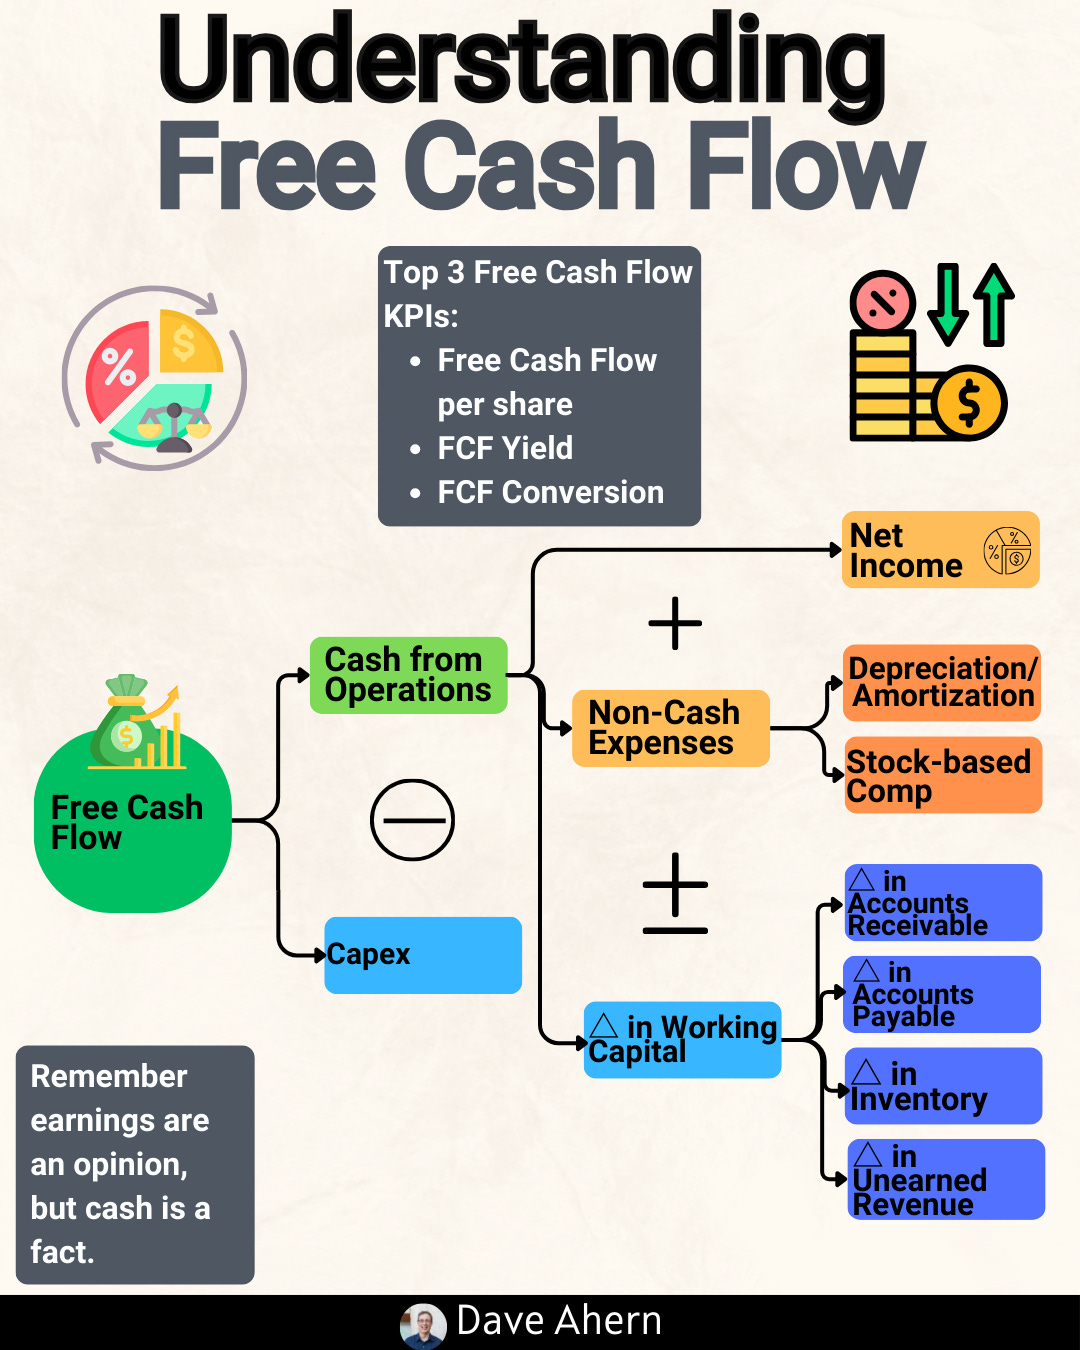
Free cash flow remains one of the most important metrics for evaluating any investment. But here’s the thing: not all free cash flow is created equal. Some companies generate mountains of cash that they can return to shareholders year after year. Others produce impressive cash flow numbers that look great on paper, only to watch that cash disappear into equipment, factories, and maintenance spending just to keep the lights on.
The difference between these two types of businesses comes down to capital intensity and FCF durability. Understanding these concepts remains essential for identifying the compounding machines that can build wealth over decades versus the businesses stuck on a never-ending reinvestment treadmill.
In today’s post, we will learn:
Okay, let’s dive in and learn more about capital intensity and FCF durability.
What is Capital Intensity?
Capital intensity measures how much a company must invest in physical assets, property, plants, and equipment to generate revenue. Think of it as the “toll” a business pays to stay competitive.
Some businesses require massive ongoing investments just to maintain their position. Semiconductor manufacturers need multi-billion-dollar fabrication plants. Telecom companies must continuously upgrade network infrastructure. Airlines need to maintain and replace their fleets.
Other businesses operate with minimal physical assets. Payment networks process trillions in transactions through software and data centers. Software companies deliver products through downloads. Consulting firms sell expertise that walks out the door each night.
The bottom line remains this: capital-light businesses keep more of what they earn. Capital-heavy businesses must continuously feed the machine.
How to Calculate the Capital Intensity Ratio
I know this sounds complicated, but it isn’t. The formula looks like this:
Capital Intensity Ratio = Capital Expenditures ÷ Revenue
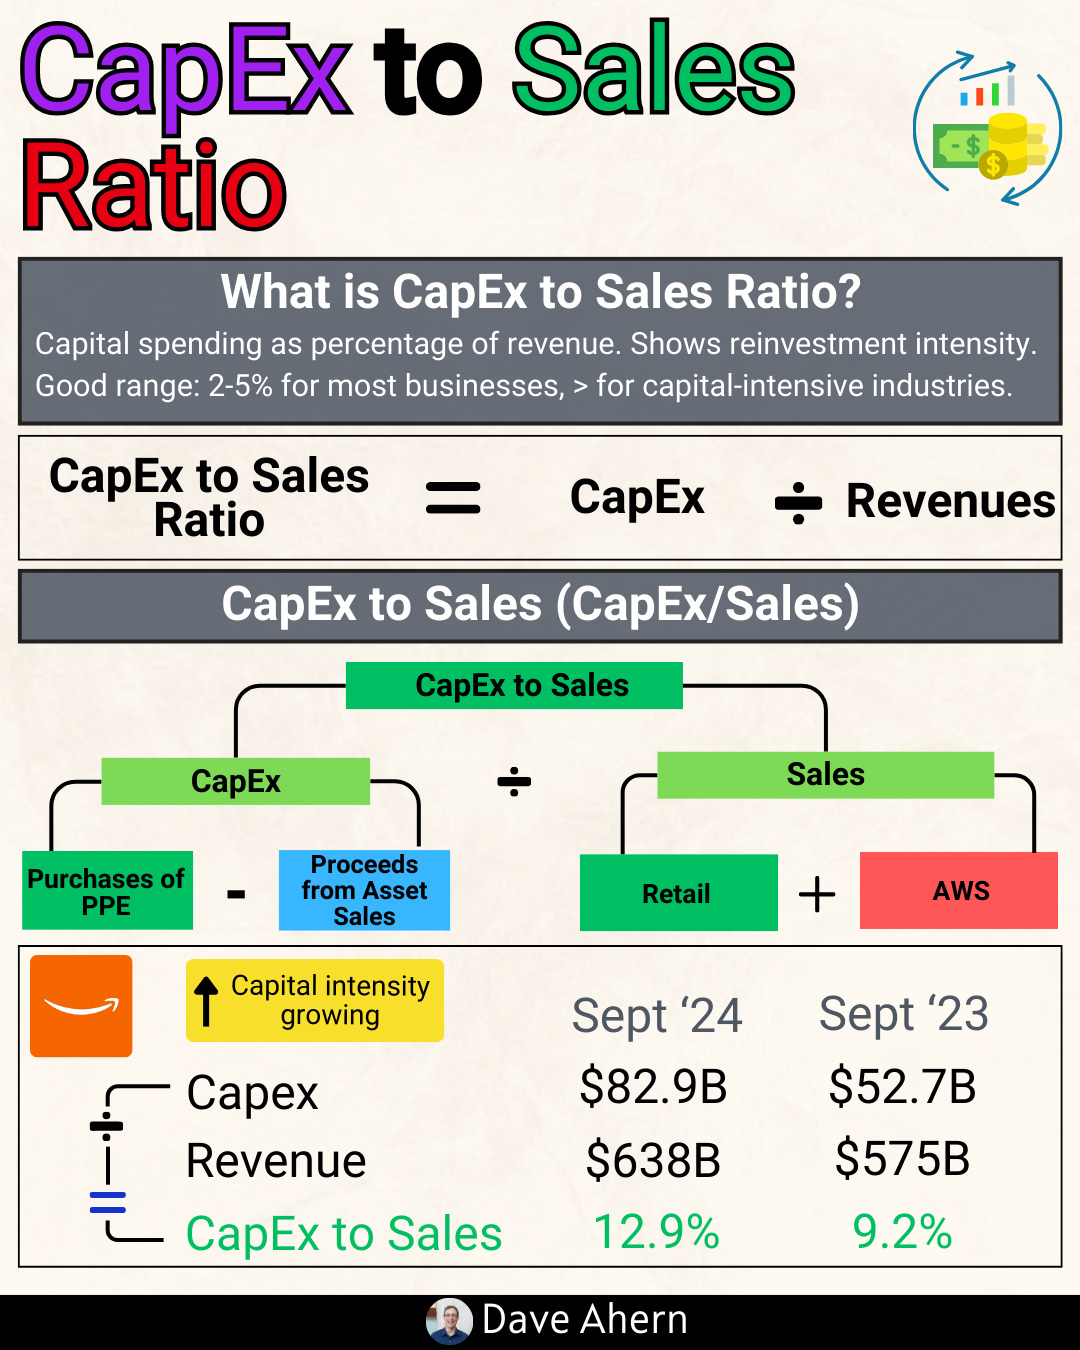
Where:
Capital Expenditures (CapEx): Found on the cash flow statement, this represents purchases of property, plant, and equipment
Revenue: Total sales from the income statement
A lower ratio indicates a capital-light business. A higher ratio signals a capital-heavy business that must reinvest heavily to generate each dollar of revenue.
As a general framework:
Below 5%: Capital-light (software, payments, consulting)
5-15%: Moderate (consumer goods, retail)
Above 15%: Capital-intensive (semiconductors, utilities, telecom)
Here’s the thing: most investors look at free cash flow and think they understand what they’re seeing. But without understanding capital intensity and FCF durability, you might be buying a business that looks like a cash machine today, only to watch that cash disappear into maintenance spending, equipment upgrades, and competitive reinvestment tomorrow.
The difference between a true compounder and a capital trap often isn’t obvious from the headline numbers.
In the rest of this article, we’ll dig into three real companies, pulling actual data from their SEC filings, to show you exactly how to tell the difference. You’ll walk away with a practical framework for identifying capital-light compounders that can build wealth for decades.
