
How to Evaluate Pricing Power (With Microsoft as the Case)

Great businesses don’t just raise prices—they make you feel like you’re getting a deal even when you pay more.
That’s pricing power: the ability to hold or lift price without losing customers or eroding unit economics. You can hear about it in interviews and investor decks, but you see it in the financials, in margins that hold up across cycles, in capital that earns more than it costs, and in cash that shows up predictably.
If you want a durable way to spot quality, stop hunting for one-off catalysts and start measuring whether a company can defend and expand its economics over time. Microsoft is a clean illustration of what that looks like in practice.
TL;DR
Look for multi‑year gross and operating margin stability or gentle expansion alongside unit growth. That’s a strong pricing power tell.
Cross‑check “quality” with ROIC > WACC by a healthy spread and consistent FCF conversion (cash from operations less capex).
Per‑share framing matters: rising FCF/share and EPS with a flat/down share count beats headline growth with dilution.
Evidence lives in filings: segment notes, seat growth vs ARPU, unearned revenue (for SaaS), SBC and buyback dynamics.
Decision rule: prefer businesses with sustained ROIC – WACC > 5%, stable/expanding operating margins, FCF margin > 20% (sector‑dependent), and recurring revenue visibility.
Why pricing power is the center of quality investing
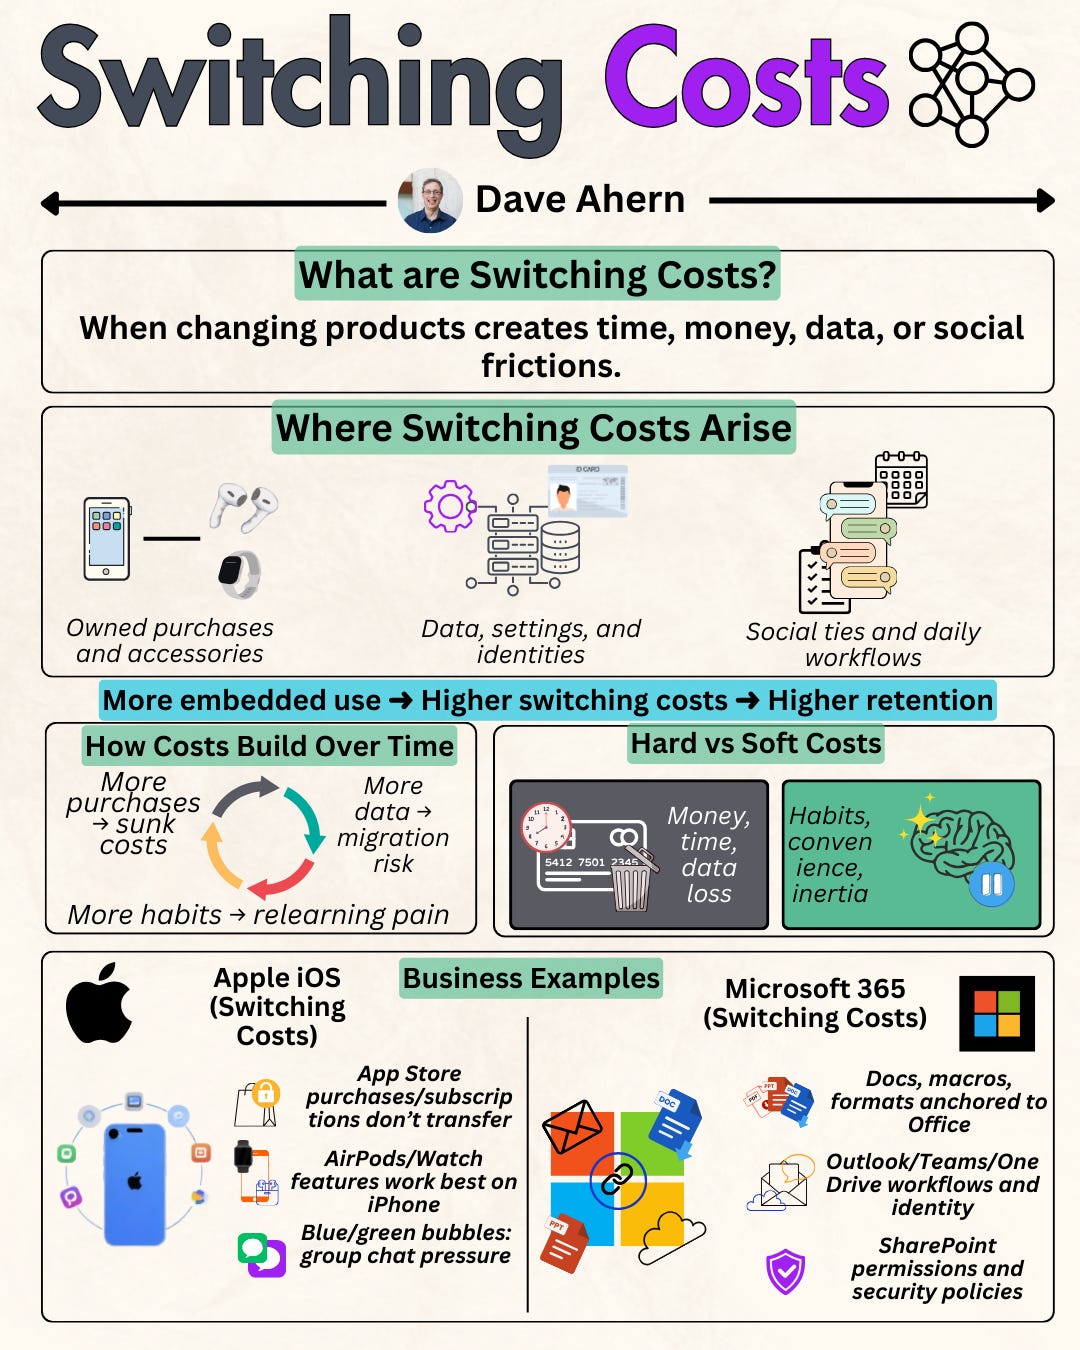
A business without pricing power is at the mercy of the cycle. When input costs rise, inflation bites, or competitors offer discounts, weak businesses either lose volume or surrender their margins. Quality businesses possess key advantages: switching costs, network effects, brand, regulatory permissioning, habit formation, and product breadth. These aren’t buzzwords; they express themselves in economics.
Customers accept periodic price lifts or richer bundles because the product’s value-to-price ratio remains favorable, and because alternatives are inconvenient or inferior.
In practice, that means you should expect two patterns.
First, gross margins that are stable or trending up over multi-year windows, even as product mix evolves. Second, operating margins that don’t fluctuate when growth investments ramp up. Firms with true pricing power can sustain product-level unit economics while funding innovation and driving go-to-market strategies. This isn’t about perfection in any single year; it’s about a slope and a range over time.
Pricing power is also reflexive: steady margins allow management to reinvest in product superiority, which in turn reinforces pricing power, thereby sustaining margins. The flywheel only breaks when the moat erodes or a disruptive model resets the value equation.
Turning financial statements into signals: the framework
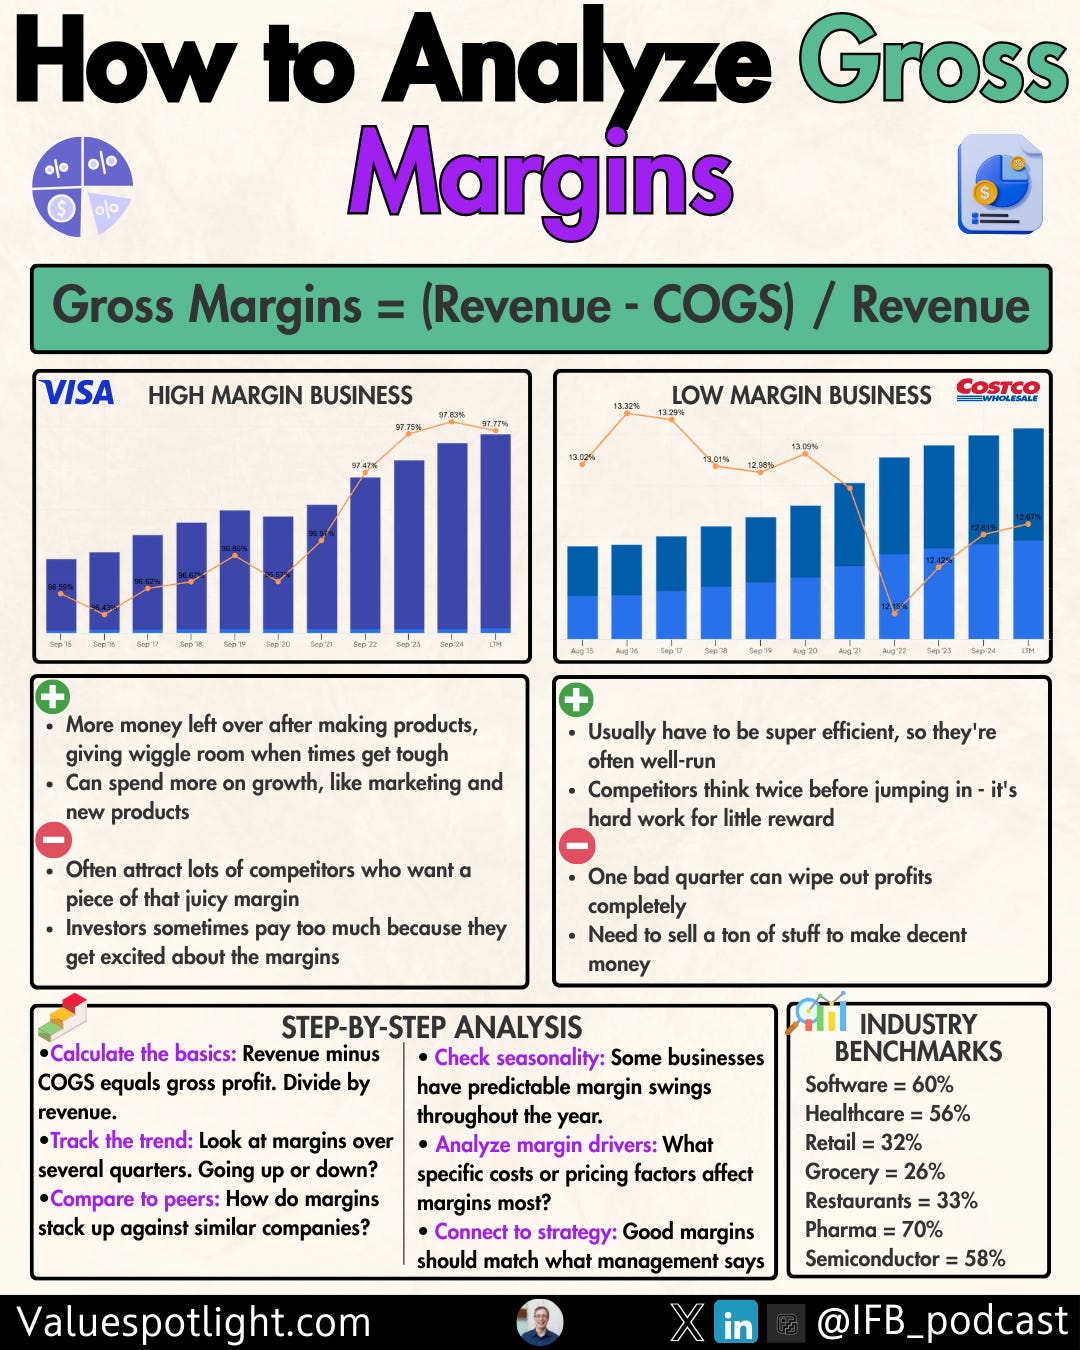
The framework begins with margin stability and expands to include capital efficiency and cash discipline. Begin with gross margin because it isolates core unit economics from operating expenses. If price lifts are real and the offering is differentiated, you typically see gross margin resilience, even as costs fluctuate. Then study operating margin, which is calculated by layering on sales, R&D, and overhead. You don’t want starvation-based margins; you want healthy spend that yields future growth while preserving profitability within a reasonable band.
Two structural nuances matter.
Mix shifts can raise or lower reported margins without providing much insight into pricing power. In software and cloud, subscription and usage models can look different at the gross line depending on infrastructure intensity and third-party costs. You should read segment disclosures to understand whether margin movement is a function of mix or a change in underlying unit economics.
Second, recurring revenue dynamics, annual commitments, price escalators, and bundled suites can stabilize both revenue and margin. If management can introduce price increases with low churn and sustained per-seat adoption, that’s tangible evidence of pricing power.
Once margins pass the smell test, test the economics by comparing ROIC to WACC and FCF conversion. ROIC determines whether the capital the business invests in its assets and intangibles earns a premium over its financing costs. FCF conversion tells you whether accrual earnings translate into actual cash after necessary reinvestment. Good businesses produce both.
We’ll use these definitions:
ROIC = NOPAT / Invested Capital
where NOPAT is net operating profit after taxes, and Invested Capital is operating assets minus operating liabilities (or, more simply, equity plus net debt minus non-operating assets).
WACC = (E /D+E)⋅re+(D/D+E)⋅rd⋅(1−T)
where E and D are market values of equity and debt, r_e is the cost of equity, r_d is the pre-tax cost of debt, and T is the tax rate.
FCF = Operating Cash Flow−Capital Expenditures
FCF conversion in practice is typically measured as FCF relative to net income or to NOPAT over multi-year periods.
Microsoft as a case study: reading margin stability in the wild
Microsoft is particularly useful because it spans multiple economic models, per-seat productivity suites (Microsoft 365), platform and usage-based cloud (Azure), on-premises and hybrid licensing, and a growing AI stack.
It also has material R&D and sales investments, making operating margin discipline a real managerial choice rather than an accident of under-spending.
Over the past decade, investors have faced several pressures and tailwinds, including the shift from perpetual licenses to subscriptions, the rise of Azure with heavier infrastructure costs compared to pure software, and recent AI training and inference investments that accelerate capital expenditures.
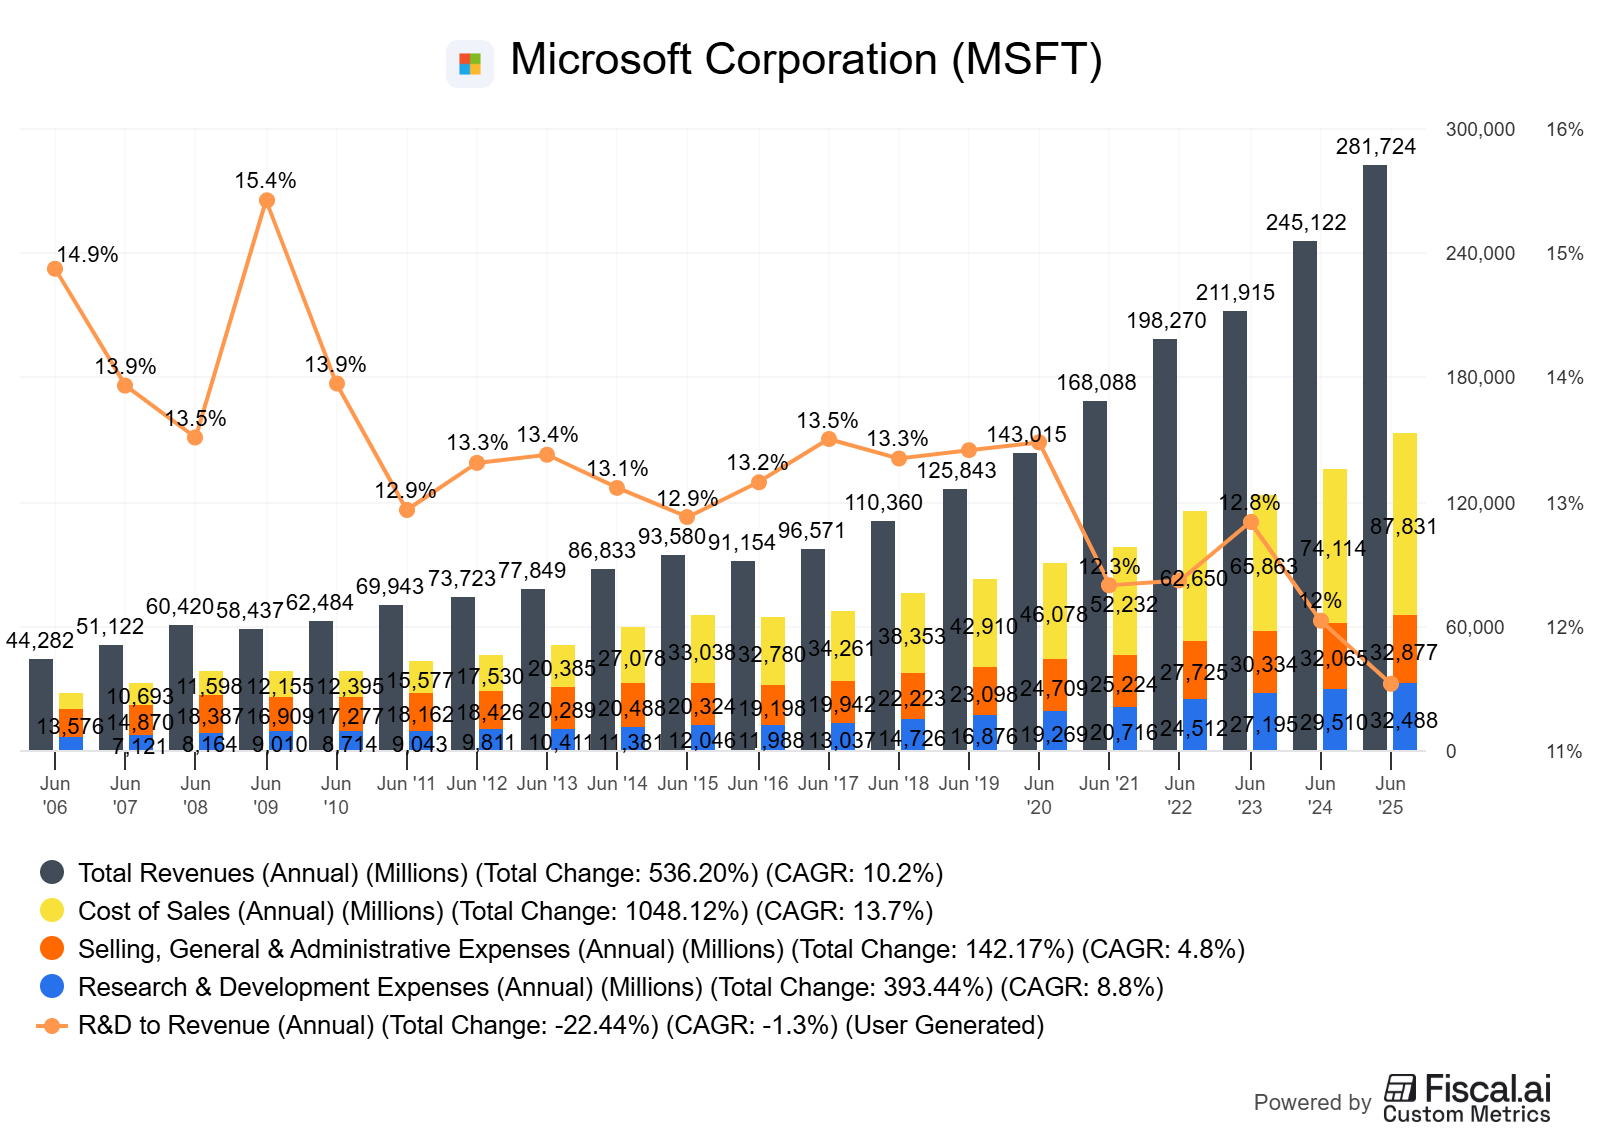
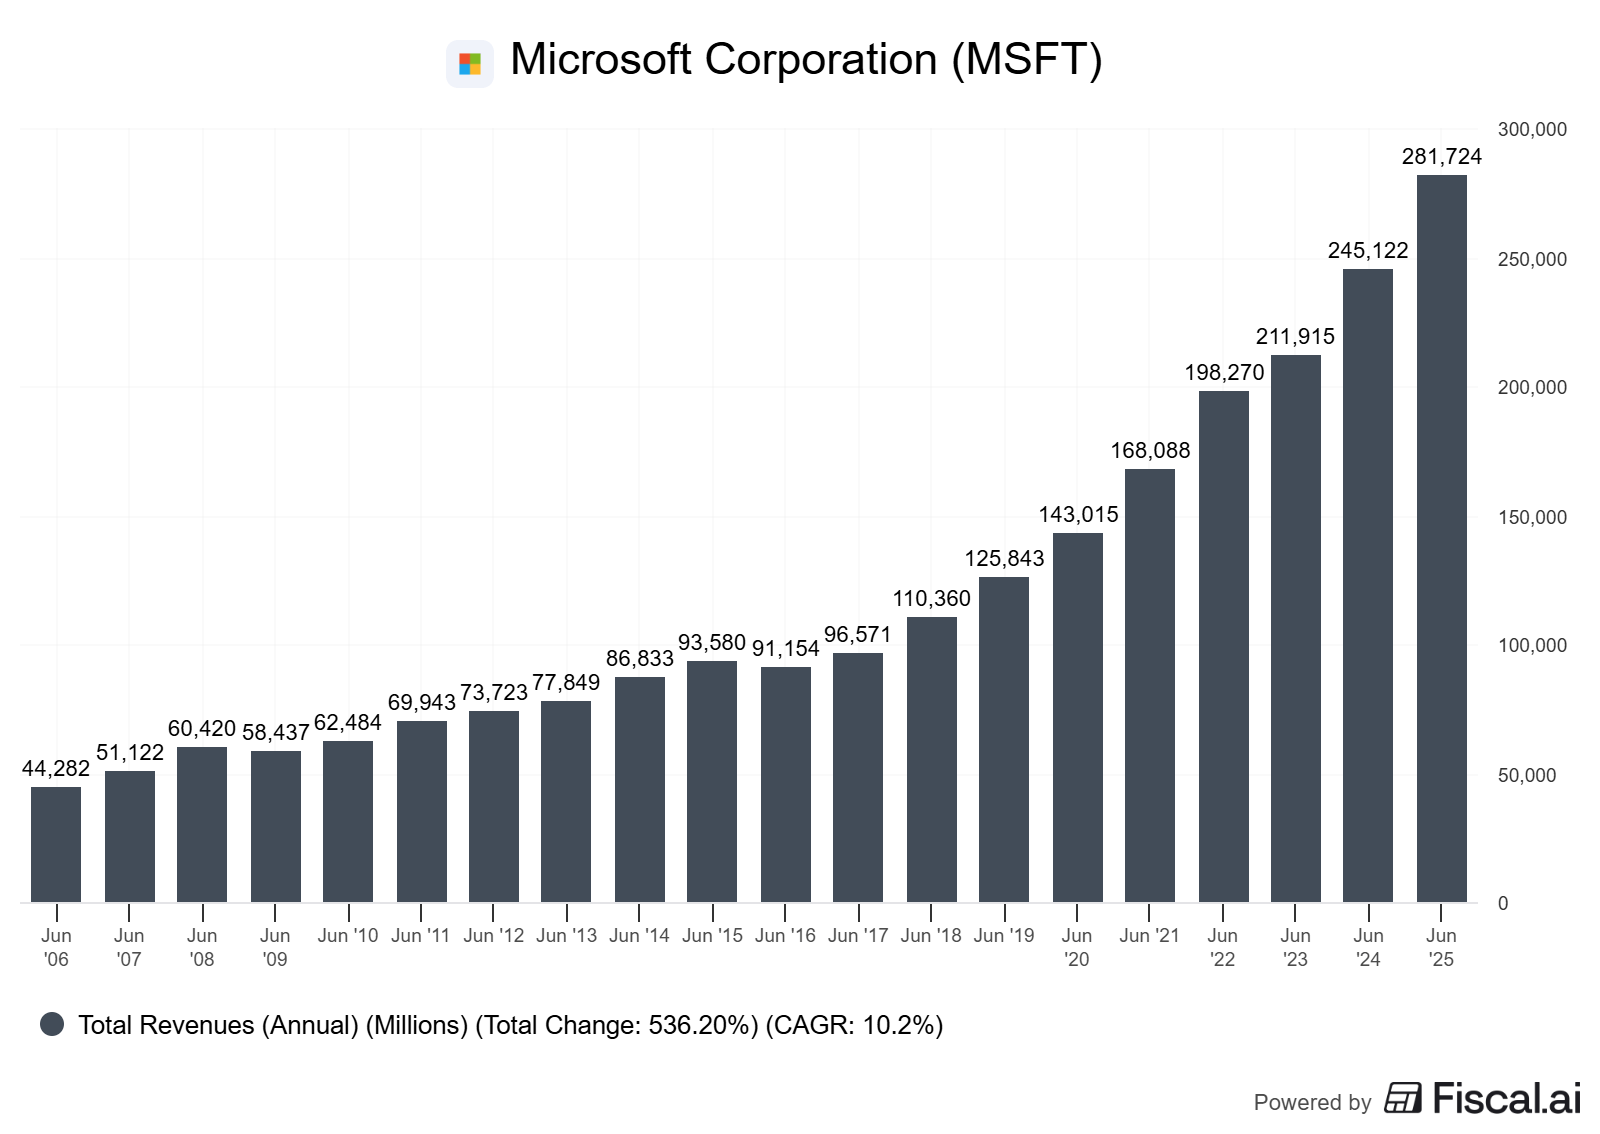
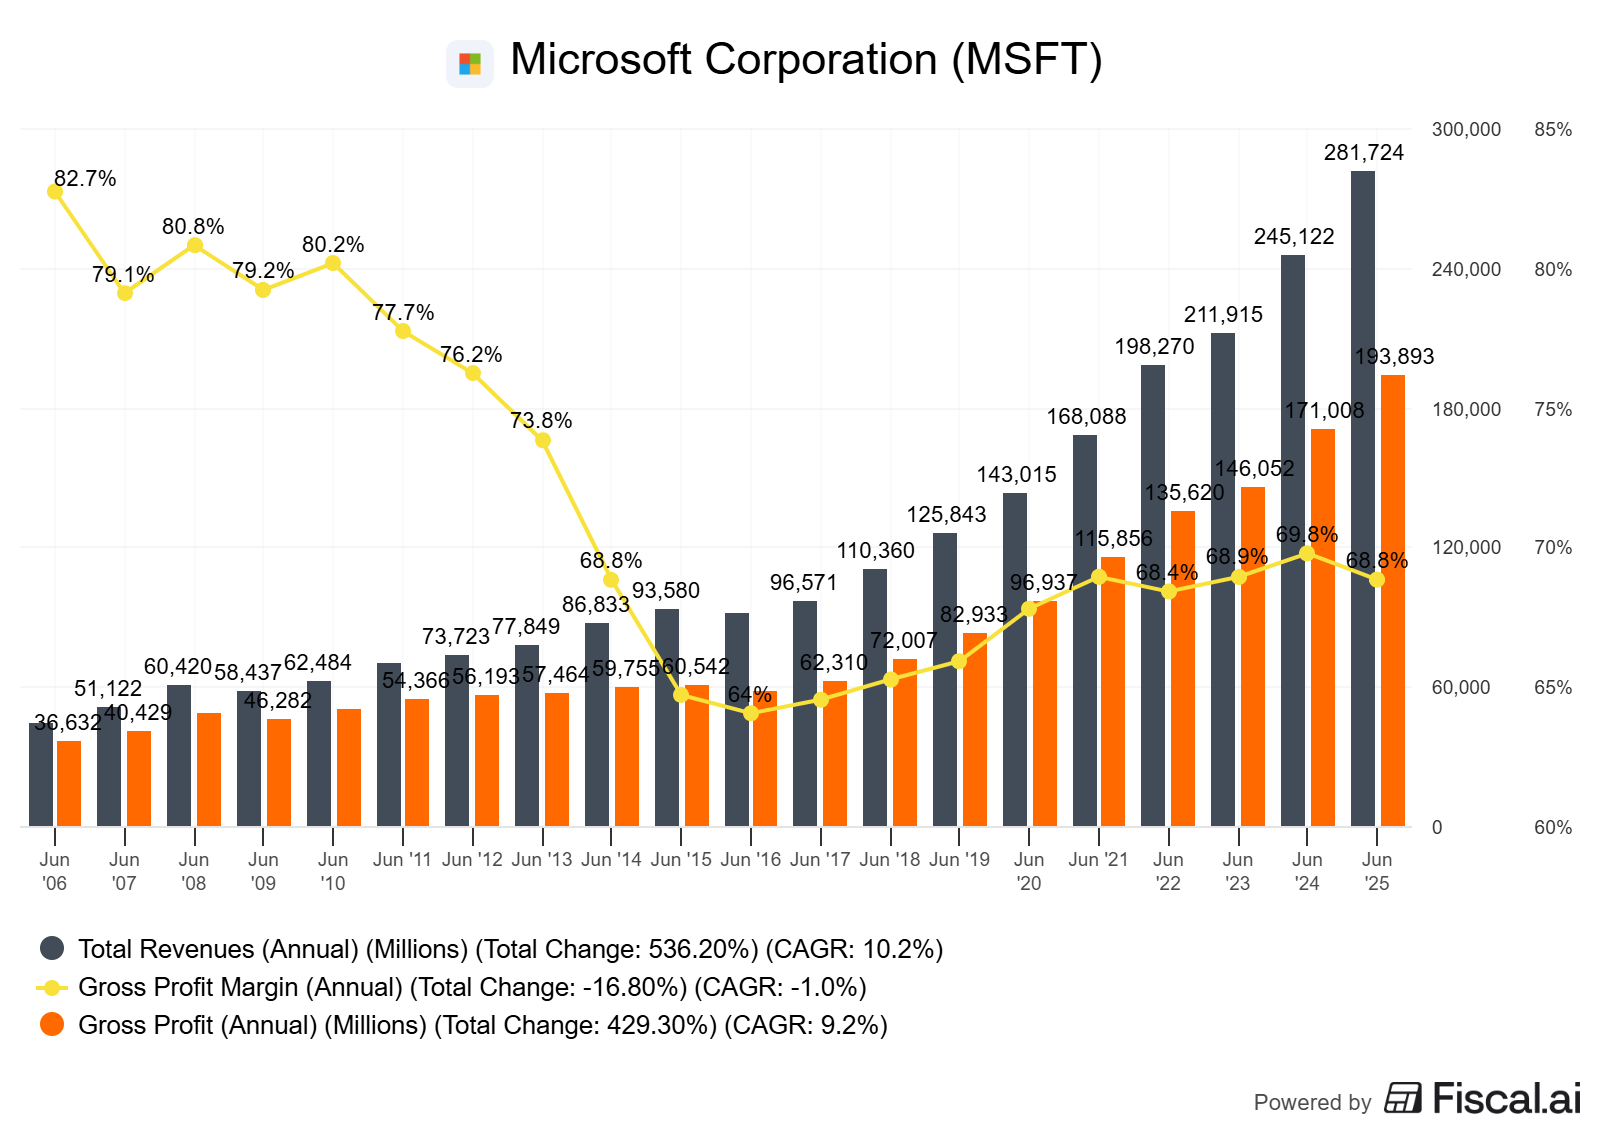
Despite these changes, Microsoft’s consolidated gross margin has stayed solidly in the high range typical for large-scale software-led companies, and operating margin has operated within a disciplined band, trending stronger as the scale of cloud and subscription economics improved. The exact percentages move with the mix, but the larger point holds: the multi-year pattern shows resilience rather than deterioration.
There are a few tangible drivers behind this. First is product indispensability.
Office productivity is deeply embedded in workflows. Even as Microsoft has introduced price increases, for example, commercial Microsoft 365 seat price changes and E5 adoption, companies have absorbed them because the bundle consolidates spend, enhances security and compliance, and reduces vendor complexity. The incremental value of features such as advanced security, compliance, and analytics increases willingness to pay.
Second is the bundling and packaging strategy. Microsoft often defends or expands its margin by increasing the value density of the suite, not just the sticker price. When more is included for each seat, the total cost of ownership to the customer can decrease, even as Microsoft’s per-seat revenue increases.
That is pricing power expressed through product strategy.
Third is cloud scale economics. Azure’s unit costs benefit from enormous buying power, data center optimization, and custom silicon partnerships. As usage grows, these efficiencies help counterbalance periods of heavy investment. Mix does matter—cloud infrastructure is more capital-intensive than pure software, but Microsoft’s overall margin profile shows that the firm manages this trade-off without sacrificing the core advantage of its software franchises.
Finally, operating discipline is present. R&D has remained robust, and the go-to-market strategy is funded, but the company has not pursued growth at any cost. The operating expense base adjusts to changing conditions, and productivity initiatives emerge as operating leverage when revenue growth accelerates.
The result is not a maximal margin every quarter, but an attractive band over time.
What should you read in the filings to see this yourself?
Focus on the gross margin and operating margin commentary in Management’s Discussion and Analysis (MD&A), where management explicitly calls out drivers, mix, data center costs, headcount, amortization of capitalized software, and revenue recognition effects. Scan segment-level margins for Productivity and Business Processes, Intelligent Cloud, and More Personal Computing to see where the pressure or leverage lives in a given year.
That context lets you distinguish between temporary mix effects and changes in underlying unit economics.
Cross-checks: ROIC vs. WACC and FCF conversion,
Margin stability is the first filter. The second is capital efficiency: does the company earn a return on invested capital that clears its cost of capital with a comfortable margin of safety?
Microsoft’s long-run profile has been that of a company earning ROIC well in excess of WACC. This reflects high margins, asset-light software components, disciplined working capital management, and acquired intangibles that continue to generate cash flows. WACC, meanwhile, benefits from an A/Aaa credit profile and a massive equity base that lowers the proportionate cost of debt. Even as capital expenditures have risen with cloud and AI, the returns profile remains attractive so long as incremental projects earn above the hurdle.
Free cash flow conversion is the third check.
Subscription models with deferred revenue can create timing nuances between revenue and cash, but the signal you want is multi-year FCF that broadly tracks earnings, after funding data centers and other growth capex. Microsoft’s strong cash generation funds capex, dividends, and buybacks, which in turn support per-share metrics like EPS and FCF per share—an underappreciated way to judge whether value is compounding for owners rather than just growing in aggregate.
For an additional sanity check, examine the relationship between operating margins, capital expenditure intensity, and revenue growth. A company that can grow at healthy rates while sustaining margins and not incurring excessive capital expenditures as a percentage of revenue is likely creating real value.
In recent years, Microsoft’s growth in cloud and AI has been accompanied by rising capital expenditures, but not at the expense of collapsing returns—an important nuance for investors concerned about “growth at any cost.”
Risks, counterpoints, and how pricing power can fade
Pricing power is not invincibility. Even strong companies face risks that, if compounded, can erode the economics. Regulatory scrutiny can limit bundling or require unbundling in certain markets, challenging the value density strategy. Open-source and low-cost alternatives can nibble away at segments of the product suite, particularly among cost-sensitive or developer-led buyers.
Platform shifts, mobile yesterday, AI-native workflows today, can alter where users derive core value and whom they attribute it to.
For Microsoft, the live questions center on the cadence of AI monetization in relation to the capital invested, the balance between inference costs and customer willingness to pay for AI-enhanced features, and competitive responses from hyperscale peers.
Watch for whether AI features increase average revenue per user without depressing gross margin, whether inference costs trend down with efficiency gains, and whether churn remains low despite new packaging.
If those outcomes hold, the pricing power thesis strengthens; if not, unit economics could tighten even if headline growth looks strong.
The repeatable checklist
Margin stability lens
Are gross margins stable or rising over 5–10 years despite changes in mix?
Do operating margins stay within a disciplined band while R&D and sales remain adequately funded?
Does management’s MD&A attribute margin changes to temporary mix/investment vs. structural price pressure?
Pricing power in action
Has the company executed price increases or bundle upgrades with minimal churn and sustained adoption?
Are value-add features (security, analytics, compliance, AI) driving willingness to pay?
ROIC vs. WACC
Is ROIC consistently above WACC by a healthy spread, and is incremental ROIC holding up as the company scales?
Do acquisitions and major capex projects clear a realistic hurdle rate?
FCF conversion and capital allocation
Does multi-year FCF track earnings after necessary capex?
Are dividends/buybacks funded by excess cash, not leverage that masks weak economics?
Are per-share metrics (FCF/share, EPS) rising in line with or faster than aggregate metrics?
Red flags
Persistent gross margin compression unexplained by mix.
Price increases paired with rising churn or elevated discounting.
ROIC trending toward WACC, especially as capex rises.
FCF lagging earnings over multi-year periods without a clear, high-return reinvestment story.
Mini glossary
Pricing power: The ability to raise or hold prices without losing volume or unit economics because customers perceive superior value or face high switching costs.
Gross margin: Revenue minus cost of goods sold; a proxy for product-level unit economics.
Operating margin: Operating income divided by revenue; reflects both unit economics and spending discipline.
ROIC: Net operating profit after tax divided by invested capital; a measure of how effectively capital generates returns.
WACC: The blended cost of equity and debt capital, after tax; the hurdle a company must beat to create value.
FCF conversion: The degree to which accounting earnings become cash after capital expenditures; strong conversion indicates durable economics.
Mix shift: Changes in the composition of revenue (e.g., cloud vs. software) that can influence reported margins without necessarily signaling pricing power changes.
Applying the framework beyond Microsoft
The power of this approach is its portability. Whether you are analyzing a vertical SaaS firm, a payments network, or a data platform, the same sequence holds: start with multi-year margin patterns, contextualize movements with segment mix and investment cadence, then validate with ROIC against WACC and FCF conversion. Treat management’s commentary as a hypothesis generator, not as proof. The proof is in whether margins hold up, capital earns a premium, and cash arrives reliably as the business scales.
Because this method relies on financial statements rather than short-term market narratives, it helps you navigate noisy conditions—such as new product cycles, macroeconomic jitters, and hype booms—without losing sight of the main point. If an exciting story tempts you, ask the three sober questions:
Are margins stable?
Does ROIC beat WACC?
Does cash conversion stay strong?
If the answers are yes over multi-year windows, you likely have an example of genuine pricing power.
Closing thought
Quality investing is not about finding businesses that never face pressure. It’s about finding those that can absorb pressure and still compound value.
Microsoft’s experience shows that pricing power isn’t a press release; it’s a pattern you can measure. Use margin stability as your entry point, confirm it with ROIC versus WACC and free cash flow conversion, and keep an eye on per-share compounding.
Build your checklist, run it consistently, and let time and arithmetic do the work.
Excellent breakdown, loved it. I think with their existing enterprise customers and partnership with OpenAI, they have a huge advantage in upselling AI add-ons to their office suite.