
How to Analyze Economic Moat Durability
A Complete Framework with Real Examples

Identifying a company with an economic moat remains one of the most important skills any investor can develop. But here’s the thing that trips up even experienced investors: finding a moat is only half the battle. The real challenge lies in determining whether that moat will still be standing five, ten, or twenty years from now.
A moat that’s eroding can turn a seemingly wonderful business into a value trap faster than you might expect. The financial statements will tell us when this erosion is occurring if we know where to look.
In today’s post, we will learn:
• What moat durability means and why it matters
• The quantitative metrics that signal moat health
• Qualitative warning signs of moat erosion
• A durable moat example: Microsoft
• A moat erosion cautionary tale: Intel
• When durability is in question: Starbucks
• A practical checklist for your own analysis
Okay, let’s dive in and learn more about analyzing moat durability.
What Is Moat Durability and Why Does It Matter?
Warren Buffett famously said he looks for businesses with “wide moats” protected by “unassailable” competitive advantages. But even Buffett acknowledges that moats can narrow over time. The durability of a moat, its ability to persist and protect profits over decades, remains what separates truly great investments from merely good ones.
Think of it this way: a moat’s current width tells us how protected a business is today, but its durability tells us how protected it will remain tomorrow. A company with a narrow but durable moat may actually be a better long-term investment than one with a wide moat that’s rapidly eroding.
The bottom line remains that we need a systematic approach to evaluate both the current strength AND the staying power of competitive advantages. And that’s exactly what we’ll build together today.
Quantitative Metrics for Tracking Moat Durability
I know this might sound complicated, but tracking moat durability through financial metrics is actually quite straightforward once we know what to look for. We want metrics that reveal whether a company’s competitive advantage is strengthening, stable, or deteriorating.
The Core Metrics to Track
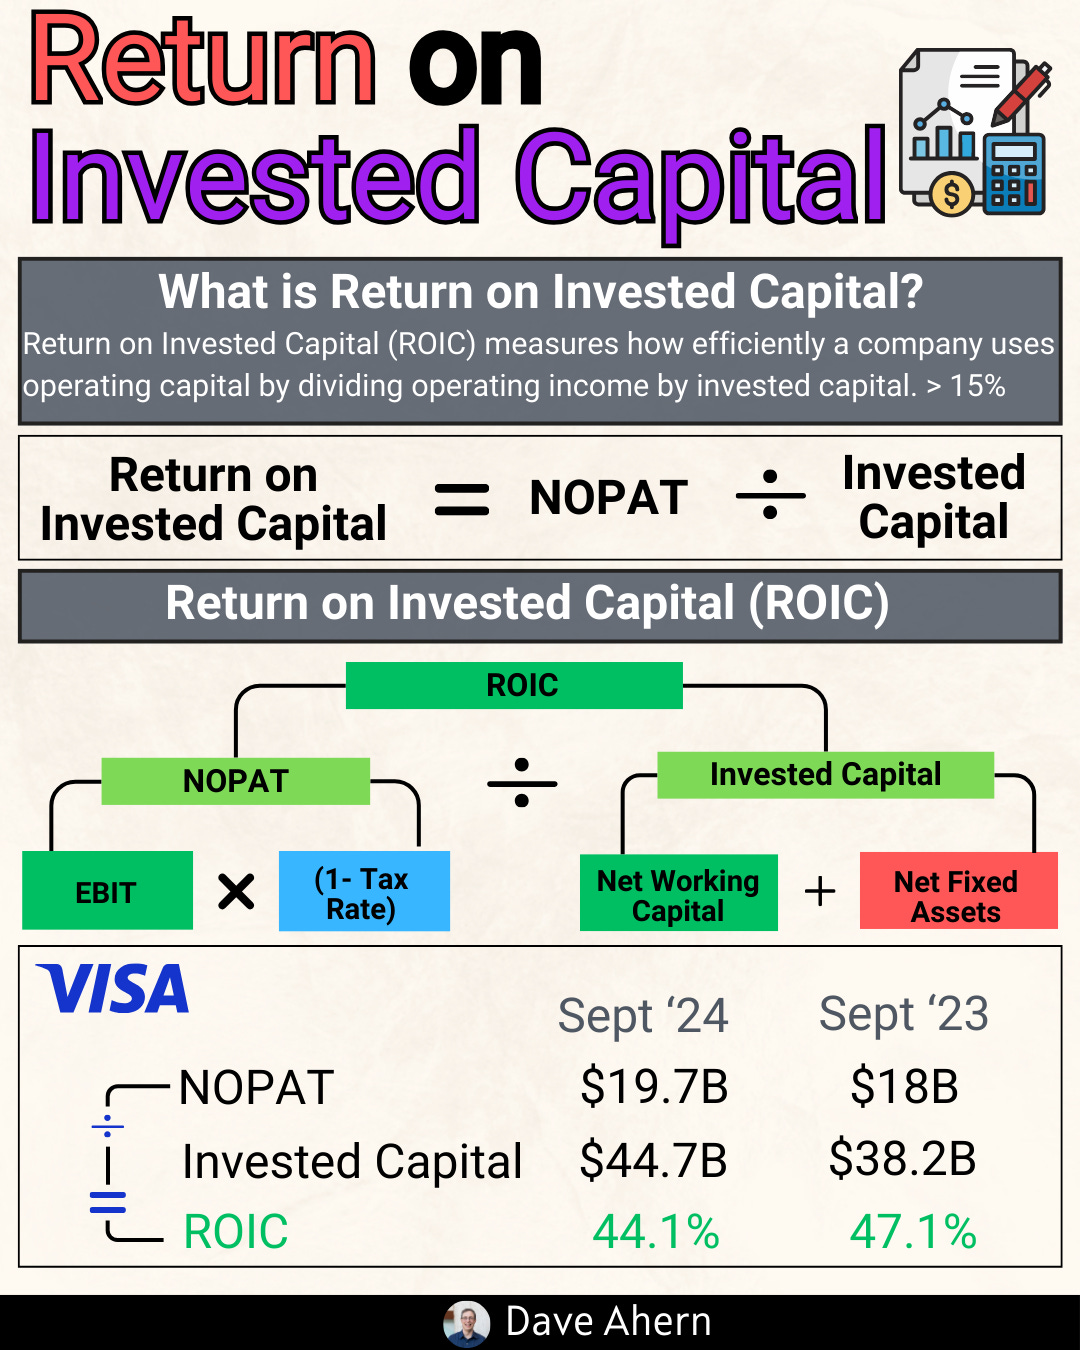
1. Return on Invested Capital (ROIC) Trends
ROIC remains the single most important metric for assessing moat durability. A company with a true economic moat should generate returns above its cost of capital consistently over time. The formula looks like this:
ROIC = Net Operating Profit After Tax (NOPAT) / Invested Capital
Where: NOPAT = Operating Income × (1 - Tax Rate), and Invested Capital = Total Equity + Total Debt - Cash
What we’re looking for:
Durable moat: ROIC consistently above 15% for 5+ years, stable or improving
Eroding moat: ROIC declining year-over-year, especially if approaching the cost of capital
Destroyed moat: ROIC falling below cost of capital (typically 8-10%)
2. Gross Margin Trajectory
Gross margins reveal pricing power, the ability to charge premium prices without losing customers. A stable or expanding gross margin suggests the moat remains intact, while compression often signals competitive pressure.
3. Operating Margin Stability
Operating margins show whether a company can maintain profitability as it scales. Declining operating margins, especially when revenue is growing, can indicate the moat is weakening.
A Durable Moat Example: Microsoft
Let’s use Microsoft as our first guinea pig to see what a durable moat looks like in the financial statements. Microsoft’s moat stems from several sources: switching costs in enterprise software, network effects in its productivity suite, and ecosystem lock-in across Windows, Office, Azure, and LinkedIn.
The Quantitative Evidence
Looking at Microsoft’s SEC filings (fiscal years ending June 30), here’s what the numbers show:
Revenue Growth (from Microsoft 10-K filings)
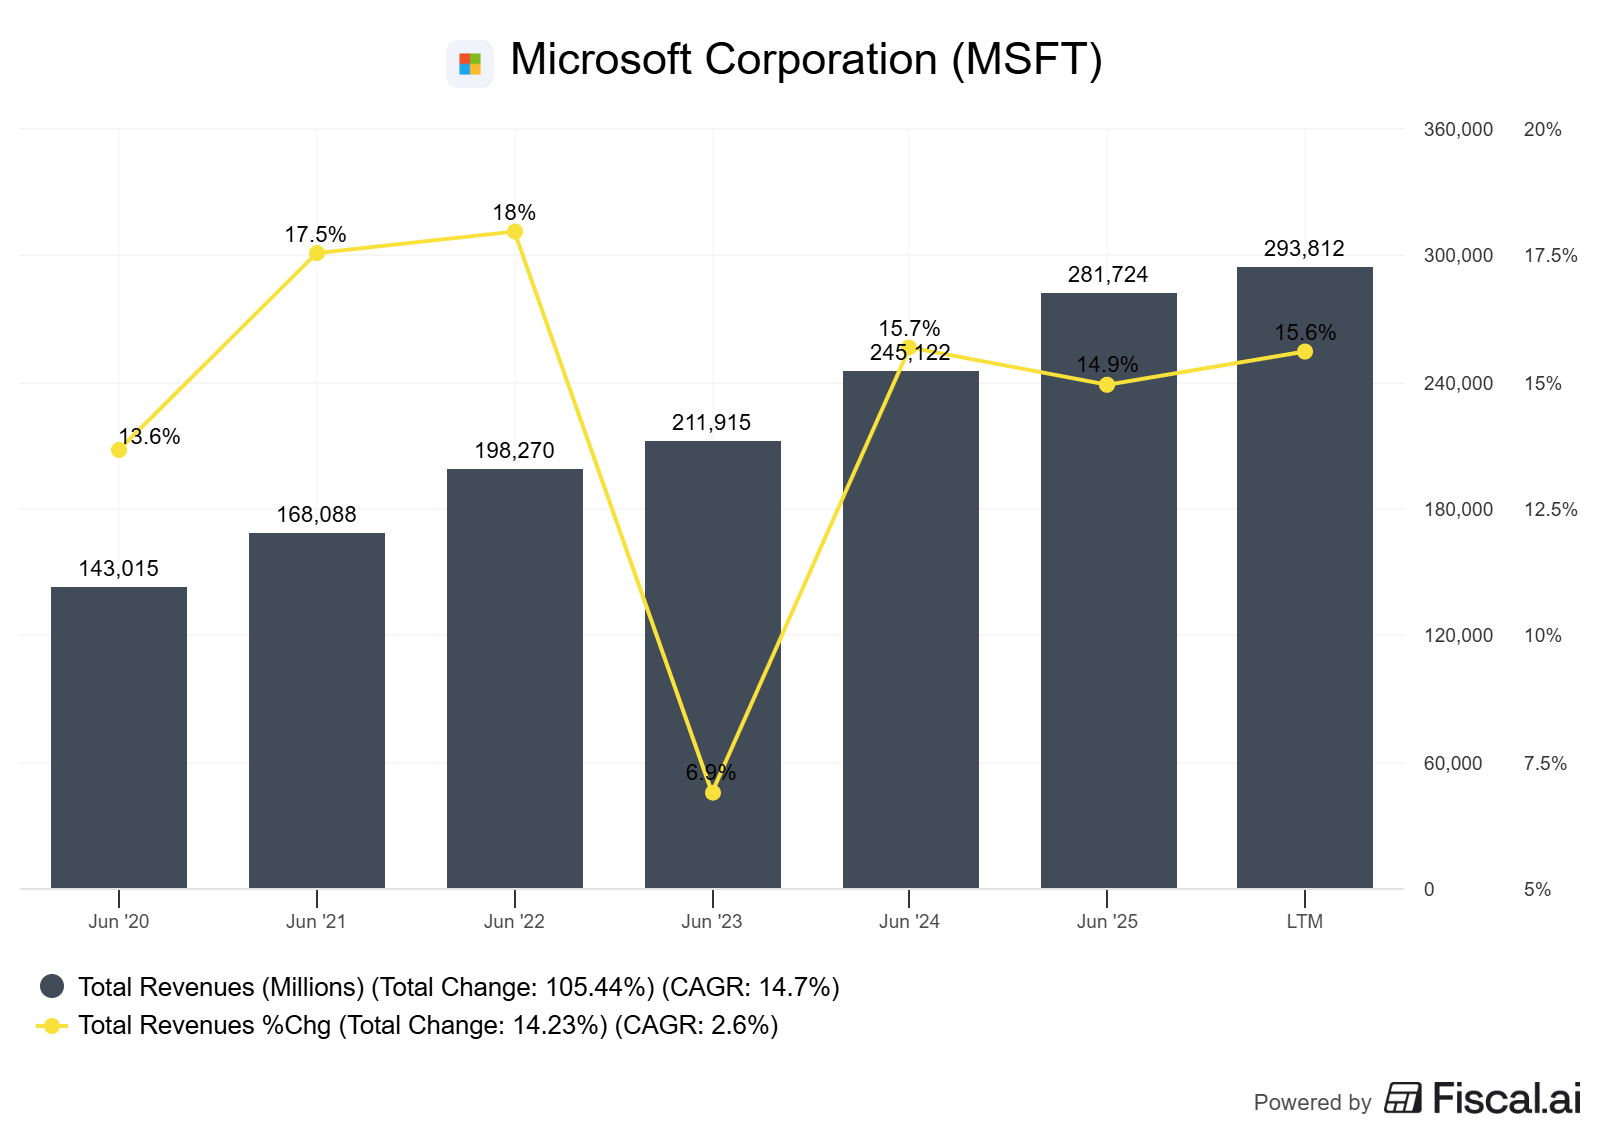
Revenue has essentially doubled over five years—a remarkable growth rate for a company of this size.
Operating Margin Trajectory
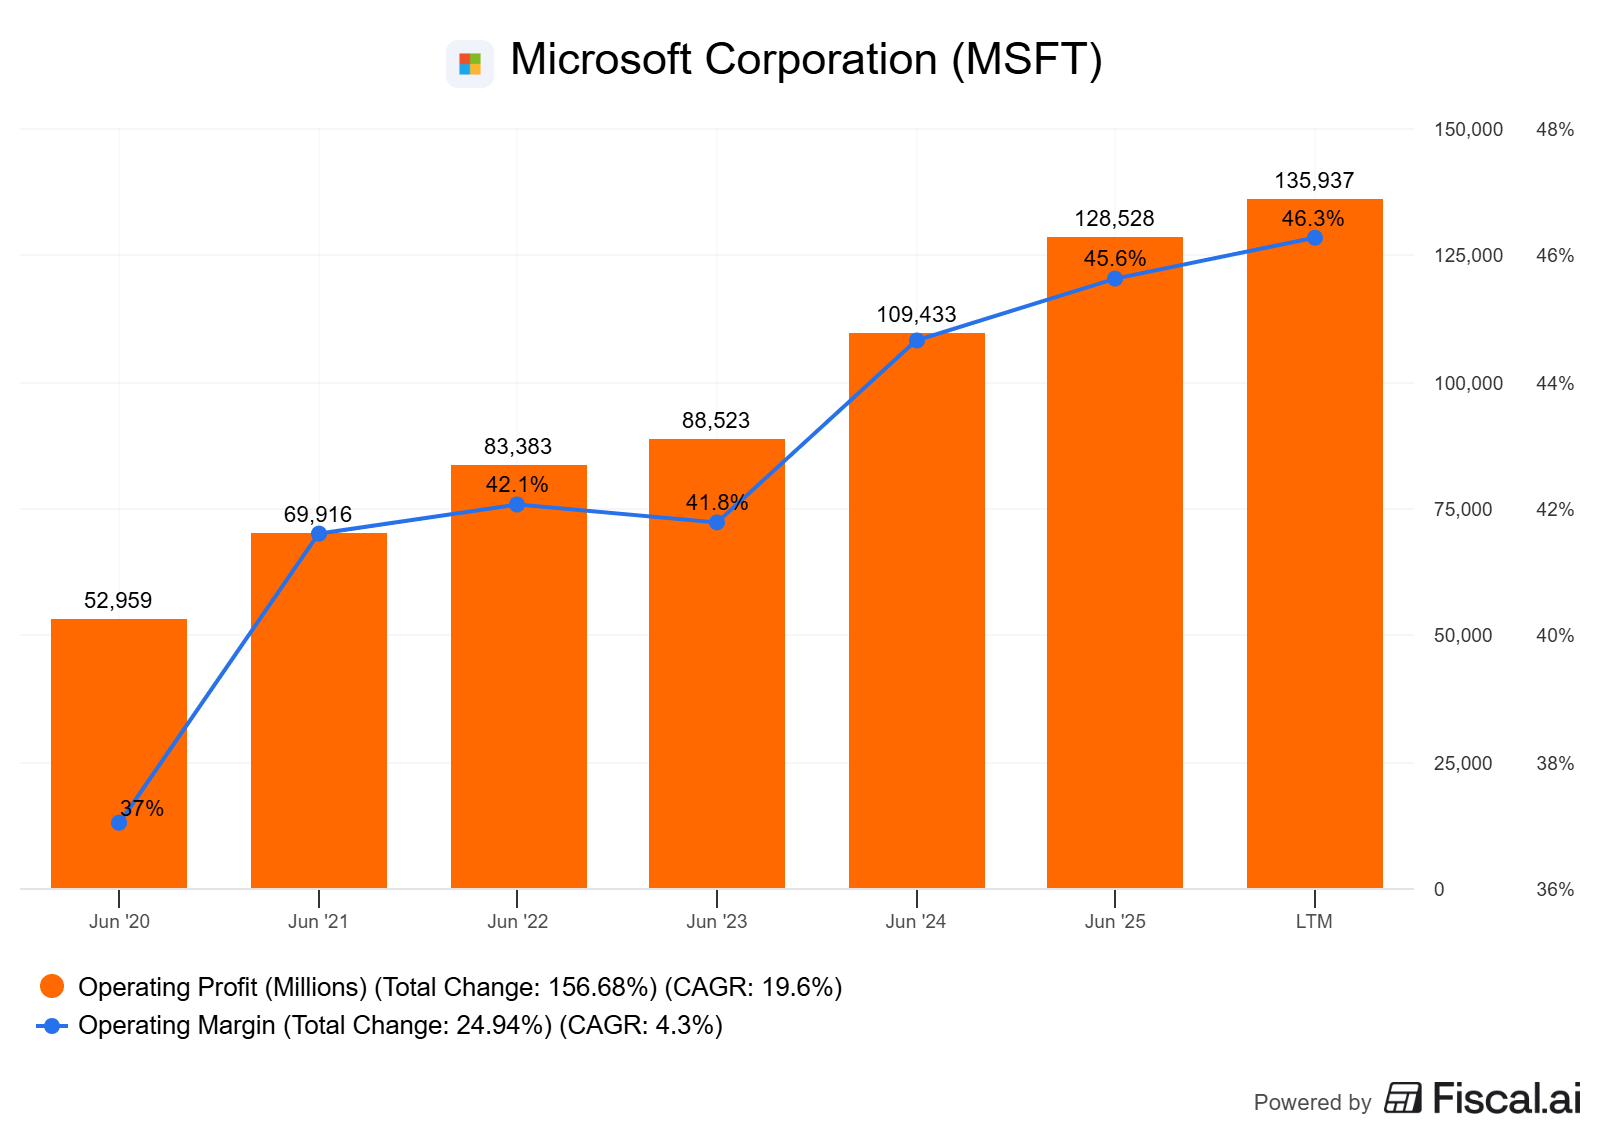
Operating margins have expanded by nearly 9 percentage points over the past five years. This remains an extraordinary accomplishment for a company growing revenue this rapidly. When a company can grow AND expand margins simultaneously, it signals a strengthening moat.
Not too hard, was it? Now let’s look at what happens when moats erode.
When Moats Erode: The Intel Cautionary Tale
Here ends the free part.
You've got the framework. Now let's see it in action with real companies. Below: complete moat durability analysis of Intel (moat erosion) and Starbucks (moat in question) using actual SEC data, see exactly how to spot the warning signs before they destroy shareholder value.
