
How to Analyze a Regulated Electric Utility: A Step-by-Step Framework Using NextEra Energy
The quiet compounders hiding in plain sight, and the checklist I use to find them.

Regulated electric utilities are the stocks most investors either ignore or buy blindly for the yield. Both approaches leave money on the table.
The truth is that utilities are among the few corners of the stock market where a company literally negotiates its profits with the government, then earns them year after year on a growing base of approved infrastructure. Once you understand the machinery underneath, analyzing them becomes surprisingly systematic.
In today’s post, we will use NextEra Energy (NEE) and its regulated subsidiary, Florida Power & Light (FPL), as our working example to walk through a complete, repeatable framework you can apply to any utility on your watchlist. By the end, you will have a checklist covering seven steps and eight key metrics.
Here is what we will cover:
The Regulated Utility Business Model (in Plain English)
Why the Regulator Is the Real Moat
The Seven-Step Analysis Framework
The Eight Metrics That Matter Most
Applying the Framework to NextEra Energy
Common Mistakes Utility Investors Make
The Investor Takeaway
Let’s dive in.
The Regulated Utility Business Model in Plain English
Before we get to the metrics, you need to understand how a regulated electric utility actually earns its keep. The model is different from almost every other industry.
A regulated utility strikes a bargain with the state in which it operates. The company agrees to serve every customer in its territory safely, reliably, and at reasonable rates. In exchange, the state grants it a monopoly and lets it earn a specific, approved return on the capital it invests in infrastructure.
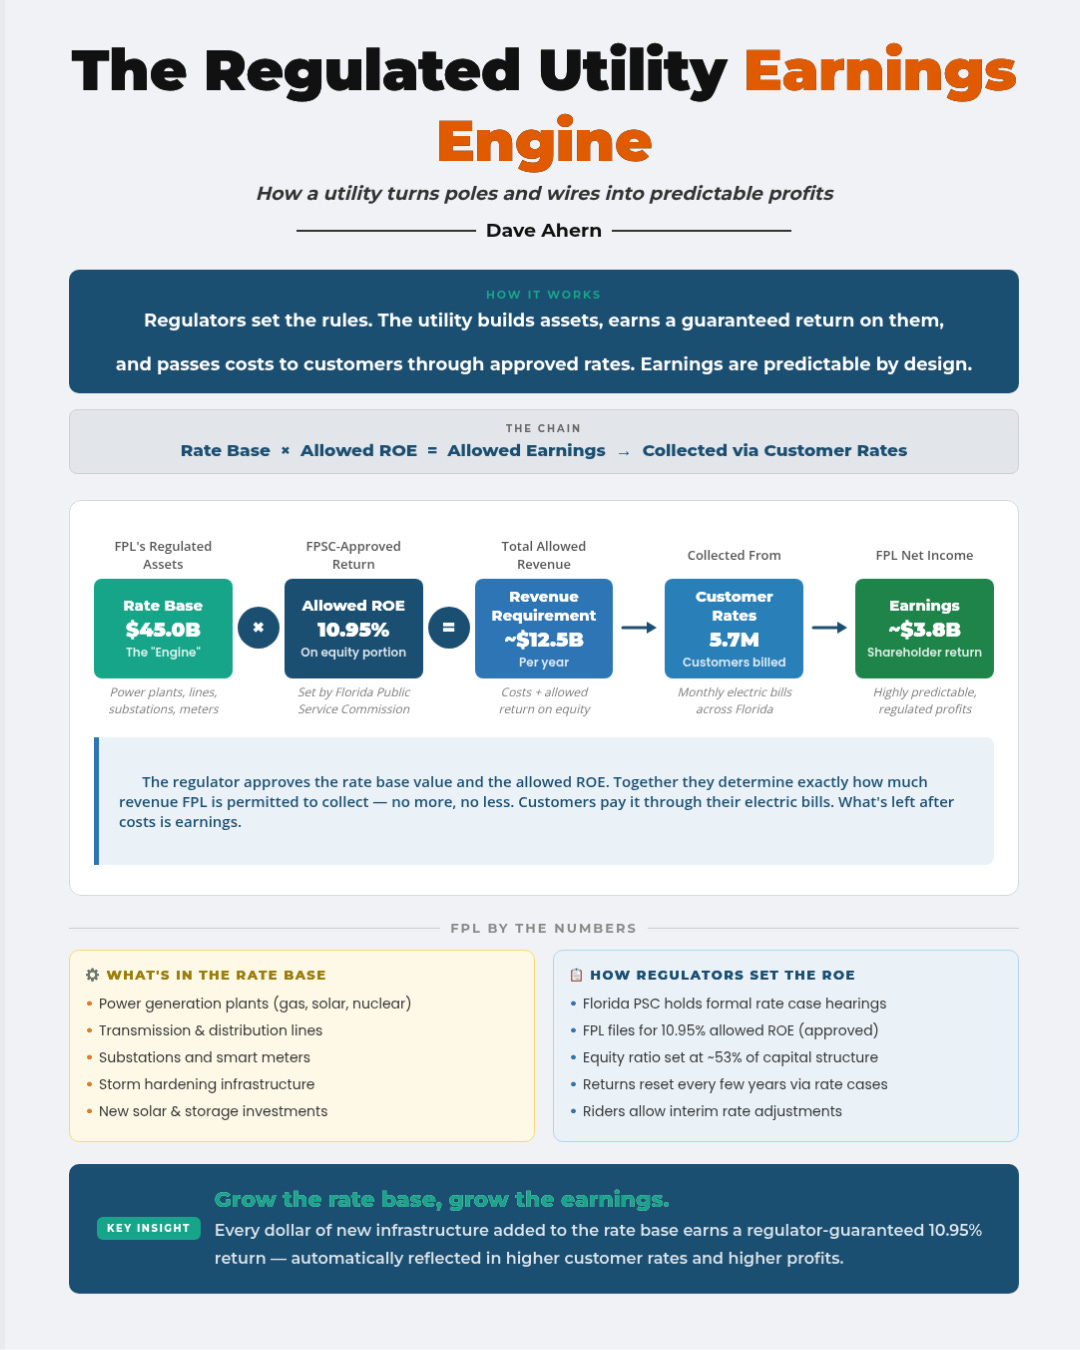
That approved return is the engine of the whole business. Three concepts make it work.
Rate base is the total value of the utility’s invested assets (power plants, transmission lines, substations, poles, wires, smart meters) minus accumulated depreciation. It represents the capital the utility has deployed to serve its customers.
Allowed return on equity (ROE) is the percentage return the state’s public utility commission permits the utility to earn on the equity portion of its rate base. This gets set in a formal proceeding called a rate case. In recent years, authorized ROEs for electric utilities have clustered in the 9.5% to 10% range nationally, though they vary by state.
Revenue requirement is what the utility is allowed to collect from customers, calculated roughly as:
Revenue Requirement = (Rate Base × Allowed Rate of Return) + Operating Expenses
Customer rates are then set to generate that revenue requirement.
Here is the key insight for investors. A regulated utility grows its earnings in one primary way: by growing its rate base. Every dollar of approved capital investment earns a regulated return year after year. That is why utility executives obsess over their five-year capital plans, and why you should read them carefully.
NextEra’s regulated arm, FPL, is the largest electric utility in the United States, serving approximately 6 million customer accounts (about 12 million Floridians). According to NextEra’s 2024 10-K and company disclosures, FPL’s regulatory capital employed grew roughly 8.1% in 2024, and FPL invested approximately $8.2 billion in capital that year. That capital investment is the fuel. The allowed ROE is the multiplier. Together, they determine how much FPL earns.
Why the Regulator Is the Real Moat
You can find a utility with a beautiful balance sheet, a growing rate base, and a reasonable dividend, and still lose money if you ignore the regulator.
The state commission sets the allowed ROE, approves the capital structure, decides how quickly the utility can recover invested capital, and rules on which projects get approved. Two utilities with identical operations can produce very different shareholder returns based purely on whether they operate in a constructive or hostile regulatory environment.
When I evaluate a utility’s regulatory setup, I focus on five things.
Allowed ROE relative to national averages. Is the utility earning close to or above the industry median? If a utility operates in a state with a 9.15% allowed ROE and its peers sit at 10.2%, that is a structural headwind. FPL operates in Florida, which is widely considered one of the most constructive regulatory jurisdictions in the country. In November 2025, the Florida Public Service Commission approved a four-year rate settlement allowing FPL a 10.95% target return on equity, materially above the national average of roughly 9.56%.
Regulatory lag. This is the time between when a utility spends capital and when it starts earning a return on that spending. Short lag is good. Long lag erodes returns. Florida uses forward-looking test years for FPL’s rate cases, which reduces lag by letting FPL set rates based on projected future costs rather than historical ones.
Cost recovery mechanisms. Riders and trackers allow utilities to recover specific costs (fuel, storm damage, infrastructure upgrades) between full-rate cases. More mechanisms mean less risk. FPL’s Solar Base Rate Adjustment (SoBRA) mechanism, for example, allows FPL to earn a return on approved new solar generation as it comes online, without waiting for the next full rate case. The 2025 settlement also preserves SoBRA recovery through 2028 and 2029.
Multi-year rate certainty. Multi-year agreements provide a runway of predictable earnings. FPL’s settlement locks in the rate structure through the end of 2029, giving NextEra investors visibility that utilities in less constructive states simply do not have.
Political climate. Is the commission appointed or elected? Are affordability concerns driving aggressive rate pushback? The 2025 FPL case shows how this plays out in real time. FPL originally requested an 11.9% ROE. After pushback from AARP Florida and other consumer groups, and mediation with ten stakeholder organizations, FPL settled for 10.95%. That is a meaningful cut from the request, but it remains comfortably above the national average and supportive of the company’s capital plan.
Regulatory Research Associates publishes rankings of state regulatory environments, and S&P Global, Fitch, and Moody’s all assess regulatory quality in their credit reports. Read them before you buy.
Red Flags in Regulation
Be cautious when you see disallowed capital costs in recent rate cases, repeated authorized ROE reductions, lengthy rate case timelines, or public fights between the utility and its commission. Any of these can quietly compound into years of subpar returns.
This is where most utility analysis stops. It's where ours starts.
Every week, School of Investing subscribers get a new framework like this one — the kind of analytical process that turns you from someone who follows stock picks into someone who evaluates companies independently.
Paid members get the Dividend Safety Spreadsheet, the full calculator suite (ROIC, WACC, dividend safety), the complete infographic library, and a new framework in your inbox every week. All grounded in SEC filings, all built to be used.
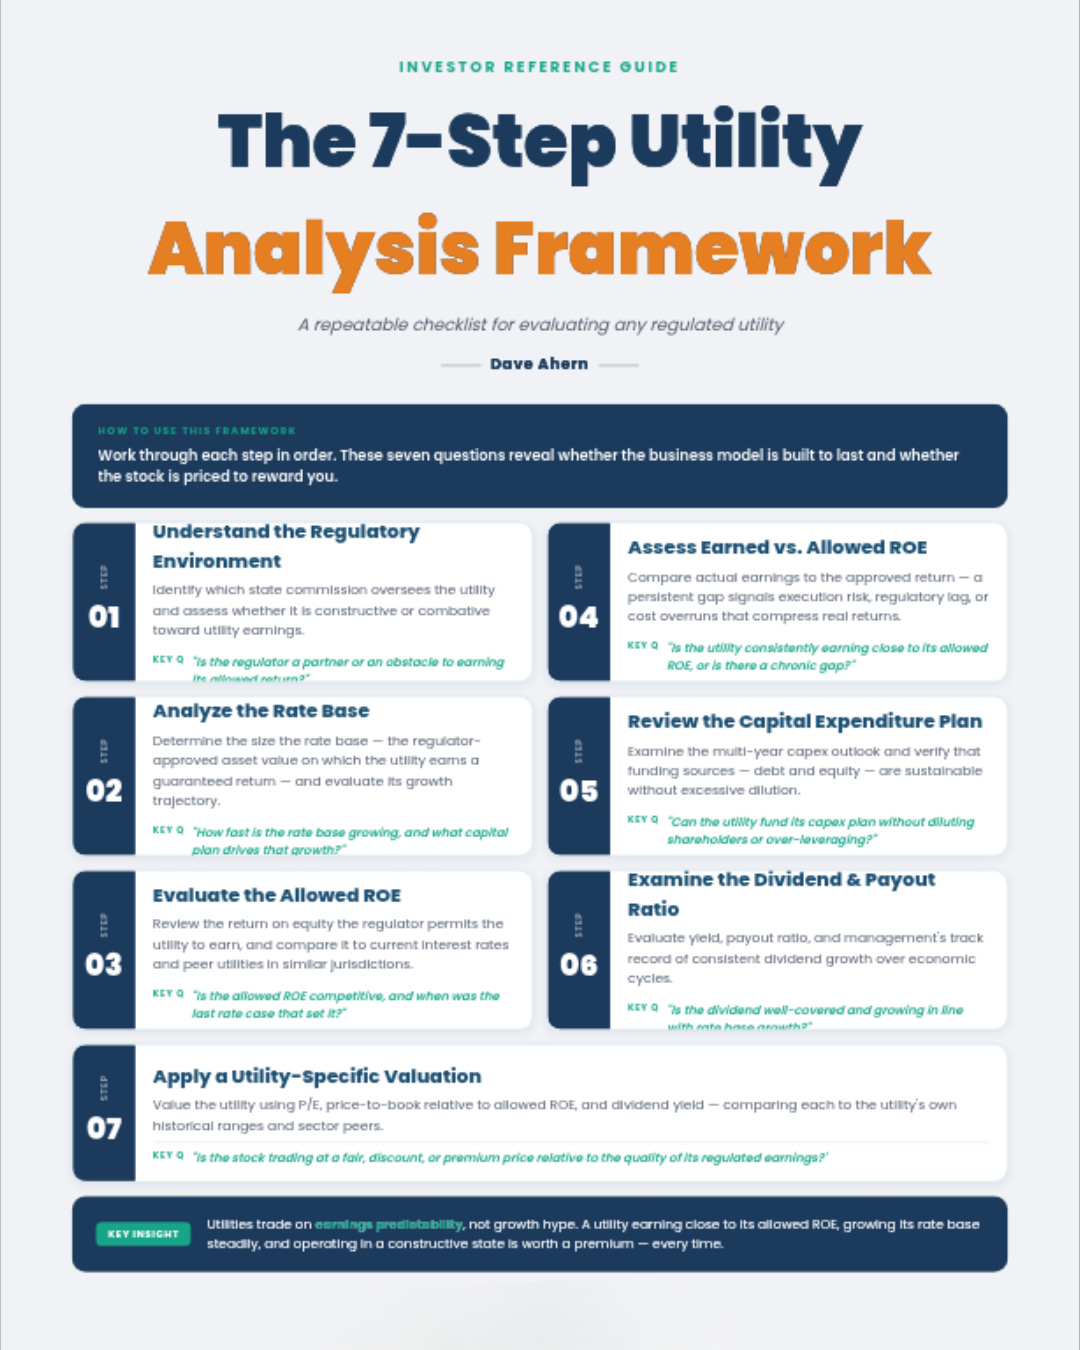
The Seven-Step Analysis Framework
Put the pieces together, and here is the repeatable workflow I use for any regulated electric utility. I will apply each step to NextEra Energy as we go.
Step 1: Understand the Footprint
Start with the basics. What states does the utility operate in? How many customers? What is the mix of residential, commercial, and industrial load? Is demand growing or flat?
NextEra has two primary businesses. Florida Power & Light (FPL) is the regulated utility serving approximately 12 million Floridians across one of the fastest-growing states in the country. NextEra Energy Resources (NEER) is a competitive, unregulated renewables and storage business that operates approximately 43 gigawatts of generation capacity across the U.S. and Canada. For utility investors, FPL is the rate-base compounder. NEER is the growth accelerator, but it does not have the same regulatory protections.
This dual structure matters because the two businesses have different risk profiles. If you are analyzing a pure-play regulated utility, you will focus entirely on the regulated footprint.
Step 2: Evaluate the Regulatory Jurisdictions
Pull the most recent rate case decisions. Note the allowed ROE, the authorized equity ratio, the test year type, and any disallowances. Check third-party rankings of regulatory quality.
For FPL, the November 2025 settlement produced these terms:
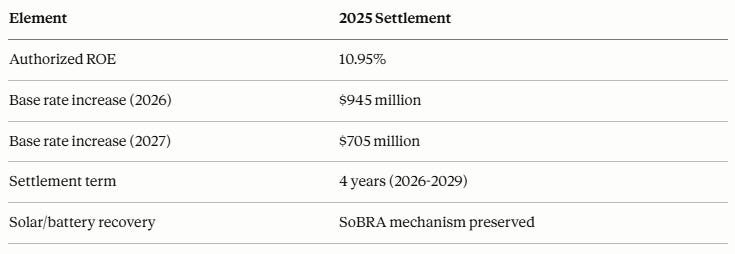
This is a constructive outcome. The allowed ROE sits well above the national average, the multi-year structure provides visibility, and the SoBRA mechanism protects ongoing investment in the new generation.
Step 3: Review the Capital Plan
Read the most recent investor presentation. Note the multi-year capex number, the rate base growth guidance, and the EPS growth guidance. Ask whether the capex is weighted toward constructive jurisdictions and toward lower-risk transmission and distribution rather than higher-risk generation.
NextEra’s investor disclosures indicate that FPL is investing roughly $8 billion to $9 billion annually in capital, with the company expecting regulated capital in electric and gas transmission to grow at more than 20% CAGR through 2032. FPL is also in advanced discussions for approximately 9 gigawatts of large-load development (think data centers and industrial customers).
This is the kind of capital plan you want to see: large, credible, weighted toward a constructive jurisdiction, and tied to measurable demand growth.
Step 4: Run the Eight Metrics
We will cover these in detail in the next section. For now, the point is that you systematically check each one and flag anything outside healthy ranges.
Step 5: Stress-Test the Dividend
Look at the dividend growth streak, the payout ratio on earnings, and the credit rating. Ask the hard question: if the next rate case came in 50 basis points below the current allowed ROE, would the dividend still be safe?
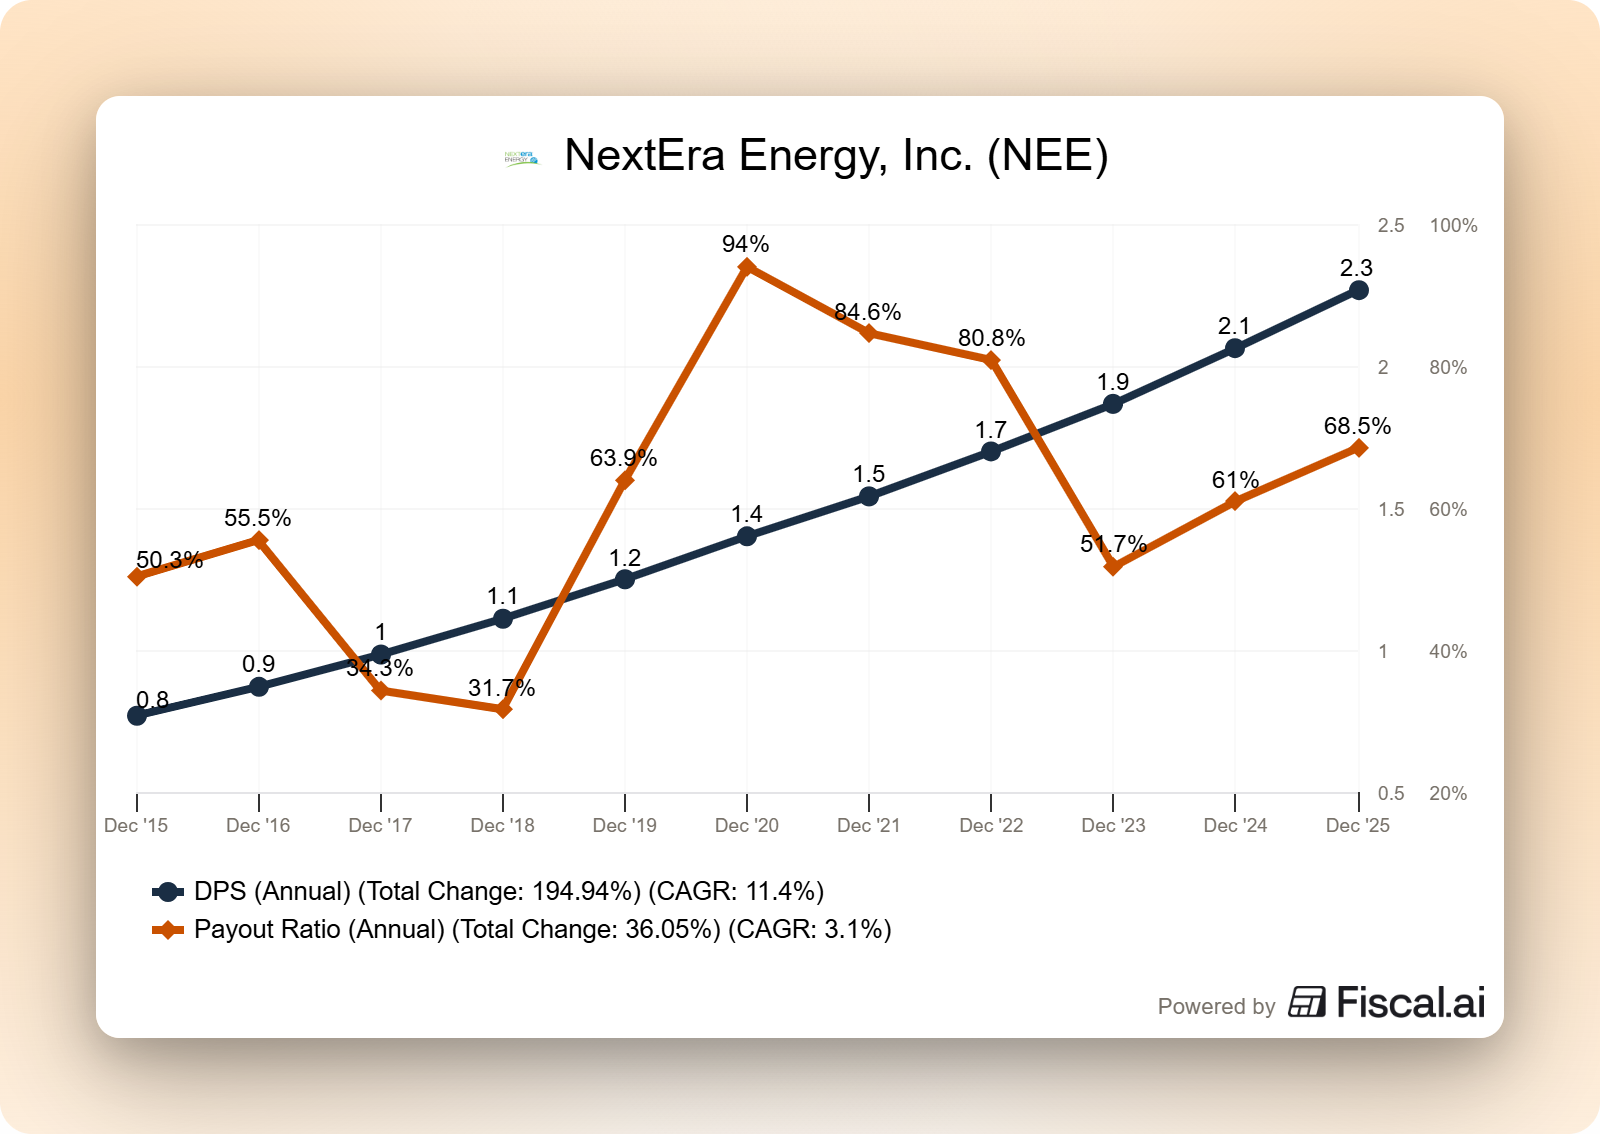
NextEra has increased its dividend for more than 30 consecutive years and grown it at roughly a 10% annualized rate over the past decade. Management has guided to continued approximately 10% dividend growth through 2026 (off a 2024 base), then roughly 6% annual growth for 2027 and 2028 (off a 2026 base). The streak and the forward guidance both suggest that the dividend is well supported.
Step 6: Compare to Peers
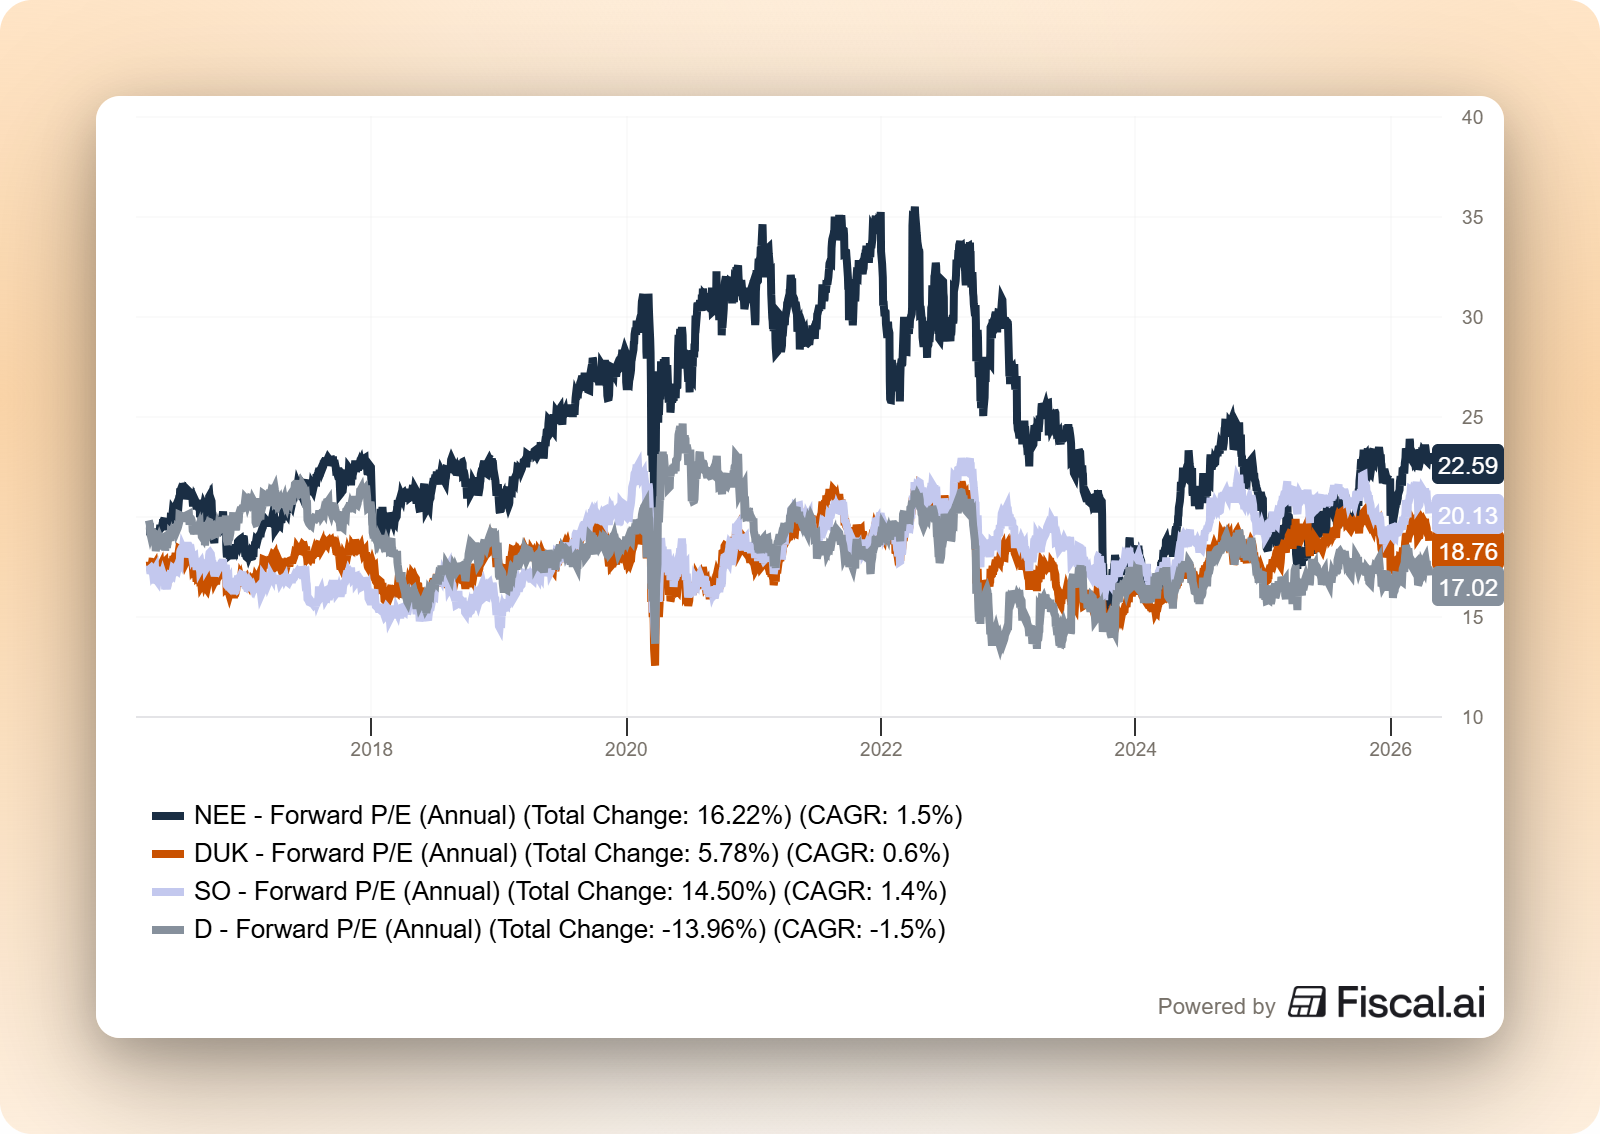
A utility never exists in isolation. Benchmark your target against three or four comparable utilities on valuation (forward P/E), rate base growth rate, dividend yield, and regulatory quality. A higher multiple is justifiable only if the growth or regulatory quality justifies it.
Step 7: Value the Stock
Regulated utilities trade on a narrow band of forward P/E, usually 15x to 20x, depending on growth and quality. Dividend discount models and peer multiples are both reasonable tools. You can also check the dividend yield relative to the stock’s historical range, though yield alone should never be your sole valuation tool.
A high dividend yield can signal a bargain or a warning that the market expects a dividend cut. Context matters.
The Eight Metrics That Matter Most
These are the numbers I track for every utility. I have organized them by what they tell you, and pulled NextEra’s readings for each where disclosed.
Growth Metrics
1. Rate base growth rate. Arguably, the single most important number. Look for the historical five-year growth rate and management’s forward guidance in investor presentations. Healthy, well-positioned utilities are currently guiding to 6%-9% annual rate base growth. FPL’s regulatory capital grew 8.1% in 2024.
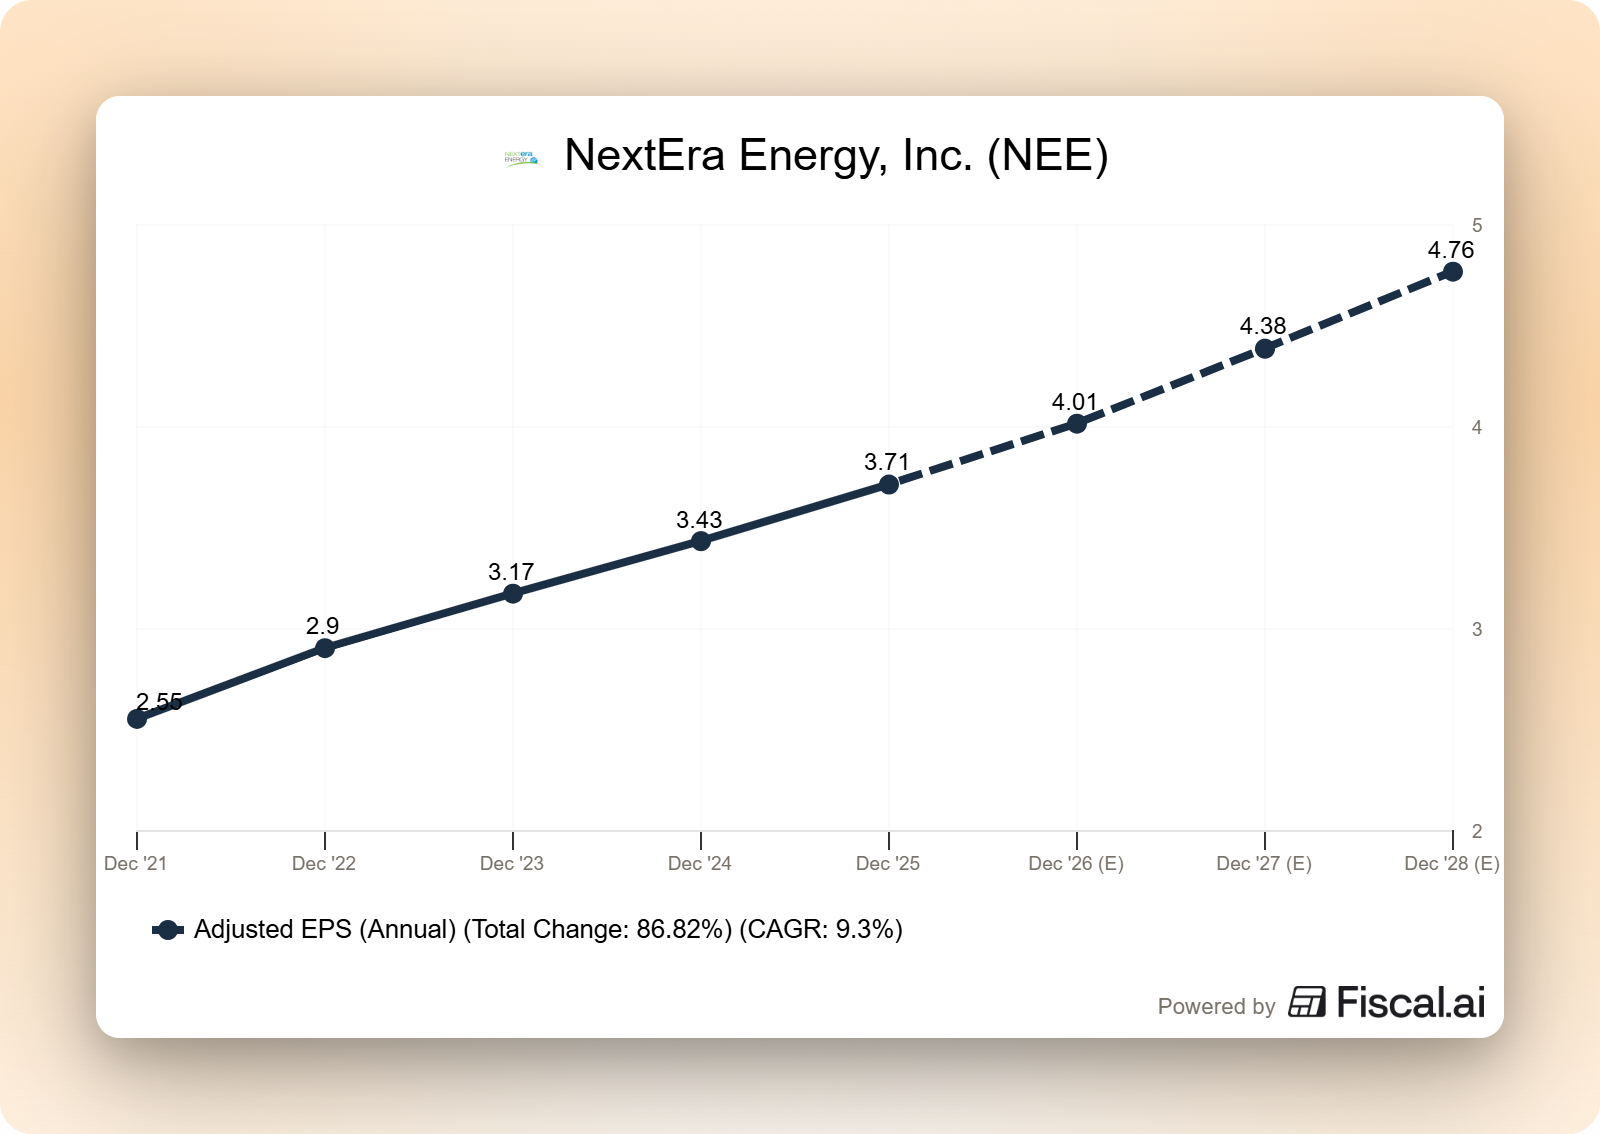
2. EPS growth guidance. Most large utilities provide multi-year adjusted EPS growth targets. NextEra expects at least 8% compound annual adjusted EPS growth through 2032, based on its expected 2025 range of $3.62 to $3.70 per share. The company delivered $3.71 in adjusted EPS in 2025, at the top end of the range.
3. Capital expenditure plan. NextEra’s disclosures indicate FPL is investing approximately $8 billion to $9 billion annually in capital, with regulated transmission capital growing at a more than 20% CAGR through 2032.
Profitability Metrics
4. Earned ROE vs. allowed ROE. The allowed ROE tells you what regulators permit. The earned ROE tells you what the utility actually delivered. A utility consistently earning close to its allowed ROE is well-managed and operating in a supportive environment. A utility earning 100+ basis points below its allowed ROE is underperforming, and you should investigate why. FPL has historically earned close to the top of its allowed range, a testament to cost discipline and Florida’s constructive environment.
Dividend Safety Metrics
5. Dividend payout ratio (earnings basis). Utilities run negative free cash flow during heavy investment cycles because they are constantly spending on new infrastructure. FCF payout ratios often exceed 100%, which is normal for the sector but meaningless for dividend safety analysis. Focus instead on the dividend-to-earnings payout ratio. Healthy utilities sit in the 55% to 70% range. NextEra’s annual dividend of approximately $2.49 per share, relative to 2025 adjusted EPS of $3.71, yields a payout ratio of roughly 67%, right in the healthy zone.
6. Funds from operations (FFO) to debt. Credit rating agencies watch this metric closely. It measures how much cash flow is available to service debt obligations. S&P typically requires FFO/debt above 18% to maintain NextEra’s current A- rating. Moody’s and Fitch have similar thresholds. NextEra’s 2024 FFO/debt came in at approximately 18.7%, just above the S&P downgrade threshold and consistent with maintaining its investment-grade rating. This is a metric to watch closely.
Balance Sheet Metric
7. Debt-to-capitalization ratio. Most regulated utilities target 50%-55% debt as a percentage of total capital. This is not high leverage for a utility (regulators actually approve capital structures with specific debt and equity weightings, and the utility earns its allowed return on the equity portion). FPL’s settlement maintains an equity ratio of approximately 59.6%, meaning roughly 40% debt, which is conservative by utility standards.
Dividend Track Record
8. Consecutive years of dividend increases. A long streak is not a guarantee of future increases, but it does indicate how management views the dividend. NextEra has increased its dividend for more than 30 consecutive years, and management has publicly committed to continued increases through 2028.
Applying the Framework to NextEra Energy
Let me bring all seven steps together in a single walkthrough of NextEra.
Footprint. FPL serves about 12 million Floridians in a fast-growing state with rising electricity demand. NEER adds a nationwide renewables-and-storage business with a growing backlog. The mix is roughly weighted toward the regulated business for earnings stability, with NEER providing growth optionality.
Regulatory jurisdictions. Florida is one of the most constructive regulatory environments in the U.S. The 2025 settlement produced a 10.95% allowed ROE, a four-year agreement through 2029, and preserved SoBRA recovery.
Capital plan. FPL is investing roughly $8 billion to $9 billion annually, with regulated transmission capital guided to grow more than 20% CAGR through 2032. NEER’s renewables backlog sits above 22 gigawatts.
The eight metrics. Rate base growth of 8.1% in 2024 (healthy), adjusted EPS growth guidance of at least 8% annually through 2032 (strong), earned ROE historically close to allowed (well-managed), earnings-basis payout ratio of roughly 67% (healthy), FFO/debt of approximately 18.7% (above the S&P threshold, but worth monitoring), equity ratio of 59.6% (conservative), and a dividend streak of over 30 years (industry-leading).
Dividend stress test. If FPL’s next rate case ten years from now produced a 9.95% allowed ROE instead of 10.95%, would the dividend still be safe? Given the company’s payout ratio, capital plan, and debt capacity, almost certainly yes, though EPS growth would slow.
Peer comparison. NextEra typically trades at a premium to the utility sector because of its combination of a high-quality regulated utility and a fast-growing renewables business. That premium is justifiable only if the EPS growth rate continues to exceed the peer average, which currently it does.
Valuation. At roughly $92 per share and trailing adjusted EPS of $3.71, NextEra trades at approximately 24.8x trailing earnings, a premium to the utility sector’s typical 15x to 20x range. On the 2026 adjusted EPS guidance of $3.92 to $4.02, the forward P/E falls closer to 23x. You are paying a premium price, and the premium is the question an investor has to answer.
The Setup for 2026
A few industry tailwinds and headwinds are worth knowing before you start analyzing individual names.
On the tailwind side, U.S. electricity demand is accelerating after two decades of flat growth. Data center load, AI infrastructure, factory reshoring, and electric vehicle adoption are all driving up demand. NextEra’s own forecasts call for U.S. power demand to grow approximately 38% over the coming decades. Utilities with clear capital plans to support that growth, particularly in transmission, are well-positioned.
On the headwind side, rising customer bills are creating political pressure (the AARP Florida pushback on FPL’s original 11.9% ROE request is a clear example). Extreme weather is increasing storm-related costs. Higher interest rates have raised the cost of the debt utilities depend on. And federal policy shifts on clean energy are creating new execution risks for renewable developers.
Neither side cancels the other. The opportunity is in finding utilities with strong rate base growth, constructive regulators, healthy balance sheets, and a customer base that can absorb rate increases without political backlash.
Common Mistakes Utility Investors Make
A few pitfalls I see regularly.
Chasing yield. A utility yielding 7% when its peers yield 3.5% is not a bargain. It is usually a signal that the market expects trouble, whether a dividend cut, regulatory disallowance, or balance sheet strain. Check why the yield is high before you trust it.
Ignoring the regulator. Two utilities with identical financials can produce very different returns based on the commission they answer to. Skip this step, and you are gambling.
Using the FCF payout ratio instead of the earnings payout ratio. Utilities run negative FCF during heavy investment cycles. The FCF payout ratio will look terrifying and tell you nothing. Use the earnings-basis payout ratio.
Treating all utilities the same. A pure-play regulated utility and a hybrid like NextEra (with a large competitive renewables arm) have different risk profiles. Know which one you are buying.
Assuming the dividend is safe just because it has a long streak. A 30-year streak is a strong signal, but it does not override a deteriorating balance sheet or a hostile regulator. Check the fundamentals every year.
The Investor Takeaway
Regulated electric utilities reward investors who understand three things: the business model is built on rate base growth, the regulator is the moat, and the dividend is only as safe as the balance sheet behind it.
Start with the regulator. Follow with the capital plan. Verify with the eight metrics. If all three line up, you have likely found a utility worth owning.
NextEra Energy shows what happens when the combination works. A constructive regulator (Florida), a large and growing rate base (FPL), a disciplined balance sheet (18.7% FFO/debt), and a 30-year dividend streak produce the kind of compounding that builds wealth quietly over decades. The trade-off is a premium valuation, which is the question every NextEra investor has to answer for themselves.
The sector will never be exciting. That is the feature, not the bug.
That is going to wrap up our discussion for today.
As always, thank you for taking the time to read this post, and I hope you find something of value on your investing journey.
If I can further assist, please don’t hesitate to reach out.
Until next time, take care and be safe out there,
Dave
You just analyzed your first utility. Keep building.
The investors who compound wealth over decades don’t rely on other people’s stock picks. They build their own analytical process, one framework at a time.
School of Investing is built around that idea. Paid subscribers get:
A new analytical framework every week, grounded in SEC filings
The Dividend Safety Spreadsheet that flags at-risk payers automatically
The complete calculator suite: ROIC, WACC, dividend safety, reverse DCF
The full infographic library, downloadable and shareable
You don’t need someone else to tell you what to buy. You need the tools to decide for yourself. I’d love to help you build them.
The rate base growth mechanic is the part most investors skip because it looks boring until you realise its the only business model in public markets where the government contractually guarantees your return on invested capital. Every other company has to discover its margins through competition. Utilities negotiate theirs in advance.
What makes this framework especially well-timed is the AI data centre buildout. Every hyperscaler needs gigawatts of new capacity and the fastest path to it runs through regulated utilities with constructive commissions and room on the grid. FPL sitting in Florida with a 10.95% allowed ROE and a forward-looking test year structure means NextEra can deploy capital into data centre interconnection, earn the approved return almost immediately, and lock it in for years.
The irony is that the most exciting growth story in energy right now is a business model designed in the 1930s to be deliberately unexciting.