
How Profit Margins Work and Why We Should Care

When you evaluate a company’s profitability, you’re really asking four related questions: how efficiently it produces what it sells, how well it runs the business, how much it keeps after everything, and how much cash drops out.
Those map to gross margin, operating margin, net margin, and free cash flow (FCF) margin.
Each tells a different part of the story, and together they help you separate durable profitability from temporary noise.
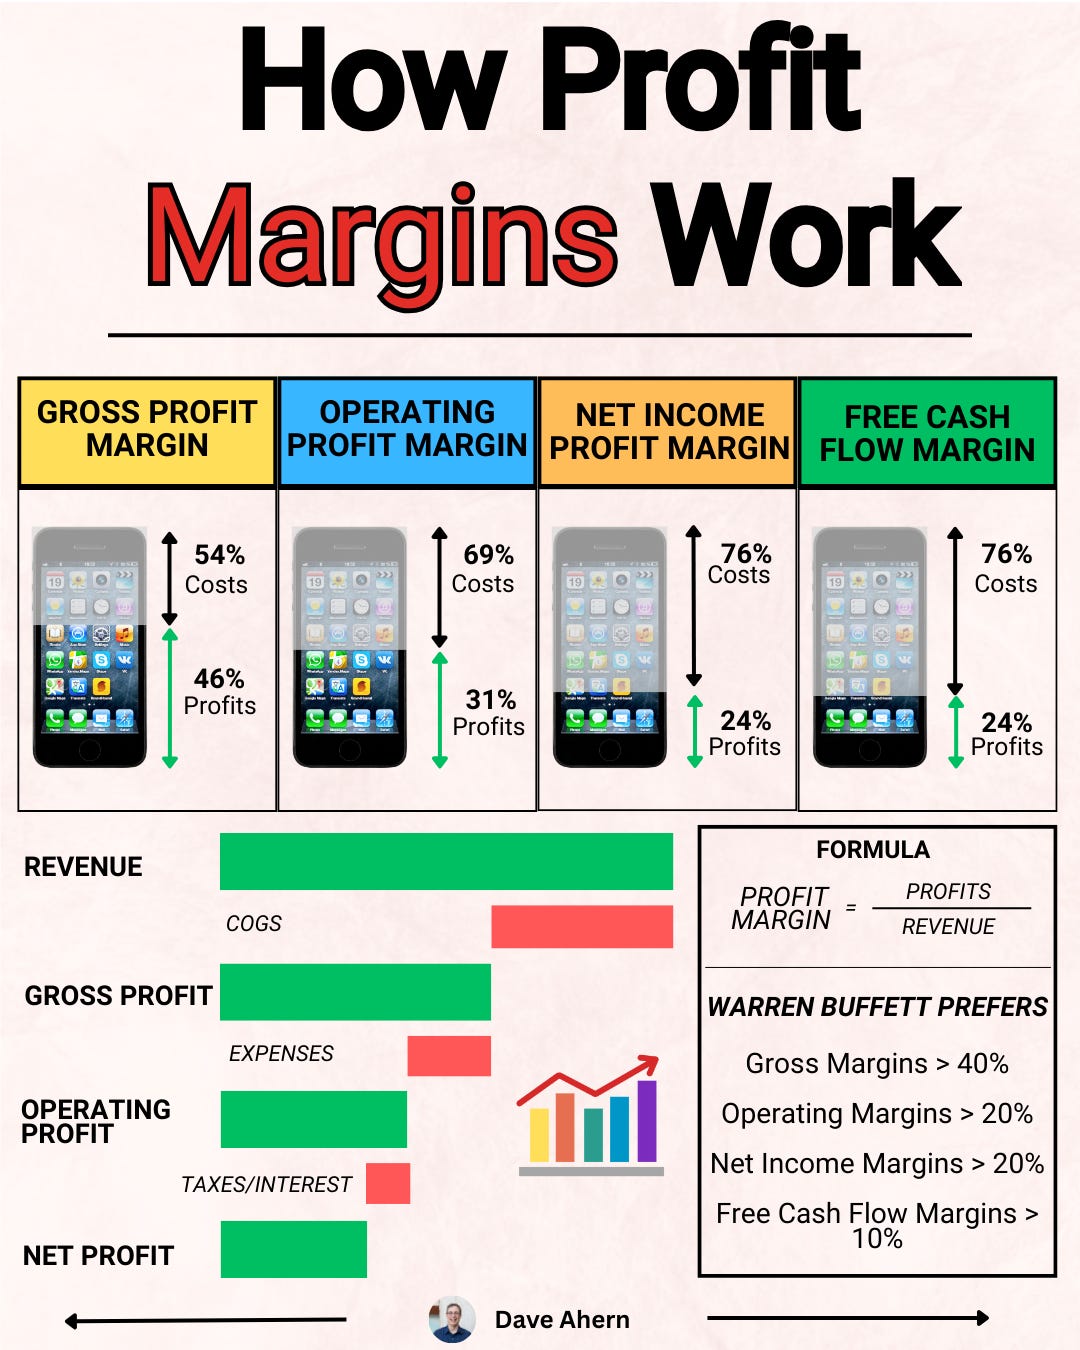
Gross profit margin
Gross margin shows how much profit is left after covering the direct costs to deliver the product or service (COGS).
Gross Profit Margin = Revenue −COGS × 100%
For software and cybersecurity platforms, COGS is mostly cloud hosting, support, and third‑party data costs, not factories or raw materials. High and steady gross margins often indicate strong pricing power and scalable delivery.
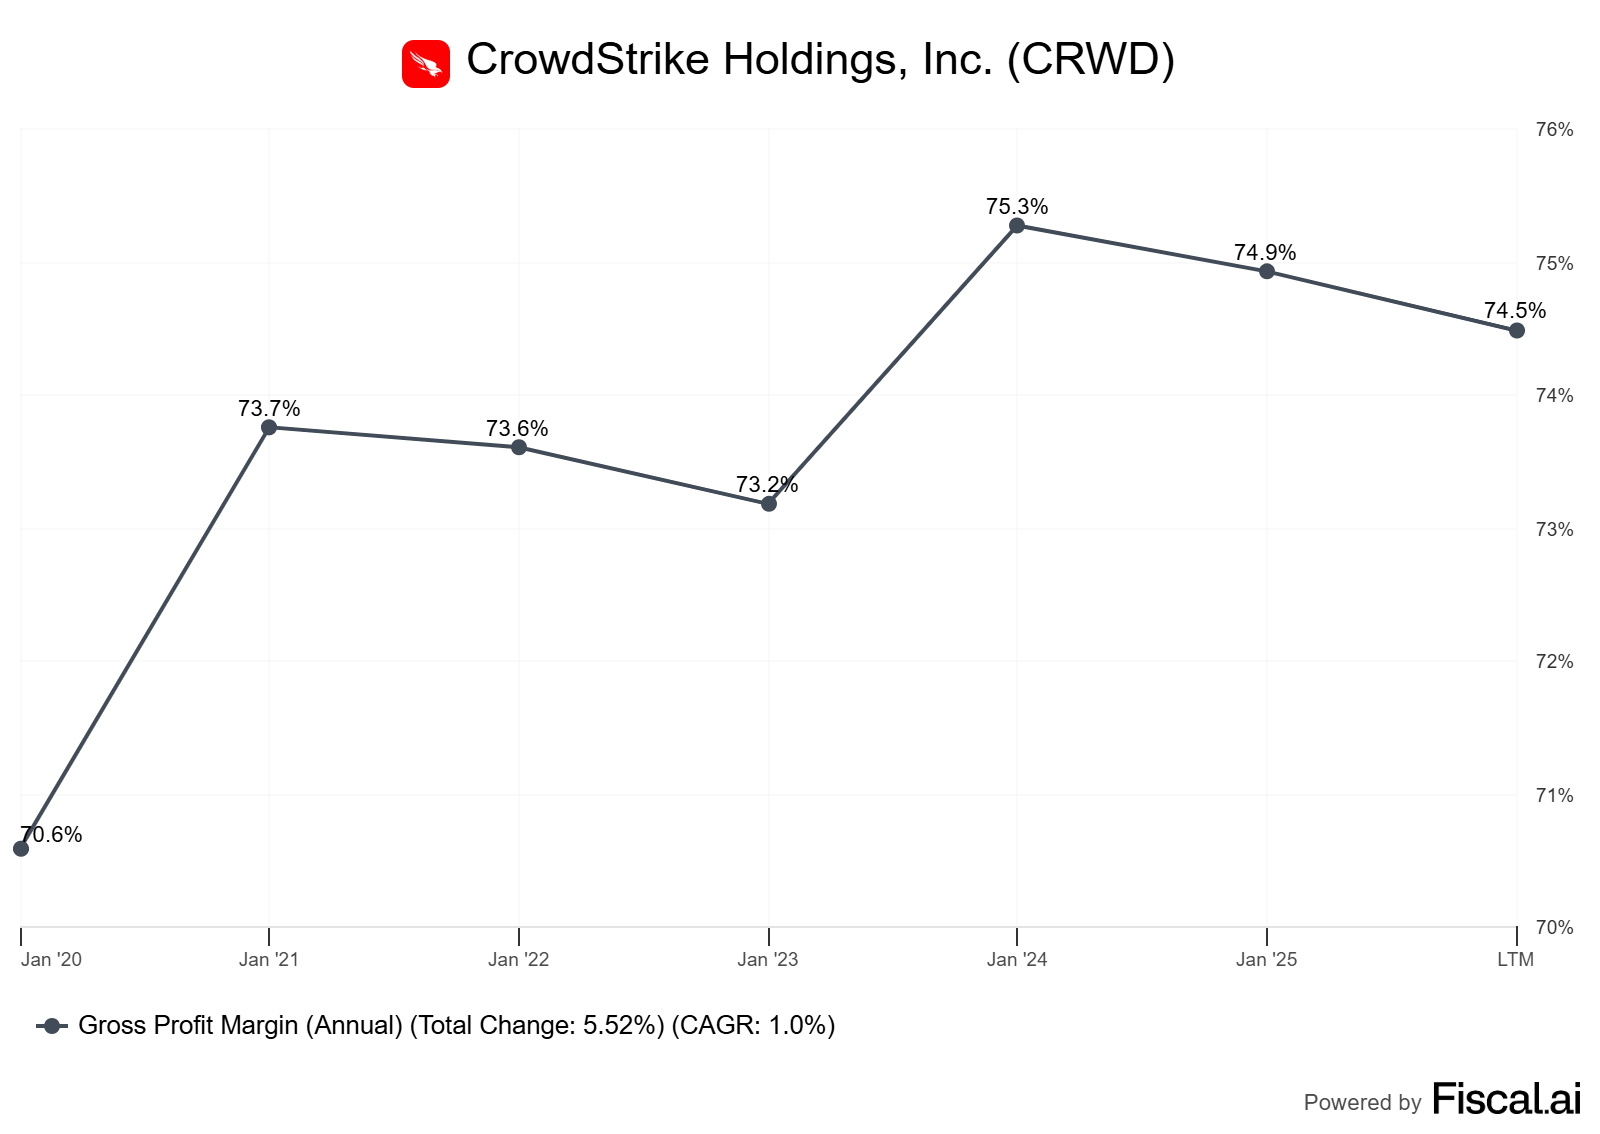
For CrowdStrike, subscription gross margin has been consistently high: GAAP subscription gross margin was 75% and non‑GAAP 80% in both FY2025 and FY2024, a sign that unit economics remain robust even as the platform scales.
Two nuances matter for intermediate investors.
First, compare like with like: subscription gross margin vs. total gross margin across peers can differ based on the service mix. Second, accounting choices can move gross margin at the margin; for example, Zscaler’s FY2024 gross margin benefited from extending server useful lives to five years.
Operating profit margin
Operating margin reflects how efficiently management runs the business after sales and marketing, R&D, and G&A, but before interest and taxes.
Operating Profit Margin = Revenue / Operating Income × 100%
For growth software companies, operating margin indicates whether scale is fostering discipline.
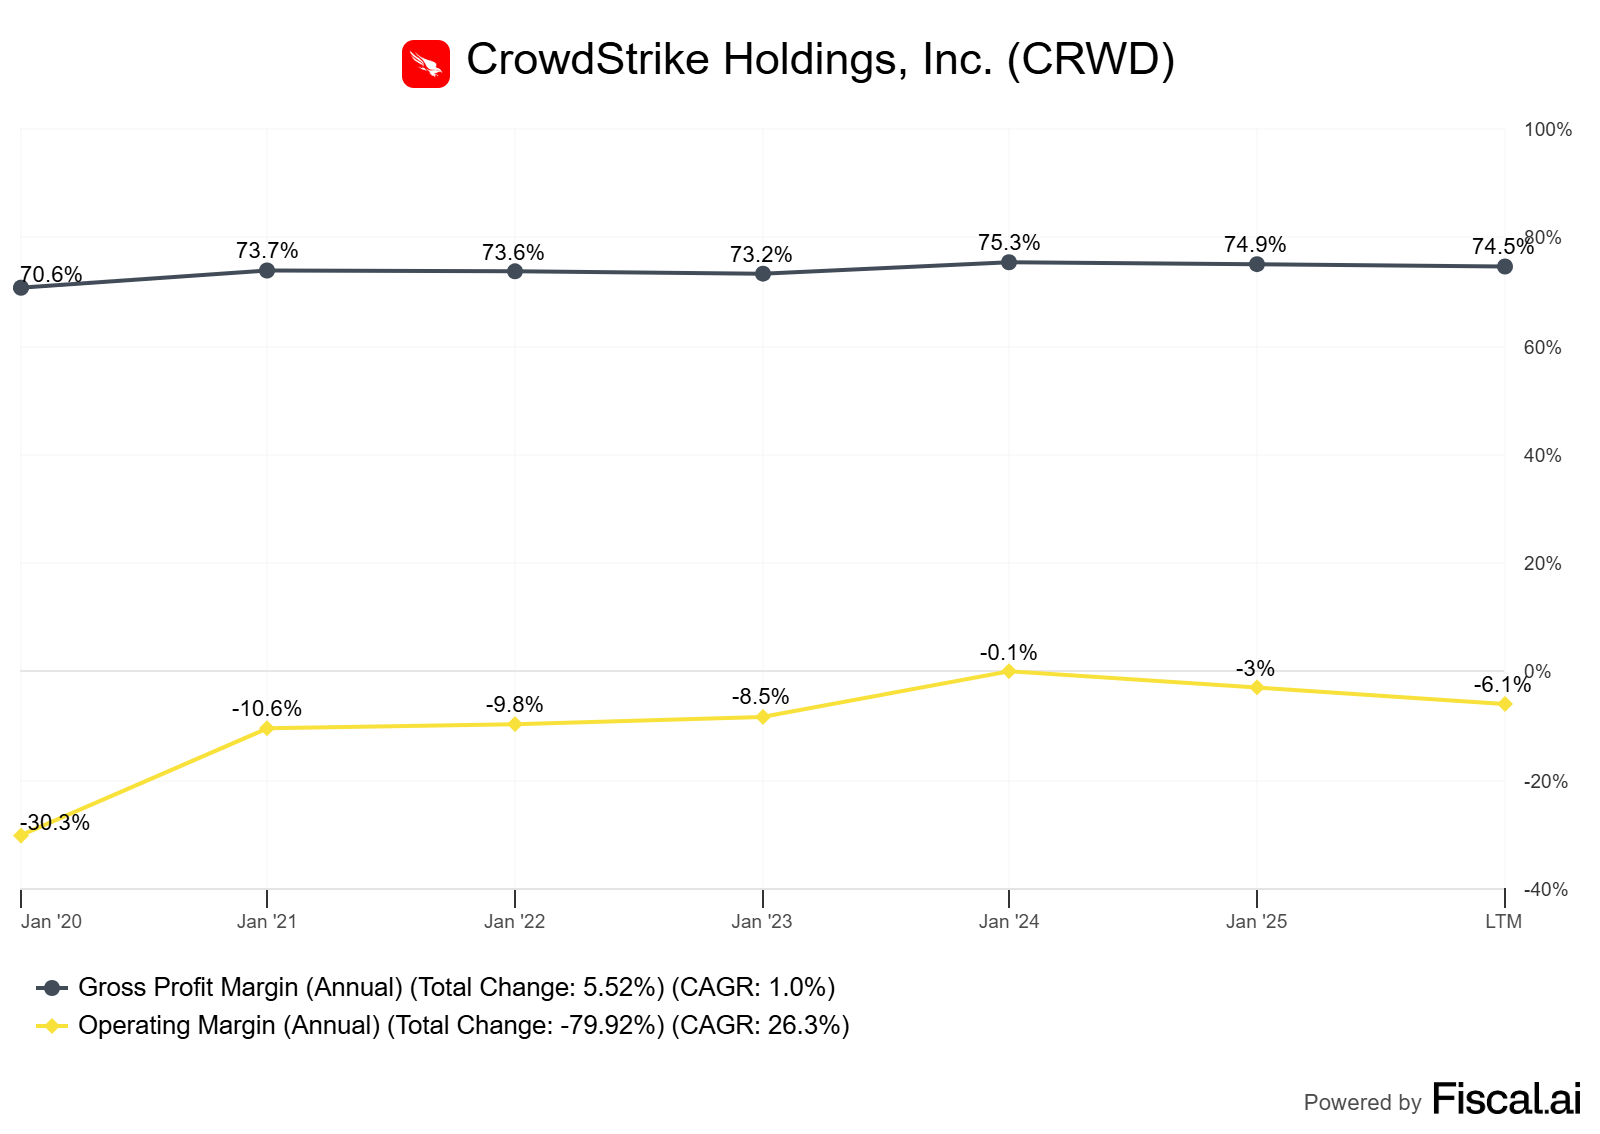
CrowdStrike’s non‑GAAP operating income was $837.7M on $3.95B of revenue in FY2025—about 21%—versus $660.3M on $3.06B (about 22%) in FY2024. That’s essentially stable operating profitability while still investing in growth.
Peers provide context: Zscaler posted a 20% non‑GAAP operating margin in FY2024, while Palo Alto Networks, a more mature scaled peer, guided to a 27.5%–2.0% non‑GAAP operating margin for FY2025 and achieved 26.9% in Q3 FY2024, reflecting benefits of scale and platform consolidation.
Net profit margin
Net margin is the “bottom line”—what’s left after all expenses, including interest and taxes.
Net Profit Margin = Revenue / Net Income × 100%
Here, it’s vital to distinguish GAAP vs. non‑GAAP. GAAP includes non‑cash stock‑based compensation and amortization of intangibles; non‑GAAP excludes them to show core operating performance.
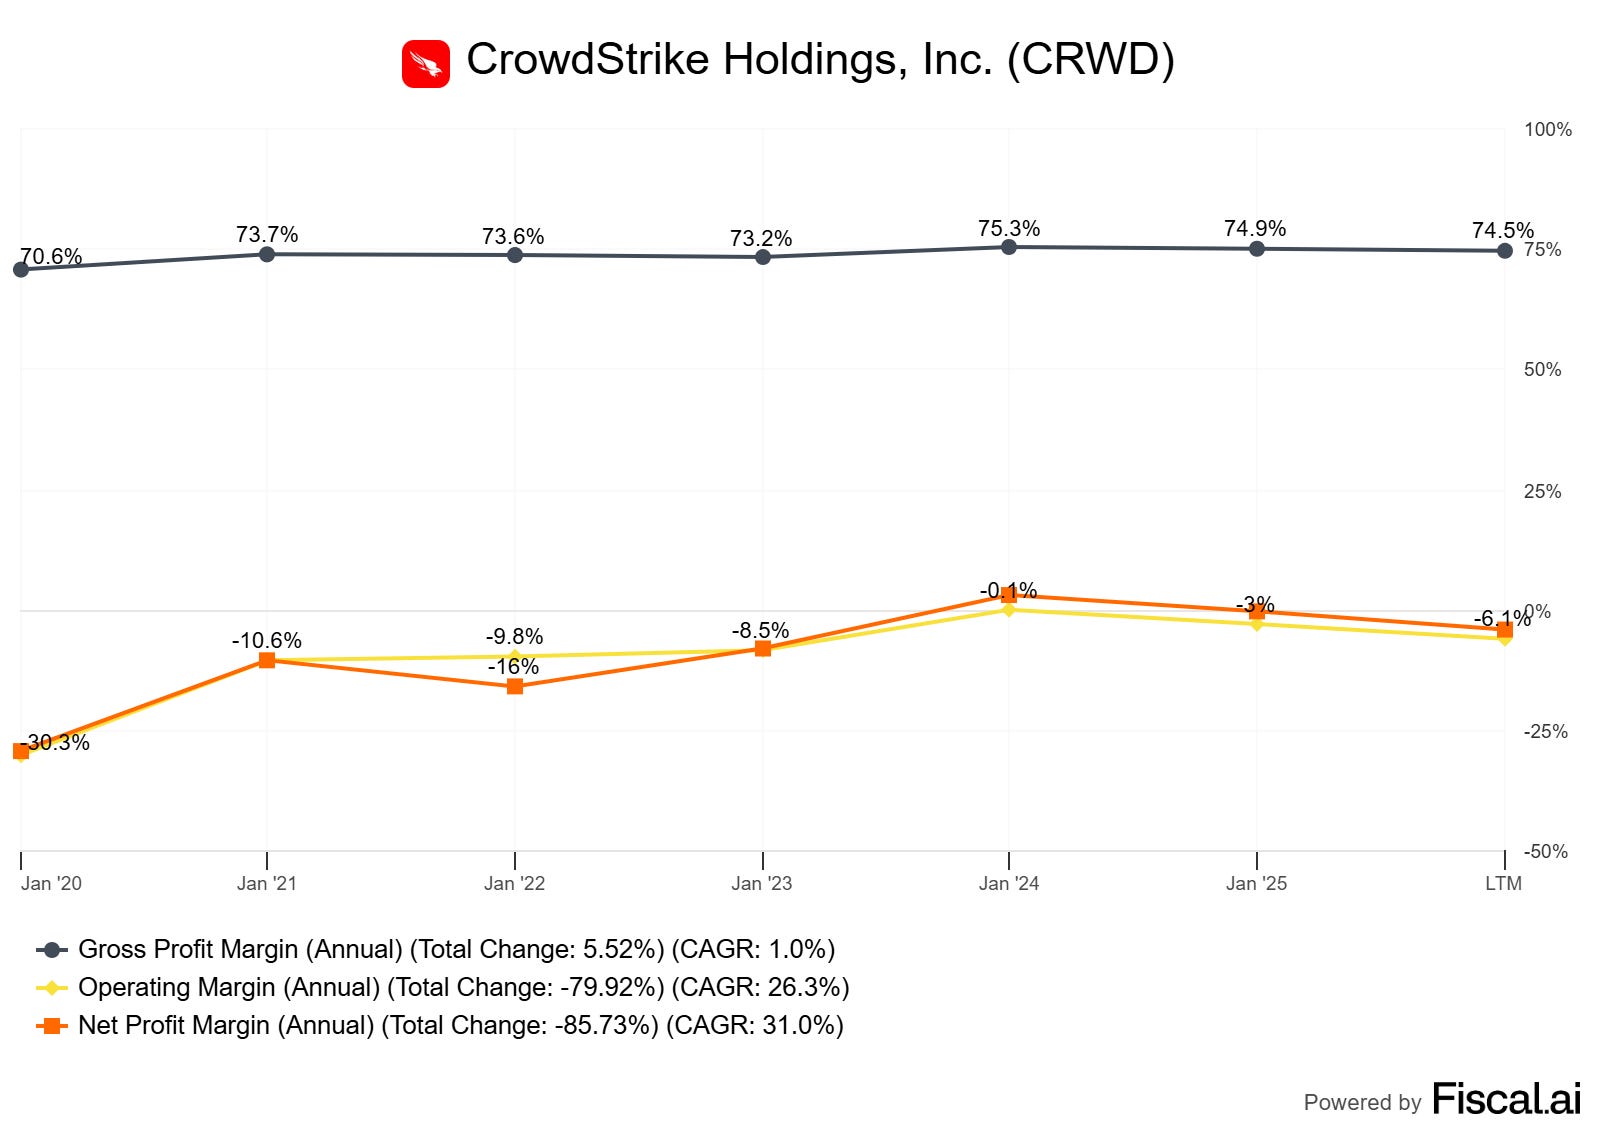
In FY2025, CrowdStrike’s GAAP net income was a small loss (−$19.3M, roughly −0.5% margin), but non‑GAAP net income was $987.6M, about a 25% margin—up slightly from roughly 24.6% in FY2024.
This GAAP/non‑GAAP gap is common in high‑growth software because SBC is meaningful; your view on dilution and long‑term operating leverage should inform which you weigh more.
Free cash flow margin
FCF margin shows the share of revenue that turns into owner’s cash after capital expenditures.
Free Cash Flow Margin = Revenue / Free Cash Flow × 100%
In subscription businesses, FCF can run above net income due to upfront billings and deferred revenue.
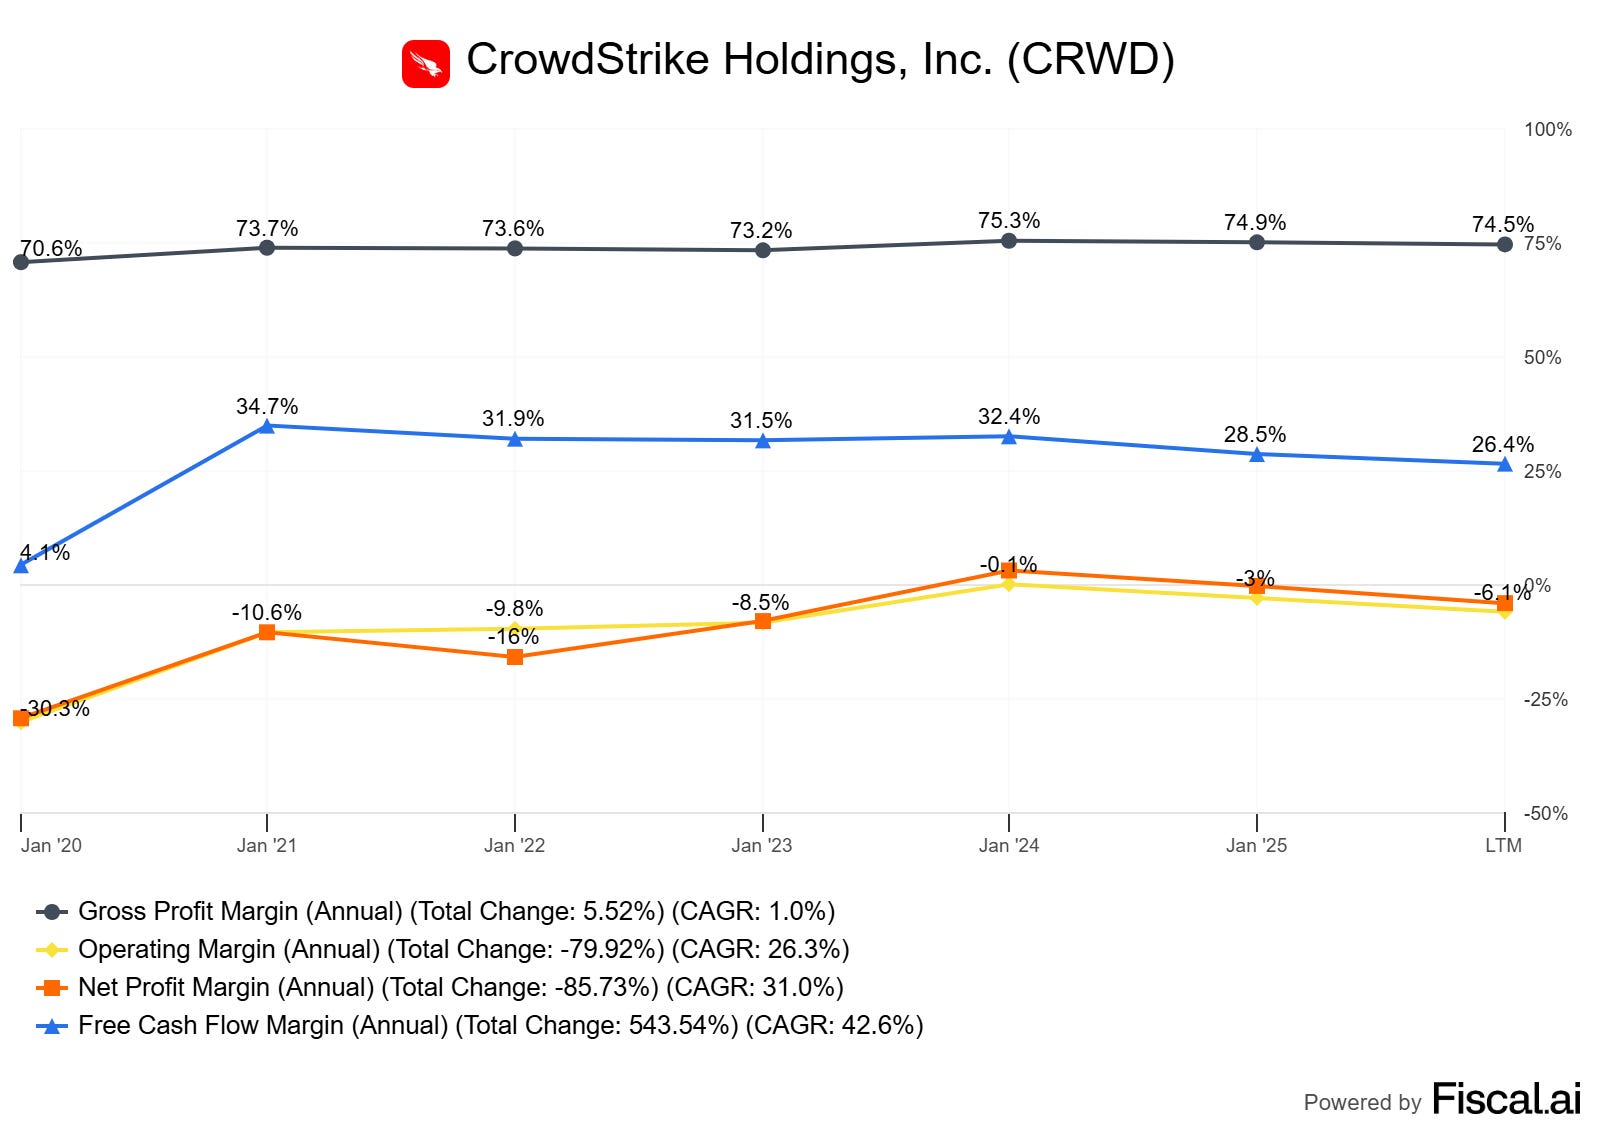
CrowdStrike generated record FY2025 FCF of $1.07B on $3.95B revenue—about 27%—versus $938M on $3.06B (about 31%) in FY2024. The dollar FCF grew, but the margin stepped down a few points, which can reflect working‑capital timing, reinvestment, or seasonality; note that Q1 FY2025 FCF ran at 35% of revenue, illustrating intra‑year variability.
Again, peers help frame quality and scale. Zscaler delivered a 27% FCF margin in FY2024—very similar to CrowdStrike’s FY2025 level—on 20% non‑GAAP operating margins, a classic high‑growth SaaS profile. Palo Alto Networks runs structurally higher FCF margins—guided at 38.5%–39.0% for FY2024—given its scale, platform breadth, and strong billings dynamics.
Applying the framework: CrowdStrike’s margins and trends
Start with unit economics. Subscription gross margin at 78%–80% is both high and steady across FY2024–FY2025, which signals resilient pricing and efficient cloud delivery at scale. That stability supports the long‑term model and reduces execution risk at the cost of service
Move to operating discipline. Non‑GAAP operating margin held roughly flat around 21% despite 29% revenue growth (to $4.24B) and continued product expansion (Next‑Gen SIEM, Cloud, Identity). That suggests management is balancing growth investment with expense control. The company’s 97% gross retention and rising multi‑module adoption also backstop margin durability as customers consolidate on Falcon
Assess bottom‑line optics. The FY2025 GAAP loss reflects stock-based comp and other non-cash items; the non-GAAP net margin at ~25% shows healthy underlying profitability and improved year-over-year. As an investor, track both: sustained non‑GAAP strength should, over time, converge toward GAAP as SBC normalizes as a percent of revenue.
Validate with cash. FCF dollars hit a record, and the margin, while a few points lower than FY2024, remains robust in the high‑20s, consistent with best‑in‑class security SaaS. Given subscription models’ seasonality and billing cycles, it’s normal to see quarterly FCF margin swings (e.g., Q1 FY2025 at 35%).
Bottom line on CrowdStrike: high and stable subscription gross margins, steady ~21% non‑GAAP operating margins at scale, improving non‑GAAP net margin near 25%, and strong FCF generation in the high‑20s—supported by sticky customers and expanding platform adoption. That’s a solid profitability profile for a growth compounder.
How CrowdStrike stacks up to peers
Against Zscaler, CrowdStrike’s FY2025 profile is strikingly similar on FCF margin (around 27%), with a slight edge on operating margin versus Zscaler’s FY2024 20%. Both operate with high subscription gross margins and invest heavily in go‑to‑market and R&D.
Against Palo Alto Networks, CrowdStrike runs lower operating and FCF margins than PANW’s late‑stage profile (FY2024 non‑GAAP operating margin ~27% and adjusted FCF margin 38.5%–39.0%), which is what you’d expect from a much larger, diversified platform that’s realized more scale economics and consolidation benefits.
Practical tips for analyzing margins in cybersecurity SaaS
Think “quality before quantity.” Stable or rising subscription gross margin alongside expanding module adoption is a strong sign that pricing power is durable. Read non‑GAAP operating and net margins in context: temporary dips can reflect purposeful reinvestment (sales capacity, AI features) that should be visible in ARR and pipeline. Watch GAAP vs. non-GAAP gaps and share-based compensation trends; over time, best-in-class operators narrow the gap.
For FCF, track trailing‑twelve‑month margin and working‑capital drivers (deferred revenue, collections) to cut through quarterly noise. Finally, compare peers on the same basis and fiscal year, and remember that accounting changes (like server life depreciation) can move reported gross margins by tens of basis points without changing economics.
Quick worked example: calculating CrowdStrike’s FY2025 margins
Using figures from CrowdStrike’s FY2025 release: revenue $3.95B; non‑GAAP operating income $837.7M; non‑GAAP net income $987.6M; FCF $1.07B; GAAP net income −$19.3M.
Operating margin ≈ 837.7 / 3,950 ≈ 21%.
Non‑GAAP net margin ≈ 987.6 / 3,950 ≈ 25%.
GAAP net margin ≈ −19.3 / 3,950 ≈ −0.5%.
FCF margin ≈ 1,070 / 3,950 ≈ 27%.
All source figures: CrowdStrike FY2025 investor relations press release here.