
How Growth Starves Cash: A Working-Capital Stress Test

Growth is seductive: fast top-line momentum can mask a deeper problem — negative cash flow driven by working-capital needs.
Todya’s article shows why quality investors must pair ROIC and reinvestment runway with a working-capital stress test so a profitable company doesn’t run out of cash while scaling.
TL;DR
High growth ≠ free cash: fast revenue growth can use cash if receivables and inventory outpace supplier terms.
Check the cash conversion cycle first: Inventory Days + Receivable Days − Payable Days. A lengthening cycle is a red flag.
Quality lens: prefer companies with ROIC > WACC and modest incremental working capital per $1 of revenue.
Per-share framing: track FCF/share, not just margins — buybacks, dilution, and SBC materially change per-share economics.
Stress-test rule: if incremental revenue requires >$0.30 incremental working capital per $1, prefer management to fund growth from cash flow or cheap, durable financing.
Why it matters
Investors love durable profitability (ROIC > WACC). But profitability on the income statement can be illusory when growth forces the business to tie up cash in inventory or receivables. The result: a company can grow revenue and show profits yet need external cash to fund day-to-day operations. That’s the “growth starves cash” problem — and it kills otherwise attractive business models if management misjudges reinvestment needs or capital allocation priorities.
Evidence: academic work shows that working-capital investments materially drive short-term cash outcomes and can be value-enhancing or value-destroying depending on efficiency and timing.
Core concepts (quality-investing angle)
ROIC vs WACC — the starting gate
Why it matters: If ROIC consistently exceeds WACC, the company creates value for every dollar it reinvests. But what is being reinvested matters. Reinvestment can be capex, R&D, M&A or working capital. Working-capital-heavy reinvestment can be less durable — and more timing-sensitive — than productive capex. Investors must therefore separate returns on operating capital from returns on working capital.
Reinvestment runway & capital intensity
Reinvestment runway = the sustainable level of growth that existing cash flows can fund before external capital is required. Compute incremental working capital per incremental revenue over the last 3–5 years. A high ratio → short runway. Prefer businesses where organic cash generation funds >50% of near-term growth.
Unit economics & per-share framing
Unit economics (contribution margin, payback period, customer LTV/CAC) tell you whether growth is profitable at scale. Per-share focus (FCF/share, EPS/share, share count changes) ties economics to investor returns — buybacks vs dilution change how reinvestment and working-capital needs are split between shareholders and creditors.
Moat durability — evidence, not claims
Look for concrete moat evidence: ability to increase prices without losing volume, durable retention/switching costs, or structurally low working-capital needs (e.g., marketplace/asset-light models). Don’t accept “moat” as narrative — demand data (stable gross margins, stable DSO/Inventory days, high customer retention).
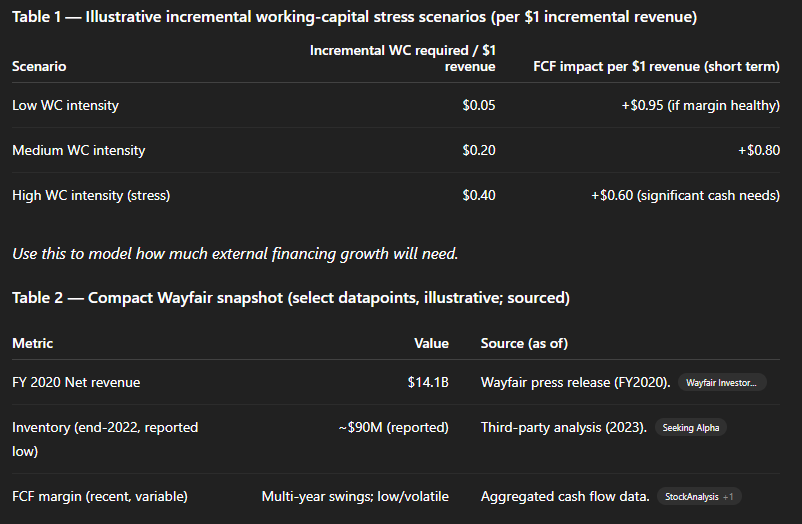
Worked example: Wayfair — a working-capital narrative (US, mid-cap+ context)
Why Wayfair: an e-commerce player where working-capital dynamics (inventory, payables, and customer prepayments) materially affected cash flow while growth accelerated. Wayfair explicitly describes operation on a negative working-capital cycle in investor materials — meaning quarter-to-quarter growth can be a cash use even with strong revenue growth. (PublicNow Docs)
Evidence: Wayfair’s press release and filings show rapid revenue growth in 2020 (FY net revenue $14.1B, up ~55% YoY) while gross profit and cash flow patterns shifted across years. Gross profit dollars grew materially, but working-capital variability — especially around inventory and returns — made operating cash flows volatile. (Wayfair Investor Relations)
Result: Sustainable profitability requires monitoring the cash conversion cycle and incremental working-capital per $1 revenue. Wayfair’s model (marketplace, dropship + some inventory) reduced markdown risk relative to traditional retail but did not eliminate working-capital sensitivity. Agencies and rating firms note Wayfair’s working-capital profile when assessing credit. (Fitch Ratings)
Caveats / alternative interpretations: Some argue negative working capital is efficient (customer pays before suppliers are paid). That’s true — until supplier terms tighten, returns spike, or growth accelerates faster than payables extension. Always tie working-capital analysis to supply-chain and return risk.
Two small tables
How to do this yourself — step-by-step (practical)
Gather the data (primary sources): last 5 annual reports (10-Ks), last 8 quarters of 10-Qs, cash flow statements, MD&A, and investor presentations. Supplier terms and returns policy often described in notes. (Sources: company filings, investor relations pages). (Wayfair Investor Relations)
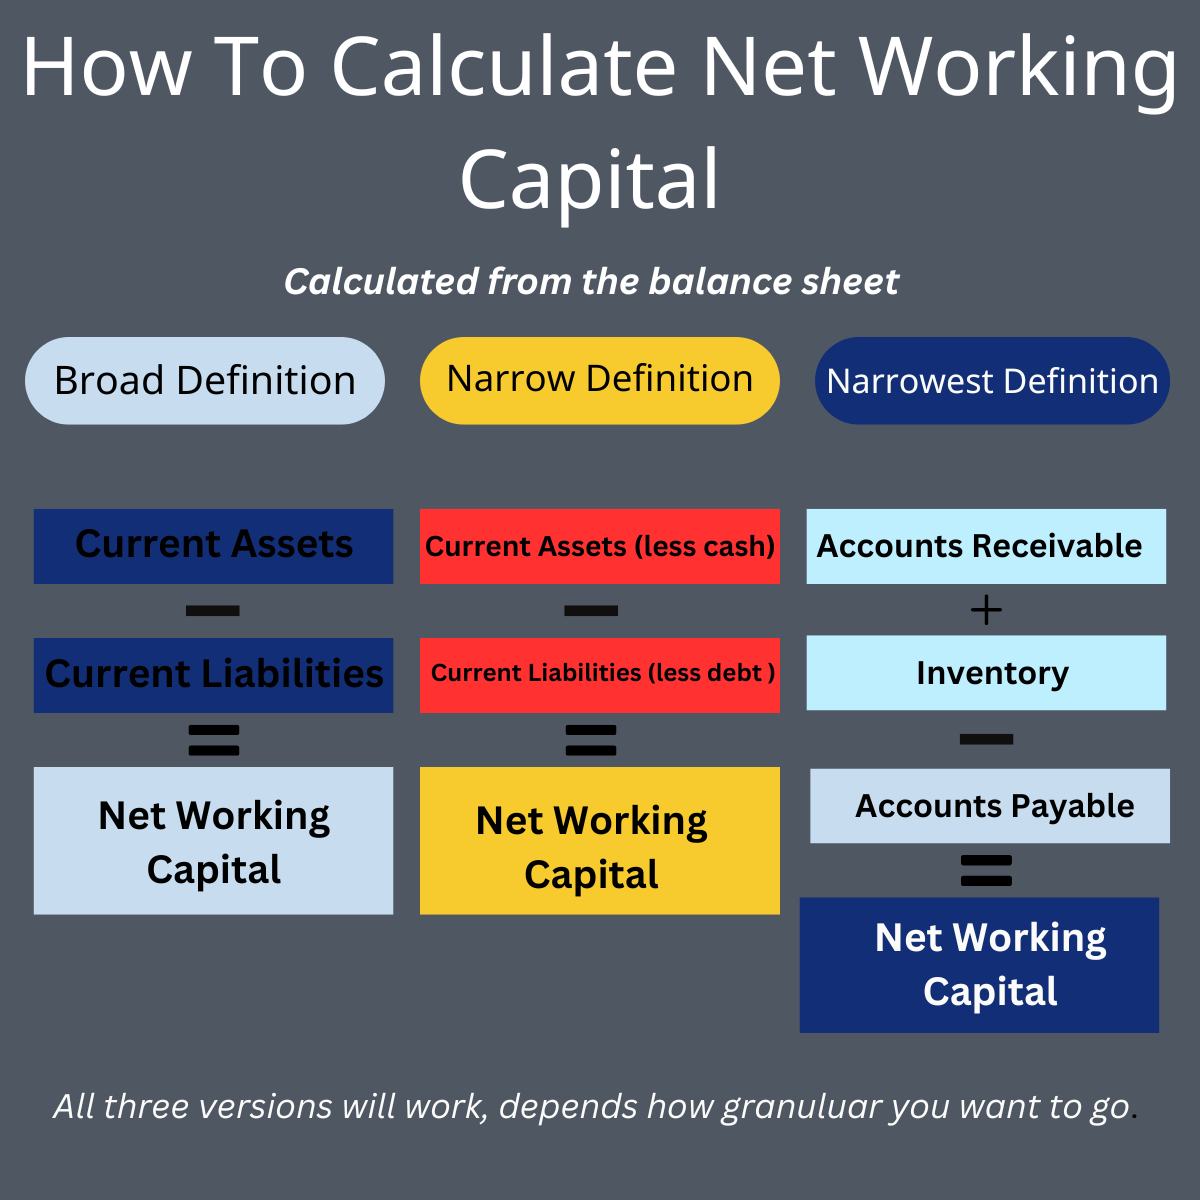
Compute the cash conversion cycle (CCC):
Inventory Days = (Avg Inventory / COGS) × 365
Receivable Days (DSO) = (Avg AR / Revenue) × 365
Payable Days (DPO) = (Avg AP / COGS) × 365
CCC = Inventory Days + DSO − DPO
Calculate incremental WC per $1 revenue: regress change in net working capital (ΔNWC) against change in revenue over rolling 3-5 year windows. Slope ≈ incremental WC per $1 revenue.
FCF conversion check: Build Net Income → Operating Cash → Free Cash Flow conversion over 5–10 years. Highlight years where ΔNWC drove the gap.
Decision thresholds (quality rules):
Prefer ROIC – WACC > 5% sustained.
Accept incremental WC per $1 revenue < $0.15 for fast growth companies. If > $0.30, demand clear financing plan.
Require FCF/share growing or stable after normalizing for seasonal WC swings.
Stress test: model 3 scenarios (base, slow-collection, inventory spike). Project cash burn over 4 quarters and see if available cash + revolver cover it. If not, management must raise capital or slow growth.
Pitfalls & false positives
Pitfall 1 — Negative working capital is always good. Not always; it can mask supplier leverage that can disappear in a stress.
Pitfall 2 — Focus only on margins. Margin stability with rising CCC still destroys cash.
Pitfall 3 — One-off inventory or receivable items. Always read notes: returns, customer credits, VAT/tax timing can create recurring effects.
Pitfall 4 — Ignoring per-share dilution. SBC and equity raises can hide weak per-share cash generation.
Pitfall 5 — Confusing growth funded by debt as healthy. Debt can be cheap in the short term, but it changes the risk profile (interest rates, covenants).
Checklist / one-pager (saveable)
Calculate CCC (Inventory, Receivables, Payables).
Compute incremental ΔNWC / ΔRevenue (3–5y).
Compare ROIC to WACC and split ROIC into operating vs working-capital returns.
Run 3-point cash stress test (slow receipts/inventory spike / mixed).
Verify per-share FCF trend (FCF/share) and dilution drivers.
Glossary
CCC (Cash Conversion Cycle): Days to convert inventory and receivables into cash minus payable days.
ΔNWC: Change in net working capital (current assets minus current liabilities) between periods.
ROIC: Return on invested capital; measures operating profit relative to invested capital.
FCF conversion: Ratio showing how much net income converts into free cash flow.
Per-share FCF: Free cash flow divided by diluted shares outstanding.
Further reading
Zeidan, R. “Cash conversion cycle and value-enhancing operations”, Journal of Corporate Finance (2017). (ScienceDirect)
CorporateFinanceInstitute — Working capital cycle primer. (Corporate Finance Institute)
Wall Street Prep — working capital cycles explainer. (Wall Street Prep)
References (selected; all “as of” dates given)
Fitch / S&P / other credit commentary on Wayfair’s operating model and working-capital notes (Sep 2024). As of Sep 2024. (Fitch Ratings)
Scholarly/industry discussions on CCC and working-capital impact: Zeidan (2017) and related literature. As of 2017–2024. (ScienceDirect)
Shopify Inc., Annual Reports / 10-Ks (for a marketplace comparison and example of working-capital programs). As of 2024 filings. (Q4 Capital)
Educational content, not investment advice.
thank you for sharing the pitfalls. great alternative views on debt and leverage