
How FICO Turns Price Increases into Cash: A Case Study in Quality Compounders

FICO is a rare beast in software: entrenched, mission-critical, and structurally asset-light.
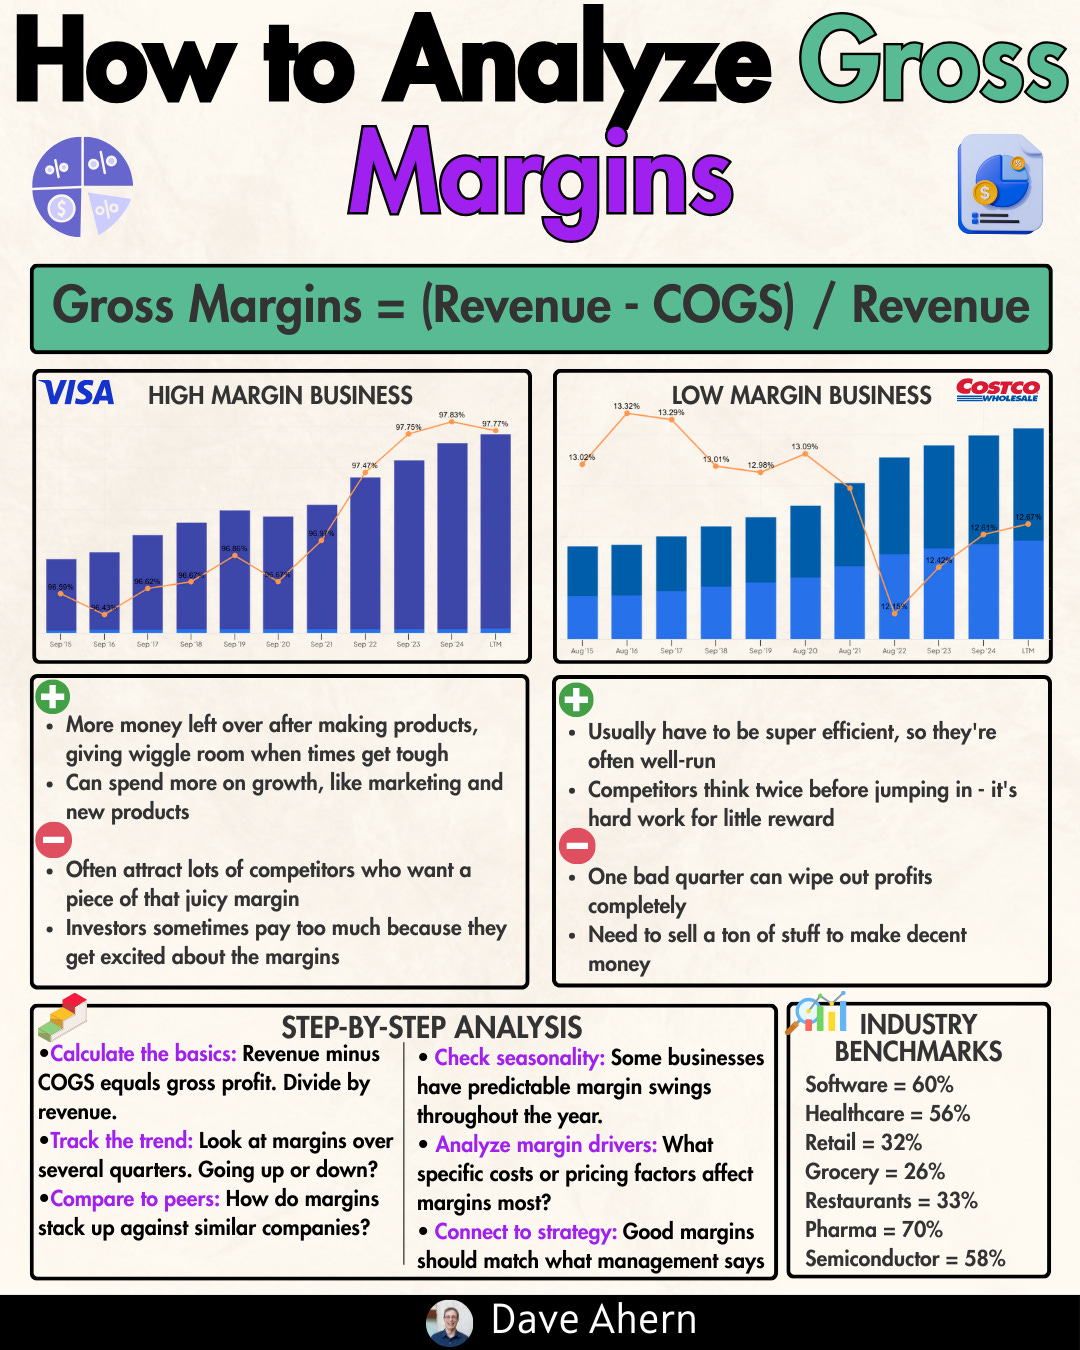
When it raises prices—or shifts how it charges—incremental gross margin is near 100% in its Scores segment. That kind of unit economics compounds fast. Today, we’ll unpack where those economics come from, what to watch in the numbers, and how to translate accounting line items into investable insight.
TL;DR
FICO’s Scores business exhibits extreme incremental margins; small price changes fall through to operating profit and free cash flow (FCF).
Quality lens: focus on ROIC well above WACC, pricing power, retention, and per-share value creation from buybacks.
Break the accounts: reconcile GAAP to “owner earnings,” adjusting for SBC, working capital timing, and capitalized software.
Watch reinvestment: Platform ARR and net retention in Software drive the runway; Scores is a cash engine.
Decision rules: prefer ROIC – WACC > 5% sustained; FCF conversion > 90% over cycle; stable or rising FCF per share; moat evidence > marketing claims.
Why it matters
Pricing power with ultra-high incremental margins is the gold standard for durable value creation. In asset-light models, each dollar of price can translate almost directly to operating income and FCF, provided churn doesn’t spike. The quality lens asks:
Does ROIC sustainably exceed WACC, and by how much?
Is there a reinvestment runway to deploy retained cash at high returns?
Are per-share metrics compounding (FCF/share, EPS) due to disciplined buybacks rather than dilution?
Are moats evidenced by retention, switching costs, and stable margins through cycles?
Where investors go wrong:
Treating all revenue growth as equal. Price-driven growth in a low variable-cost model is far more powerful.
Ignoring capital allocation. Buybacks at sensible valuations + low share issuance can drive per-share outcomes.
Taking “moat” on faith. Evidence beats claims: net retention, contract stickiness, stable-to-rising margins.
Missing working capital and SBC dynamics that distort FCF.
Core concepts (quality lens)
ROIC vs WACC and value creation
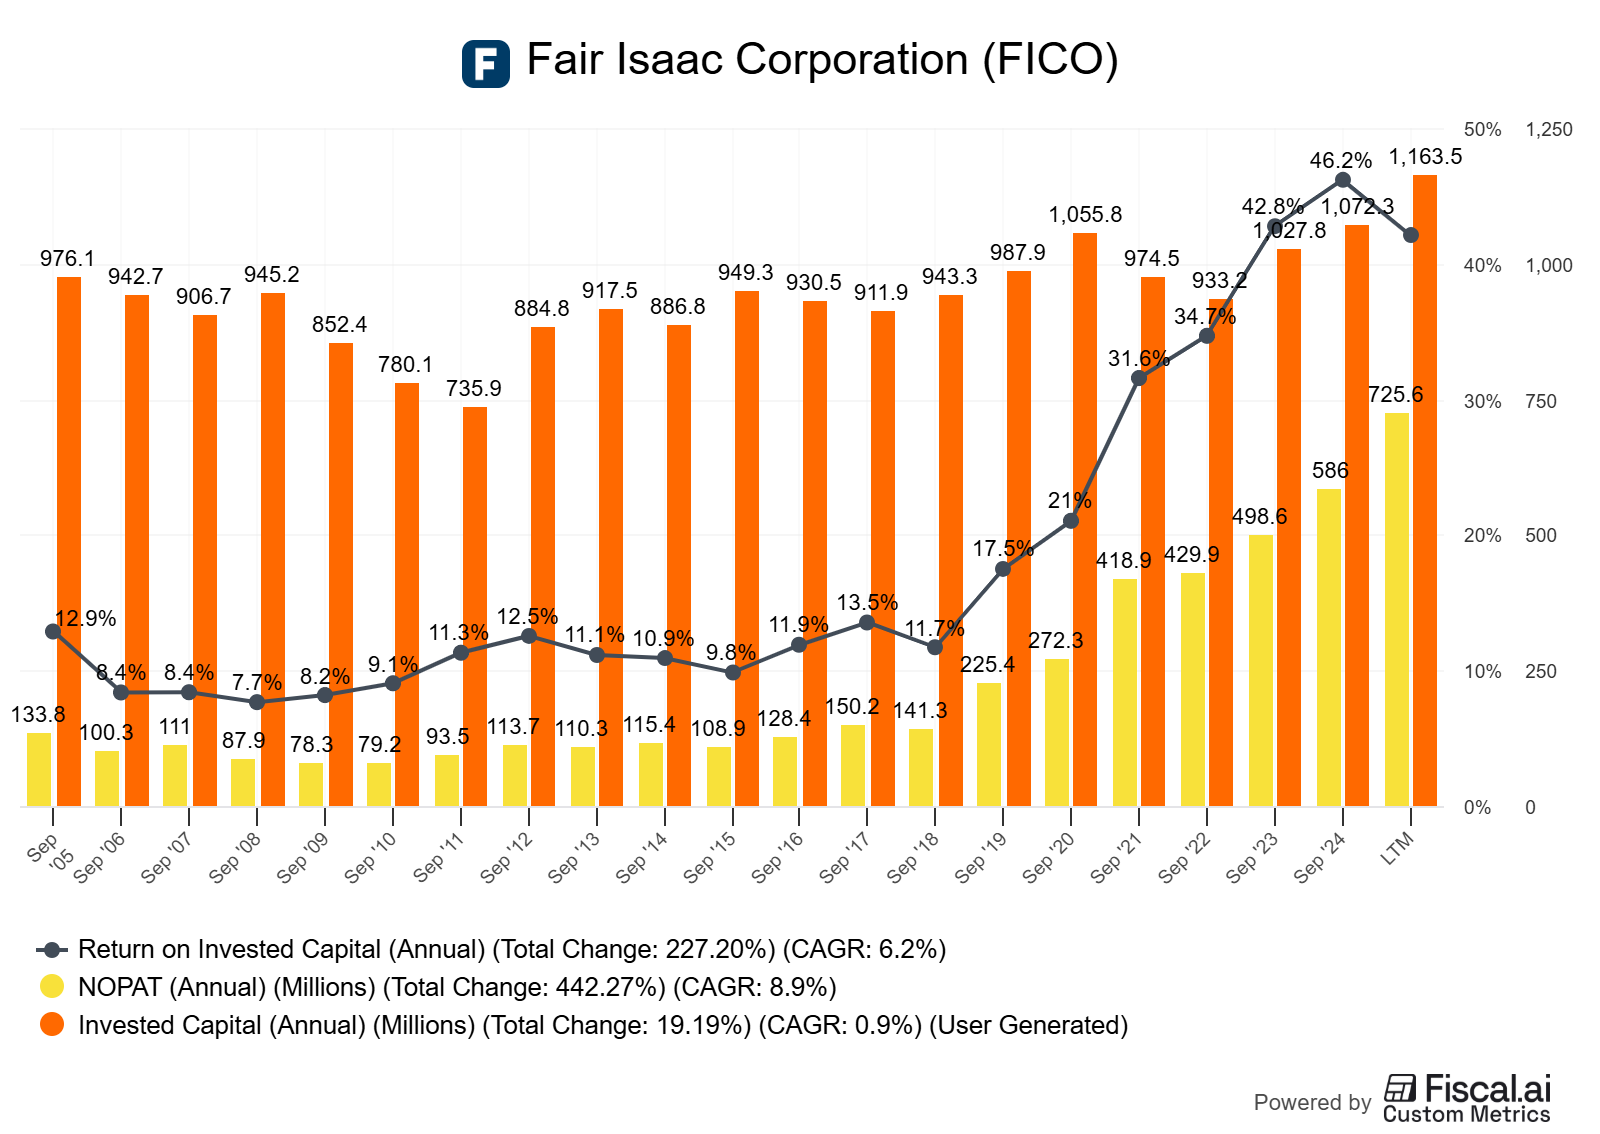
ROIC (return on invested capital) is the after-tax operating return over the capital required to run the business.
Value creation happens when ROIC > WACC (cost of capital). Spread matters more than absolute growth.
In asset-light networks, ROIC tends to be high because incremental capital needs are low.
Formula:
ROIC = NOPAT/Invested Capital and Value Spread = ROIC−WACC
Decision rule: Prefer businesses with ROIC – WACC > 5% for 5+ years, and evidence of reinvestment opportunity at or near that spread.
Reinvestment runway and capital intensity
Scores-like models generate cash but may have limited organic reinvestment channels; capital allocation becomes key (buybacks, selective M&A, platform build-out).
Platform software (SaaS + decisioning) can be a reinvestment path—watch ARR growth and NRR for evidence.
Unit economics and per-share metrics
High incremental margins in Scores mean per-dollar price increases largely drop to EBIT/FCF.
Per-share: FCF/share and EPS/share over time, plus share count trajectory (buybacks vs dilution) drive investor returns.
Moat durability and evidence (not claims)
Evidence: contract lengths, required integrations, regulatory standard status, net retention, margin stability through cycles.
Be skeptical of marketing. Look for 5–10y trends: margins up, churn low, price realizations.
Mode focus: Case/Accounting Saturday
We’ll do a GAAP → “owner earnings” bridge, and isolate the incremental margin dynamics that make FICO special. We’ll also discuss the recent credit-score pricing/delivery model updates for mortgage (direct licensing) and how that could affect mix and pass-through economics.
Worked example: FICO (NYSE: FICO)
Why FICO?
Mid/large-cap, mission-critical infrastructure in consumer lending workflows.
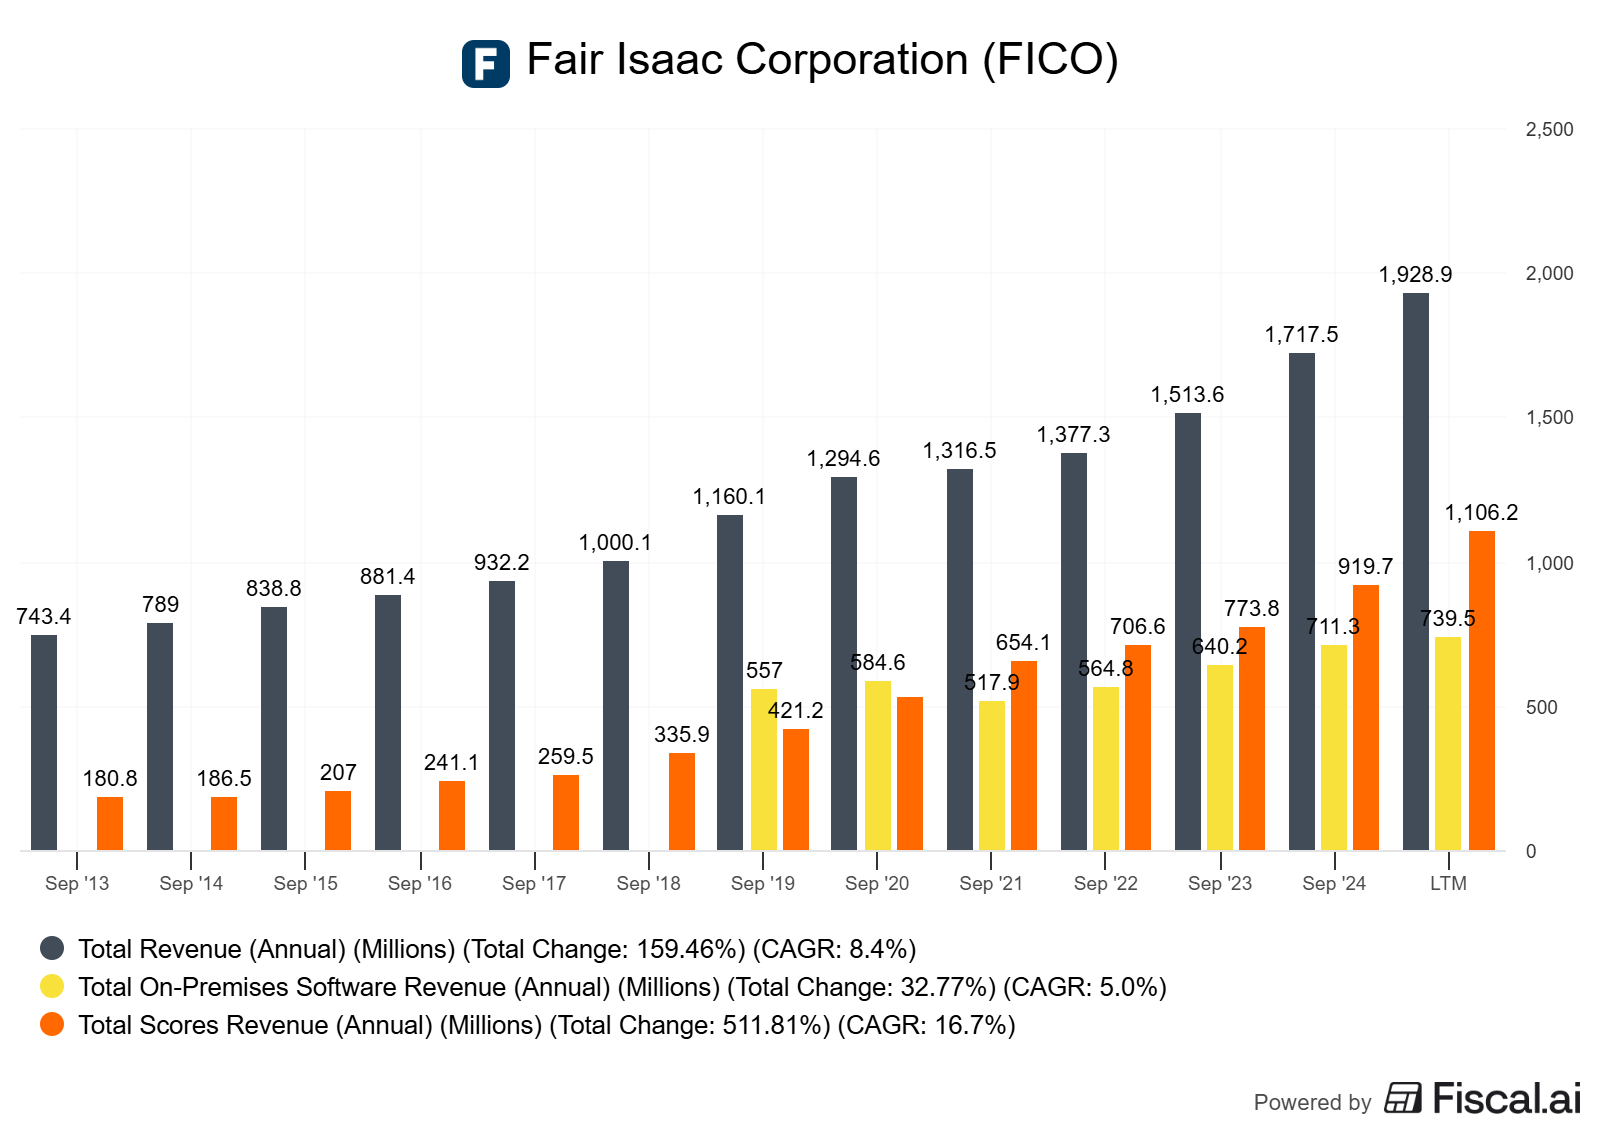
Two segments: Scores (asset-light, high margin, pricing power) and Software (decisioning platform/analytics).
Track record of buybacks and strong FCF conversion.
Recent datapoints:
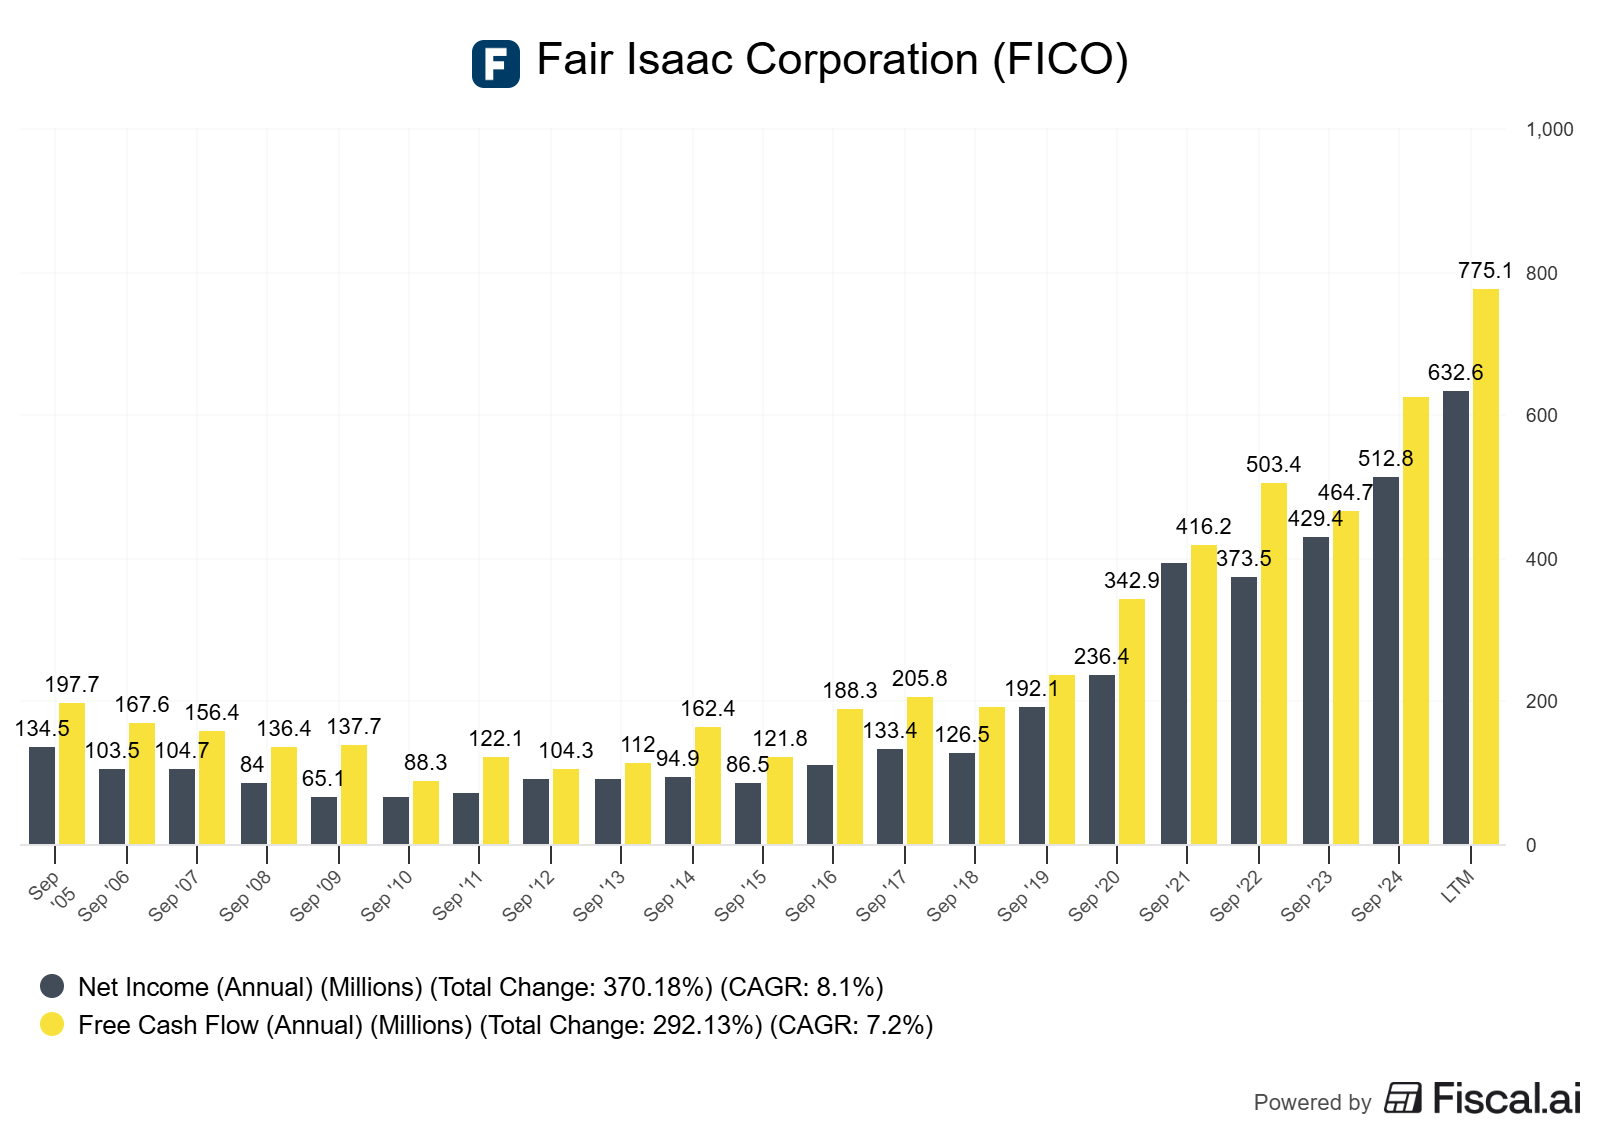
Q2 FY2025 revenue $499M (+15% y/y); GAAP net income $163M (+25% y/y). Trailing 4Q FCF $677M (+45% y/y), per management commentary on the call [Investing.com transcript, as of Apr 29, 2025; see Q2 FY2025 highlights referenced on the IR site: Presentations page] (Investing.com; Presentations - FICO IR).
Scores segment in Q2 FY2025: $297M revenue (+25% y/y), with B2B +31% (mortgage originations strong) (Investing.com).
Software: total ARR ~$715M, Platform ARR +17% y/y; platform NRR ~110% in Q2 FY2025 (total NRR ~102%) (Presentations - FICO IR).
FY2024: continued growth in Scores and ARR; management underscores direct license program evolution in mortgage in FY2025 news flow (see IR site and press coverage). Annual report repository here: Financial Information - FICO IR. 2024 AR PDF listed there (as of Nov 6, 2024).
What “pricing power + ultra-high incremental margins” looks like
Scores is effectively a royalty/usage model with negligible variable cost per unit. Price increases are mostly contribution margin.
Incremental margins in Scores can approach near-100% at the gross level; at the operating level, you’ll still see very high flow-through unless there’s step-up opex (sales/marketing, product) or mix headwinds.
The result: small changes in price/volume mix can produce outsized changes in EBIT and FCF.
Per-share framing and capital allocation
Management has repurchased shares consistently; per Q2 FY2025 remarks, 112k shares repurchased in the quarter (avg price implied near prevailing share price) and a stated view that buybacks are an attractive use of cash (Investing.com). Current shares outstanding around 24M (as of Oct 15, 2025) per StockAnalysis — “as of 2025-10-15”.
Discipline is critical in a high-multiple stock. Buybacks bolster per-share metrics if intrinsic value > price; otherwise, they destroy value. Watch repurchase timing versus valuation bands.
Segment mix and durability
Scores: entrenched standard in US consumer lending workflows. Durable moat from network acceptance, process embedding, and regulatory/secondary-market alignment.
Software: reinvestment vector. Platform ARR growth (+17% y/y in Q2 FY2025) and platform NRR (110%) suggest land-and-expand dynamics (Presentations - FICO IR).
Working capital and accounting nuance
Quarterly FCF can be lumpy due to receivables timing; management noted AR timing affected Q2 FY2025 FCF, with expectations for acceleration in 2H FY2025 (Investing.com).
Adjust GAAP net income for SBC, D&A, and normalize WC to estimate “owner earnings.”
Recent pricing/delivery changes
In early 4Q 2025 press flow, FICO announced a mortgage Direct License Program enabling resellers/lenders to access scores directly, shifting economics vs. the legacy bureau-bundled model (see IR and business press coverage cited on StockAnalysis news feed, “as of 2025-10-15”). This can increase FICO’s take-rate and pricing flexibility. Monitor bureau reactions, customer pushback, and pass-through terms. Early implication: higher unit economics in Scores; watch for temporary friction with ecosystem partners.
Bridge: GAAP → Owner Earnings (illustrative) Start with GAAP net income, add back:
D&A (non-cash)
SBC (treat as real economic cost; for owner earnings you may exclude but then adjust via per-share lens; ensure consistency)
Normalize working capital timing (e.g., big AR movements)
Subtract maintenance capex (exclude growth capex if you can reliably separate) Output is a range rather than a single point if uncertain.
Caveats and alternative interpretations
Mortgage cycle can distort Scores growth; elevated originations boost B2B revenue (Q2 FY2025 effect). Normalize across a cycle.
Software platform growth path is lumpy; NRR/ARR are the right signals, but services revenue and usage variability can muddle quarterlies.
High valuation compresses future returns if growth/disruption narrative stalls.
How to do this yourself
Step 1: Gather data
10-K/10-Q: revenue by segment, margins, cash flow, SBC, capex, WC. Start here: Financial Information - FICO IR. “As of” the filing dates listed there.
IR Presentations/Reg G schedules: ARR, NRR, segment growth, FCF trends: Presentations - FICO IR. “As of” the presentation dates (e.g., Q2 FY2025, Q3 FY2025).
Earnings call remarks for color on pricing, buybacks, and timing: Investing.com transcript for Q2 FY2025.
For quick cross-checks on current shares outstanding/market data: StockAnalysis FICO profile (as of 2025-10-15).
Step 2: Calculate quality metrics
ROIC, WACC, and spread; use NOPAT and average invested capital. If no clean ROIC provided, approximate and use ranges.
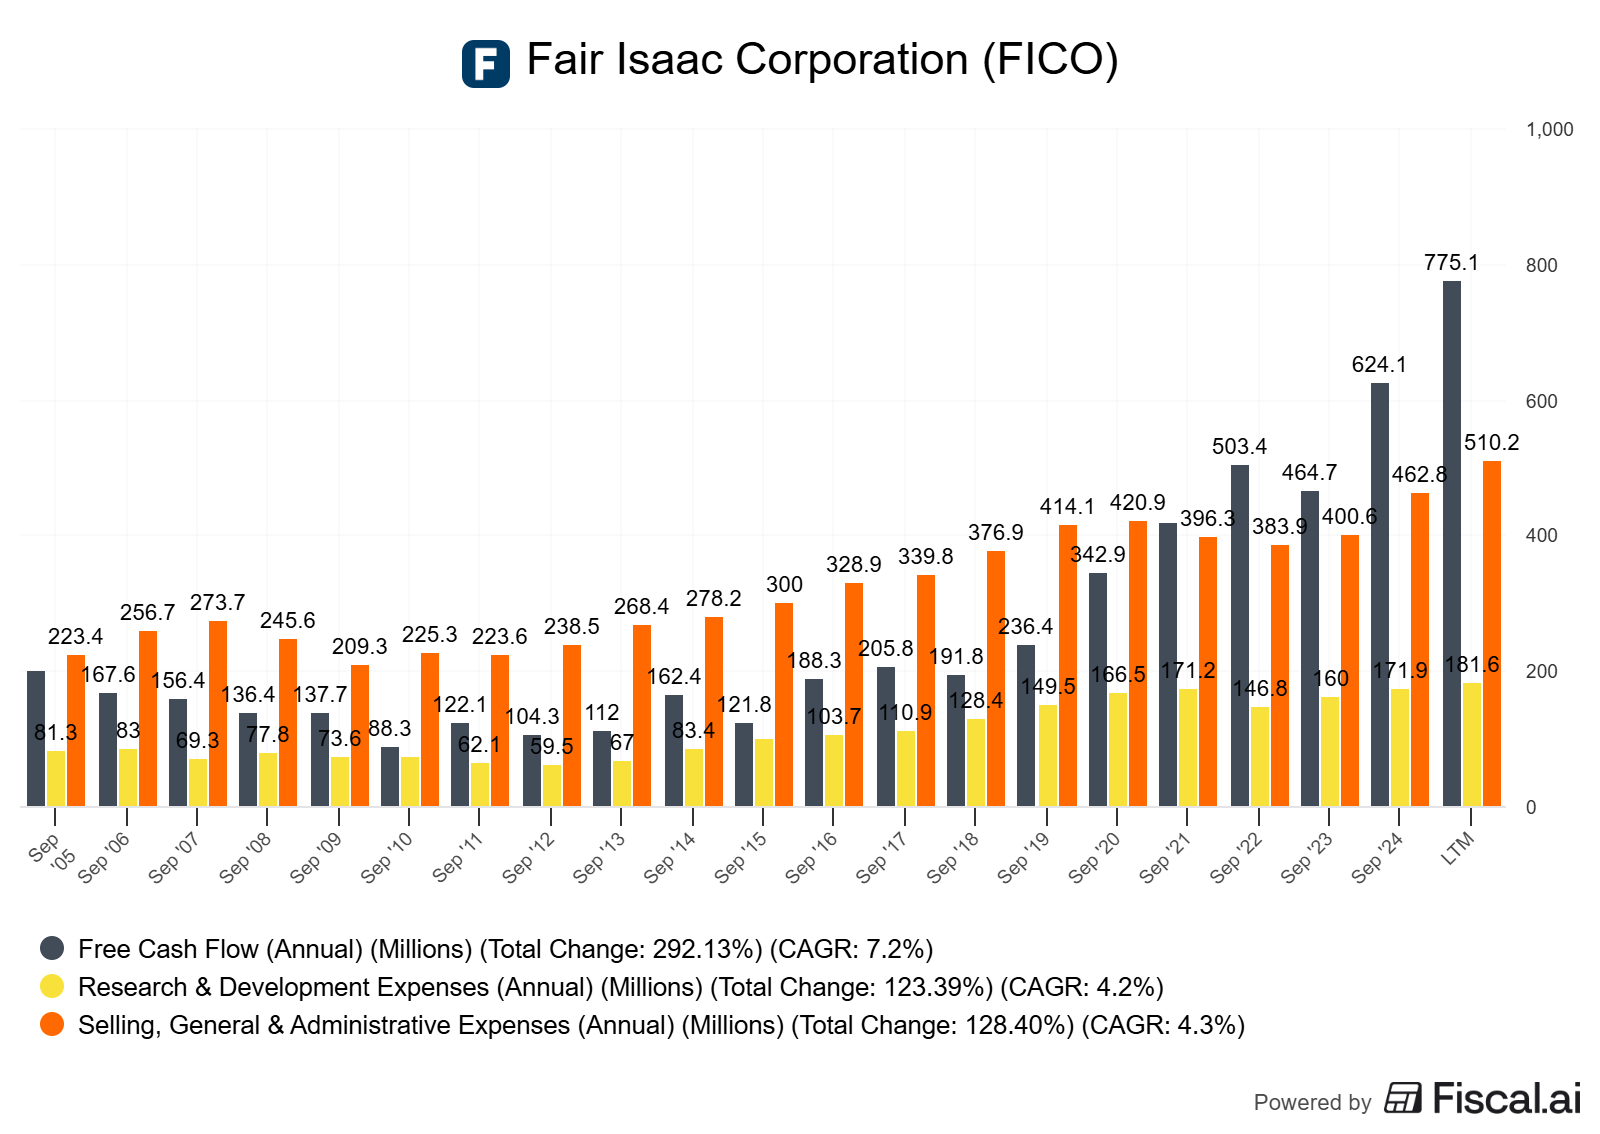
FCF conversion:
FCF = CFO – capex.
FCF conversion = FCF / Net Income and FCF margin = FCF / Revenue.
Per-share: FCF/share, EPS, and diluted share count trend.
Step 3: Examine unit economics and incremental margins
Segment P&L if available; otherwise, infer from segment revenue and corporate margin expansion in periods of price change.
Identify pricing actions (public statements, new license programs, list price changes) and track flow-through to margins.
Step 4: Moat evidence
Look for multi-year stability in gross/operating margins, high NRR (>110% ideal for platform), and entrenched process position (e.g., GSE standards for mortgage scores in the US context).
Step 5: Capital allocation review
Repurchase cadence and amounts (10-K/10-Q and proxy).
SBC as % of revenue and its per-share impact.
Leverage and cost of debt (watch floating vs fixed; management commentary suggests flexibility to pay down floating in high-rate environments, as of Q2 FY2025).
Decision rules and thresholds
Prefer ROIC – WACC > 5% sustained; >10% is rare/durable.
FCF conversion > 90% over cycle for asset-light models.
Platform NRR ≥ 110% and rising ARR → reinvestment runway.
Share count shrinking at reasonable valuation; SBC < 5–7% of revenue preferred.
Pitfalls and false positives
Conflating cyclical mortgage volumes with structural pricing gains, normalize originations over the cycle.
Ignoring reseller/bureau dynamics: near-term friction can affect reported mix/timing.
Treating SBC as “free.” It dilutes owners—adjust per-share metrics accordingly.
Over-crediting the platform ARR without verifying gross margin and considering service drag.
Paying any price for quality. Even great economics can disappoint if expectations are too high.
Checklist / one-pager
ROIC spread: ROIC – WACC ≥ 5% for 5+ years?
Pricing power evidence: realized price increases with no churn spike? Contractual escalators?
Incremental margins: Scores-like unit economics? Flow-through visible?
FCF conversion: >90% over cycle? Lumpy quarters explained by WC timing?
Per-share: FCF/share and EPS growing; diluted share count falling; SBC manageable?
Reinvestment: Platform ARR growth and NRR ≥ 110%? Runway for many years?
Moat: Standardized/embedded in workflows; switching costs high; margin stability across cycles?
Capital allocation: Buybacks sensible vs valuation; debt manageable; optionality for M&A.
Valuation sanity: EV/FCF vs 5–10y median; scenario analysis for normalized growth/margins.
Mini-FAQ
Why do incremental margins matter more than total margins?
Because they tell you what happens to the next dollar of revenue. In asset-light businesses, most of that next dollar becomes profit/FCF.Is SBC a real expense?
Economically yes—it dilutes owners. Include it either by reducing per-share metrics or by treating SBC as a cash-like expense proxy.How do I normalize mortgage-driven volatility?
Use multi-year averages for originations and stress test with a trough scenario.What’s a good NRR for platform software?
≥110% is strong; the higher, the better. It signals pricing power and usage growth without new logo adds.How do I think about buybacks at a premium valuation?
They still add per-share value if intrinsic value > repurchase price. Use EV/FCF vs history and scenario-based intrinsic value estimates.
Glossary
ROIC: After-tax operating return on invested capital.
WACC: Weighted average cost of capital; the hurdle rate for value creation.
Incremental margin: Profit on the next dollar of revenue; a measure of flow-through.
FCF conversion: How much of net income turns into free cash flow over time.
ARR: Annual recurring revenue; forward-looking recurring base in software.
NRR/DBNRR: Net revenue retention; growth from existing customers (expansion minus churn/contraction).
Owner earnings: Buffett’s term for economic earnings; approximates cash earnings after maintenance needs.
SBC: Stock-based compensation; non-cash accounting expense that dilutes shareholders.
Further reading
FICO Annual Reports archive (multi-year): Financial Information - FICO investor relations (as of 2025-10-15)
FICO Quarterly highlight decks and Reg G: Presentations - FICO IR (as of 2025-10-15)
Q2 FY2025 call transcript (overview of recent performance, FCF trends, buybacks): Investing.com transcript (as of 2025-04-29)
References
FICO Investor Relations: Annual Reports and Filings — Financial Information - FICO investor relations (as of 2025-10-15)
FICO Investor Presentations: Q2 FY2025 and Q3 FY2025 highlights, Reg G — Presentations - FICO IR (as of 2025-10-15)
Q2 FY2025 Earnings Call Transcript (revenue growth, FCF, buybacks, segment details) — Investing.com transcript (as of 2025-04-29)
Quick reference for shares outstanding/market data — StockAnalysis: Fair Isaac (FICO) (as of 2025-10-15)
Disclaimer: Educational content, not investment advice.